CHAPTER 1 - MARKET SUMMARY
Market Overview
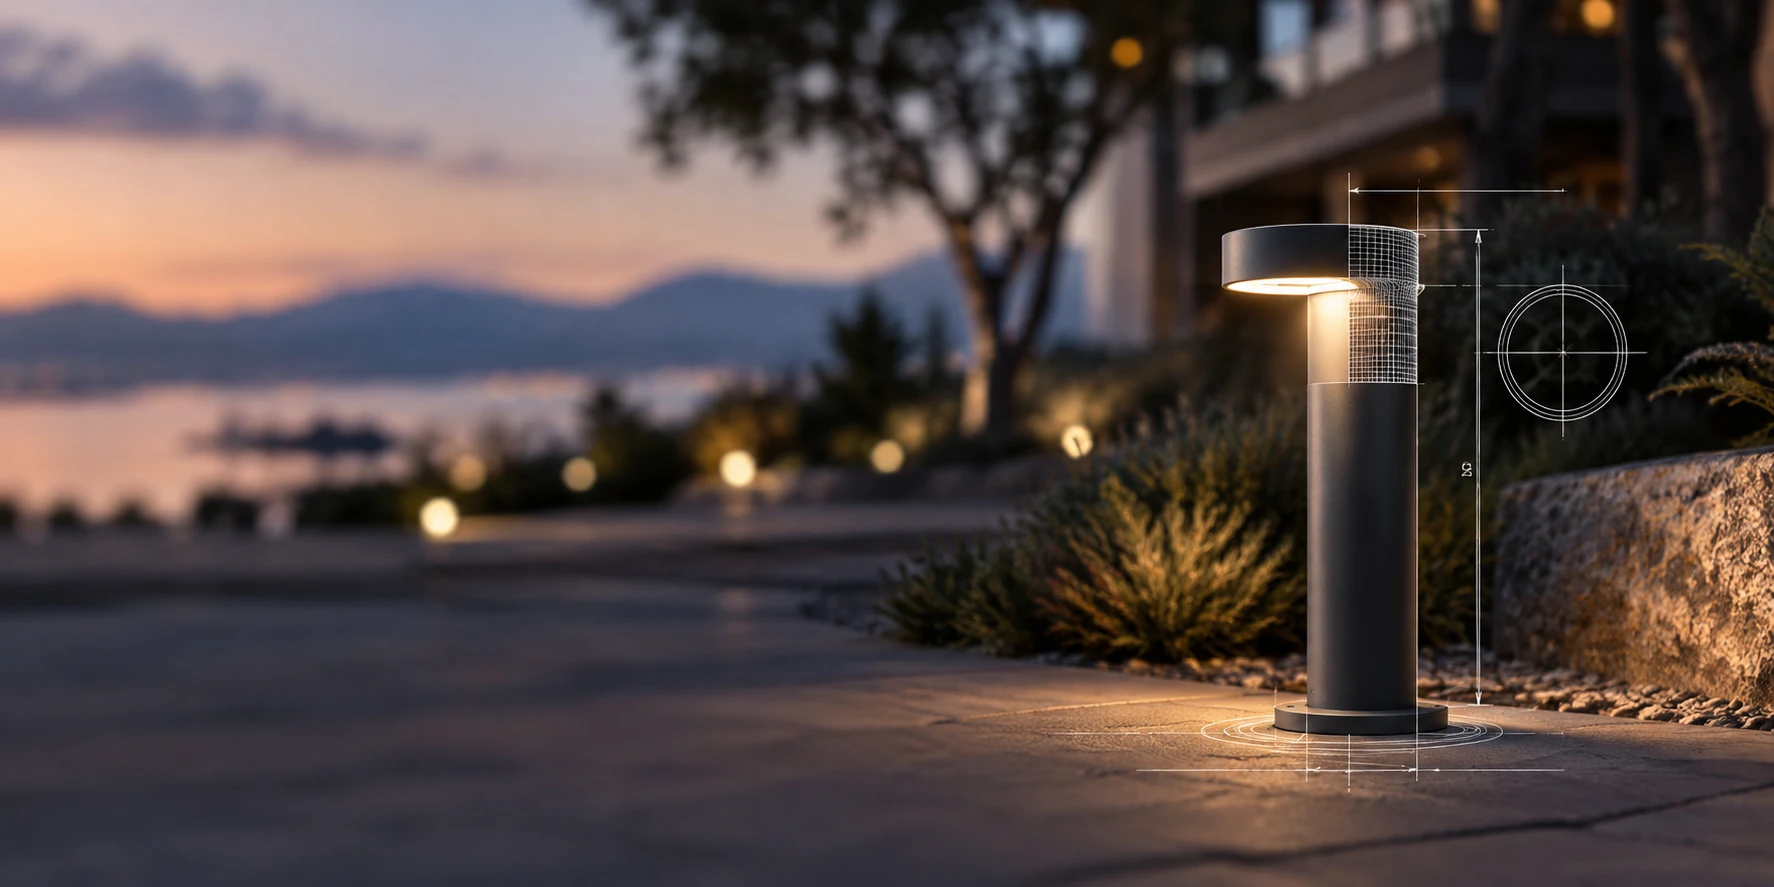
The Global Outdoor Pathway Lighting Market converts residential, commercial and public-realm landscaping expenditure into fixture, transformer, control and installation revenue. Global urbanization reached approximately 57.8% in 2025, expanding the stock of walkways, mixed-use developments, hospitality properties and public spaces requiring nighttime visibility. This creates recurring demand through new construction, landscape renovation and replacement cycles.
North America remains the largest revenue pool, representing an estimated 35% of 2025 pathway-lighting value. Its position reflects high detached-home landscaping expenditure, mature electrical-distribution networks and broad availability of professional low-voltage systems. The region also benefits from established landscape contractors who bundle luminaires, transformers, cabling, controls and maintenance into higher-value project packages.
Market Value
USD 810 million
2025
Dominant Region
North America
2025
Dominant Segment
Technology, connected and zoned pathway systems
fastest growing, 2026-2031
Total Number of Players
185
Future Outlook
The Global Outdoor Pathway Lighting Market is projected to increase from USD 810 million in 2025 to USD 1,257 million by 2031. The market expanded at a historical CAGR of 5.84% between 2020 and 2025 as LED adoption, residential outdoor renovation and commercial landscaping recovered from pandemic-related disruption. Forecast growth accelerates to 7.60% during 2026-2031, reflecting rising solar fixture performance, smart-control attach rates and investment in pedestrian-oriented public spaces. Higher-value integrated systems will progressively displace basic incandescent, halogen and non-controlled fixtures, raising average revenue per installation while reducing energy and maintenance intensity.
Volume is forecast to rise from 19.8 million fixtures in 2025 to 28.1 million fixtures by 2031. Average selling prices are expected to move from USD 40.9 to USD 44.7 per fixture as connected controls, corrosion-resistant materials, modular LED engines and professional-grade optics gain mix. Asia Pacific is expected to deliver the fastest regional expansion, while North America remains the largest value market. Competitive advantage will depend on contractor relationships, product availability, warranty performance, photometric quality and compliance with increasingly restrictive glare, shielding and color-temperature expectations. Suppliers positioned across both professional and consumer channels should capture the broadest addressable demand.
7.60%
Forecast CAGR
$1,257 Mn
2030 Projection
Base Year
2025
Historical Period
2020-2025
Forecast Period
2026-2031
Historical CAGR
5.84%
CHAPTER 2 - SCOPE OF REPORT
Scope of the Market
CHAPTER 3 - Key Stakeholders
Key Target Audience
Key stakeholders who can leverage from this market analysis for investment, strategy, and operational planning.
Investors
CAGR, channel margins, product mix, working capital, consolidation
Corporates
market entry, pricing, product roadmap, partnerships, geographic expansion
Government
pedestrian safety, energy efficiency, light pollution, procurement standards
Operators
installation productivity, warranty claims, controls, inventory, contractor retention
Financial institutions
demand stability, cash conversion, leverage, capex, technology risk
CHAPTER 4 - Market Size & Growth
Market Size, Growth Forecast and Trends
This section evaluates the historical market size, analyzes year-over-year growth dynamics, and presents forecast projections supported by market performance indicators and demand-side drivers.
Historical & Projected Market Size ($ Million)
Year-over-Year Growth Rate (%)
Market Value vs Volume Growth (%)
Historical Market Performance (2020-2025)
The market progressed from USD 610 million in 2020 to USD 810 million in 2025. Growth reached its historical-period peak at 6.2% in 2023 as hospitality projects resumed and distributors normalized inventories. Volume increased from 16.1 million to 19.8 million fixtures, while average selling price rose from USD 37.9 to USD 40.9. Revenue growth therefore reflected both unit expansion and a gradual mix shift toward integrated LED, improved materials, solar power and control-enabled systems.
Forecast Market Outlook (2026-2031)
Forecast value growth is expected to stabilize near 7.6% annually after accelerating to 7.7% in 2026. The market reaches USD 1,257 million in 2031, supported by 28.1 million annual fixture shipments. Connected and zoned products, higher-output solar systems and professional-grade bollards will increase revenue faster than basic fixture volumes. Asia Pacific becomes the principal incremental-growth engine, while established North American and European markets contribute replacement demand, premium specifications and stronger control-system attachment.
CHAPTER 5 - Market Data
Market Breakdown
The Global Outdoor Pathway Lighting Market combines volume-driven consumer fixtures with specification-led professional systems. For CEOs and investors, the most important variables are fixture shipments, average selling price and the share of LED-based products supporting higher lifetime value.
Year | Market Size (USD Mn) | YoY Growth (%) | Fixture Shipments (Mn Units) | Average Selling Price (USD/Unit) | LED-Based Product Mix (%) | Period |
|---|---|---|---|---|---|---|
| 2020 | $610 Mn | +- | 16.1 | 37.9 | Forecast | |
| 2021 | $642 Mn | +5.2% | 16.7 | 38.4 | Forecast | |
| 2022 | $680 Mn | +5.9% | 17.4 | 39.1 | Forecast | |
| 2023 | $722 Mn | +6.2% | 18.2 | 39.7 | Forecast | |
| 2024 | $764 Mn | +5.8% | 19.0 | 40.2 | Forecast | |
| 2025 | $810 Mn | +6.0% | 19.8 | 40.9 | Forecast | |
| 2026 | $872 Mn | +7.7% | 21.0 | 41.5 | Forecast | |
| 2027 | $938 Mn | +7.6% | 22.3 | 42.1 | Forecast | |
| 2028 | $1,009 Mn | +7.6% | 23.6 | 42.8 | Forecast | |
| 2029 | $1,086 Mn | +7.6% | 25.0 | 43.4 | Forecast | |
| 2030 | $1,168 Mn | +7.6% | 26.5 | 44.1 | Forecast | |
| 2031 | $1,257 Mn | +7.6% | 28.1 | 44.7 | Forecast |
Fixture Shipments
19.8 million units, 2025, global. Scale improves component purchasing and distributor economics, but value creation depends on premium mix. Outdoor landscape lighting is forecast to add USD 961.1 million during 2026-2030.
Average Selling Price
USD 40.9 per unit, 2025, global. ASP expansion reflects integrated LEDs, corrosion-resistant housings and smart controls. LED products can operate up to 90% more efficiently than incandescent lighting, supporting lifecycle-based customer purchasing.
LED-Based Product Mix
87%, 2025, global. LED dominance shifts competition toward optics, electronics, warranties and controls rather than lamp replacement. Signify reported that LED-based products represented 85% of sales in 2024, illustrating the maturity of the broader lighting transition.
CHAPTER 6 - Segmentation
Market Segmentation Framework
Comprehensive analysis across key dimensions providing insights into market structure, consumer preferences, and distribution patterns.
No of Segments
7
Dominant Segment
Product Type
Fastest Growing Segment
Technology
Product Type
Light Source
Application
Customer Type
Sales Channel
Technology
Geography
Key Segmentation Takeaways
Comprehensive analysis across all extracted segmentation dimensions providing insights into market structure, consumer preferences, and distribution patterns.
Product Type
Product configuration remains the dominant commercial segmentation because fixture form determines installation method, lumen distribution, material intensity and selling price. Bollard path lights generate the largest professional revenue pool through commercial, hospitality and public applications, while stake lights dominate consumer and contractor-led residential volumes. In-ground and step fixtures command smaller volumes but higher specification and installation requirements.
Technology
Technology is the fastest-growing dimension as buyers transition from fixed-output products to photocell, motion-sensing and zoned control systems. Connected and zoned systems are expected to expand fastest because they enable scheduling, dimming, color adjustment and multi-zone management. Adoption is strongest in premium residential, hospitality and campus projects where lighting scenes, energy performance and remote maintenance justify higher upfront costs.
CHAPTER 7 - Regional Analysis
Regional Analysis
North America is the largest regional market, while Asia Pacific provides the strongest forecast growth through expanding urban infrastructure, hospitality construction and residential landscaping. Regional differences in channel maturity, average selling price and solar-system adoption create distinct go-to-market requirements for manufacturers and distributors.
North America Regional Ranking
1st
North America Market Size (2025)
USD 284 Mn
North America CAGR (2026-2031)
6.3%
North America Regional Ranking
1st
North America Market Size (2025)
USD 284 Mn
North America CAGR (2026-2031)
6.3%
Regional Analysis (Current Year)
Regional Analysis Comparison
Market Position
North America ranks first with USD 284 million in 2025, supported by mature professional-landscape channels and a regional outdoor-lighting market exceeding USD 5.9 billion across broader applications.
Growth Advantage
Asia Pacific's estimated 9.2% CAGR exceeds North America's 6.3% and Europe's 7.1%, positioning it as the main incremental-volume region as urban growth concentrates in Asia and Africa.
Competitive Strengths
North America combines premium ASPs, established contractor networks and high LED readiness. DOE evidence indicates outdoor LED replacement can reduce energy consumption by 50% or more before additional control savings.
CHAPTER 8 - INDUSTRY ANALYSIS
Growth Drivers, Challenges & Opportunities
Comprehensive analysis of key factors shaping the Global Outdoor Pathway Lighting Market, including growth catalysts, operational challenges, and emerging opportunities across production, distribution, and consumer segments.
Growth Drivers
Urban Development and Pedestrian-Oriented Public Spaces
- More than 4 billion urban residents (current period, global) increase investment requirements for safe pedestrian circulation around housing, offices, parks and transport assets, supporting specification-led pathway products.
- Cities generate approximately 80% of global GDP (current period, global), concentrating property development and public-realm budgets in locations where lighting suppliers can scale distributor and contractor coverage.
- Nearly 90% of additional urban population through 2050 (Asia and Africa) is expected in Asia and Africa, shifting incremental demand toward climate-resistant, solar and value-engineered fixtures.
LED Efficiency and Lifecycle Economics
- LED lamps can deliver 80%-90% energy savings versus incandescent products (2022, global benchmark), enabling suppliers to sell against lifecycle cost rather than fixture price alone.
- Lighting represented approximately 2,200 TWh of electricity demand (2024, global), keeping efficiency upgrades relevant to property owners, governments and sustainability-linked capital programs.
- A full outdoor LED transition could generate approximately USD 6 billion in annual savings (US estimate), strengthening the economic case for replacement programs and performance-based procurement.
Controls, Solar Power and Connected Ecosystems
- Pathway-control demonstrations generated an additional 46% energy reduction (City of Davis project) versus static LED luminaires, supporting motion sensors and adaptive dimming as monetizable upgrades.
- Signify's connected-lighting base reached 167 million light points (2025, global), indicating that controls, software and data services are scaling beyond pilot deployments.
- Solar systems remove trenching and grid-connection requirements, allowing distributors and installers to address remote paths, gardens and temporary sites where electrical infrastructure would otherwise constrain project returns.
Market Challenges
Price Competition and Product Commoditization
- Consumer products compete across marketplaces and home-improvement retailers, compressing margins when optical quality, battery capacity and material durability are difficult for buyers to assess before installation.
- Low-price solar products can underperform because of small panels, limited battery capacity and poor weather sealing, increasing returns and reducing trust across the wider solar pathway category.
- Manufacturers must fund photometric design, tooling and warranty reserves while competing against private-label products, creating a structural scale advantage for brands with diversified channels and component purchasing power.
Regulatory and Environmental Compliance
- Suppliers must coordinate efficiency, technical-documentation and product-registration obligations across jurisdictions, increasing engineering and certification cost for firms with fragmented product portfolios.
- DarkSky guidance promotes lighting that is useful, targeted, low-level, controlled and warm-colored (2024 guidance), requiring improved shielding and control rather than unrestricted lumen output.
- Recommendations for 2700K or lower CCT (2025, DarkSky guidance) can limit blue-rich products and require manufacturers to offer warmer, shielded variants for environmentally sensitive projects.
Installation Complexity and Fragmented Channels
- Incorrect voltage-drop calculations, fixture spacing or transformer sizing can reduce output and system life, making installer education and technical support critical operating costs.
- Electrical distributors, landscape dealers, retailers and e-commerce platforms require different packaging, pricing and inventory strategies, increasing working-capital requirements for multichannel suppliers.
- Project seasonality exposes contractors and distributors to weather-related installation delays, while manufacturers must maintain broad inventories across finishes, beam patterns and mounting formats.
Market Opportunities
Premium Connected Pathway Systems
- Suppliers can bundle fixtures, transformers, gateways, software and commissioning, lifting revenue per site above standalone luminaire sales.
- Premium manufacturers, landscape contractors and property managers capture value through zoning, remote diagnostics, scene control and reduced maintenance visits.
- Open interfaces, simplified commissioning and interoperable controls are required to reduce installation friction and avoid isolated proprietary ecosystems.
Professional-Grade Solar Pathway Lighting
- Commercial-grade solar systems can command premiums through larger panels, replaceable batteries, reliable optics and monitored energy performance.
- Municipalities, resorts, developers and remote-site operators avoid trenching and grid-extension costs, while installers shorten project execution schedules.
- Standardized battery specifications, realistic lumen claims and stronger weather testing are needed to separate professional systems from low-durability consumer products.
Dark-Sky and Wildlife-Sensitive Product Portfolios
- Certified or specification-ready luminaires can achieve higher margins in resorts, parks, coastal areas and conservation-sensitive developments.
- Architectural brands, lighting designers and public agencies gain differentiated products that balance pedestrian safety with glare and ecological requirements.
- Procurement specifications must shift from wattage and fixture count toward photometry, shielding, CCT, scheduling and measured light trespass.
CHAPTER 9 - Competitive Landscape
Competitive Landscape Overview
The market is moderately fragmented, combining global lighting groups with landscape specialists and digital-first brands. Entry barriers are highest in professional channels where photometric performance, contractor loyalty, warranties, product breadth and inventory availability influence specification decisions.
Market Share Distribution
Top 5 Players
Market Dynamics
8 new entrants in the past 5 years, indicating strong market attractiveness and growth potential.
Company Name | Market Share | Headquarters | Founding Year | Core Market Focus |
|---|---|---|---|---|
Signify N.V. | - | Eindhoven, Netherlands | 2016 | Professional and consumer LED lighting, connected controls and outdoor luminaires |
Acuity Inc. | - | Atlanta, United States | 2001 | Commercial outdoor luminaires, controls and architectural lighting systems |
Current Lighting Solutions, LLC | - | Greenville, United States | - | Commercial exterior lighting, controls and public-space illumination |
Kichler Lighting LLC | - | Solon, United States | 1938 | Residential and professional landscape, pathway and decorative outdoor lighting |
WAC Lighting | - | Port Washington, United States | - | LED landscape fixtures, color control and connected outdoor systems |
Hunter Industries, Inc. (FX Luminaire) | - | San Marcos, United States | - | Professional landscape lighting, zoning, dimming and color-control platforms |
BEGA Gantenbrink-Leuchten KG | - | Menden, Germany | - | Architectural outdoor, bollard, in-ground and public-realm luminaires |
Schréder S.A. | - | Brussels, Belgium | 1907 | Connected public-space, pedestrian and urban outdoor lighting |
Gama Sonic USA, Inc. | - | Atlanta, United States | - | Solar pathway, garden, residential and commercial outdoor lighting |
VOLT Lighting LLC | - | Lutz, United States | - | Professional low-voltage landscape lighting and direct distribution |
Cross Comparison Parameters
The report provides detailed cross-comparison of key players across 10 performance parameters to identify competitive strengths and weaknesses.
Analysis Covered
Market Share Analysis:
Evaluates player scale across professional and consumer pathway-lighting revenue pools
Cross Comparison Matrix:
Benchmarks product mix, controls, growth and profitability across competitors
SWOT Analysis:
Identifies strategic strengths, vulnerabilities, opportunities and execution risks by company
Pricing Strategy Analysis:
Compares value, premium, specification-led and connected-system pricing approaches globally
Company Profiles:
Reviews positioning, product focus, channels and pathway-lighting competitive capabilities
CHAPTER 10 - REPORT TOC
Table of Contents
Market Assessment Phase
Supply-side and competitive intelligence covering market sizing, segmentation, competitive dynamics, regulatory landscape, and future forecasts.
Go-To-Market Strategy Phase
15 chapters
Entry strategy evaluation, execution roadmap, partner recommendations, and profitability outlook.
Survey Phase
8 chapters
Demand-side primary research conducted through structured interviews and online surveys with end users across priority metros and Tier 2/3 cities to capture consumption behavior, unmet needs, and purchase drivers.
Complete Report Coverage
201+ detailed sections covering every aspect of the market
143
Assessment Sections
58
Strategy Sections
CHAPTER 11 - Our Approach
Research Methodology
Desk Research
- Reviewed outdoor lighting market benchmarks
- Mapped pathway product and channel portfolios
- Analyzed lighting efficiency policy requirements
- Tracked urban development demand indicators
Primary Research
- Interviewed landscape lighting product managers
- Consulted electrical distribution category directors
- Engaged landscape contractor business owners
- Surveyed municipal lighting procurement managers
Validation and Triangulation
- Validated assumptions across 286 respondents
- Reconciled supplier and channel estimates
- Cross-checked volume and ASP models
- Tested regional demand allocation consistency
CHAPTER 12 - FAQ
FAQs
Still have questions?
Our research team is here to help you find the right solution
CHAPTER 13 - Related Research
Explore Related Reports
Expand your market intelligence with complementary research across regions and adjacent markets.
Regional/Country ReportsRelated market analysis across key regions
Related market analysis across key regions
No regional reports found.
Adjacent ReportsRelated markets and complementary research
Related markets and complementary research
- Middle East Outdoor Furniture Market Report Size Share Growth Drivers Trends Opportunities & Forecast 2025–2030
- Saudi Arabia Smart City Infrastructure Market
- KSA Solar Street Lighting Market
- Belgium Pedestrian Safety Systems Market
- India Construction Equipment Rental Market Size, Share & Forecast, By Equipment Type, End-Use Industry & Rental Duration, 2026-2031
500+
Market Research Reports
50+
Countries Covered
15+
Industry Verticals