
USA Bus Market Outlook to 2030
Region:North America
Author(s):Yogita Sahu
Product Code:KROD3562
October 2024
83
About the Report
USA Bus Market Overview
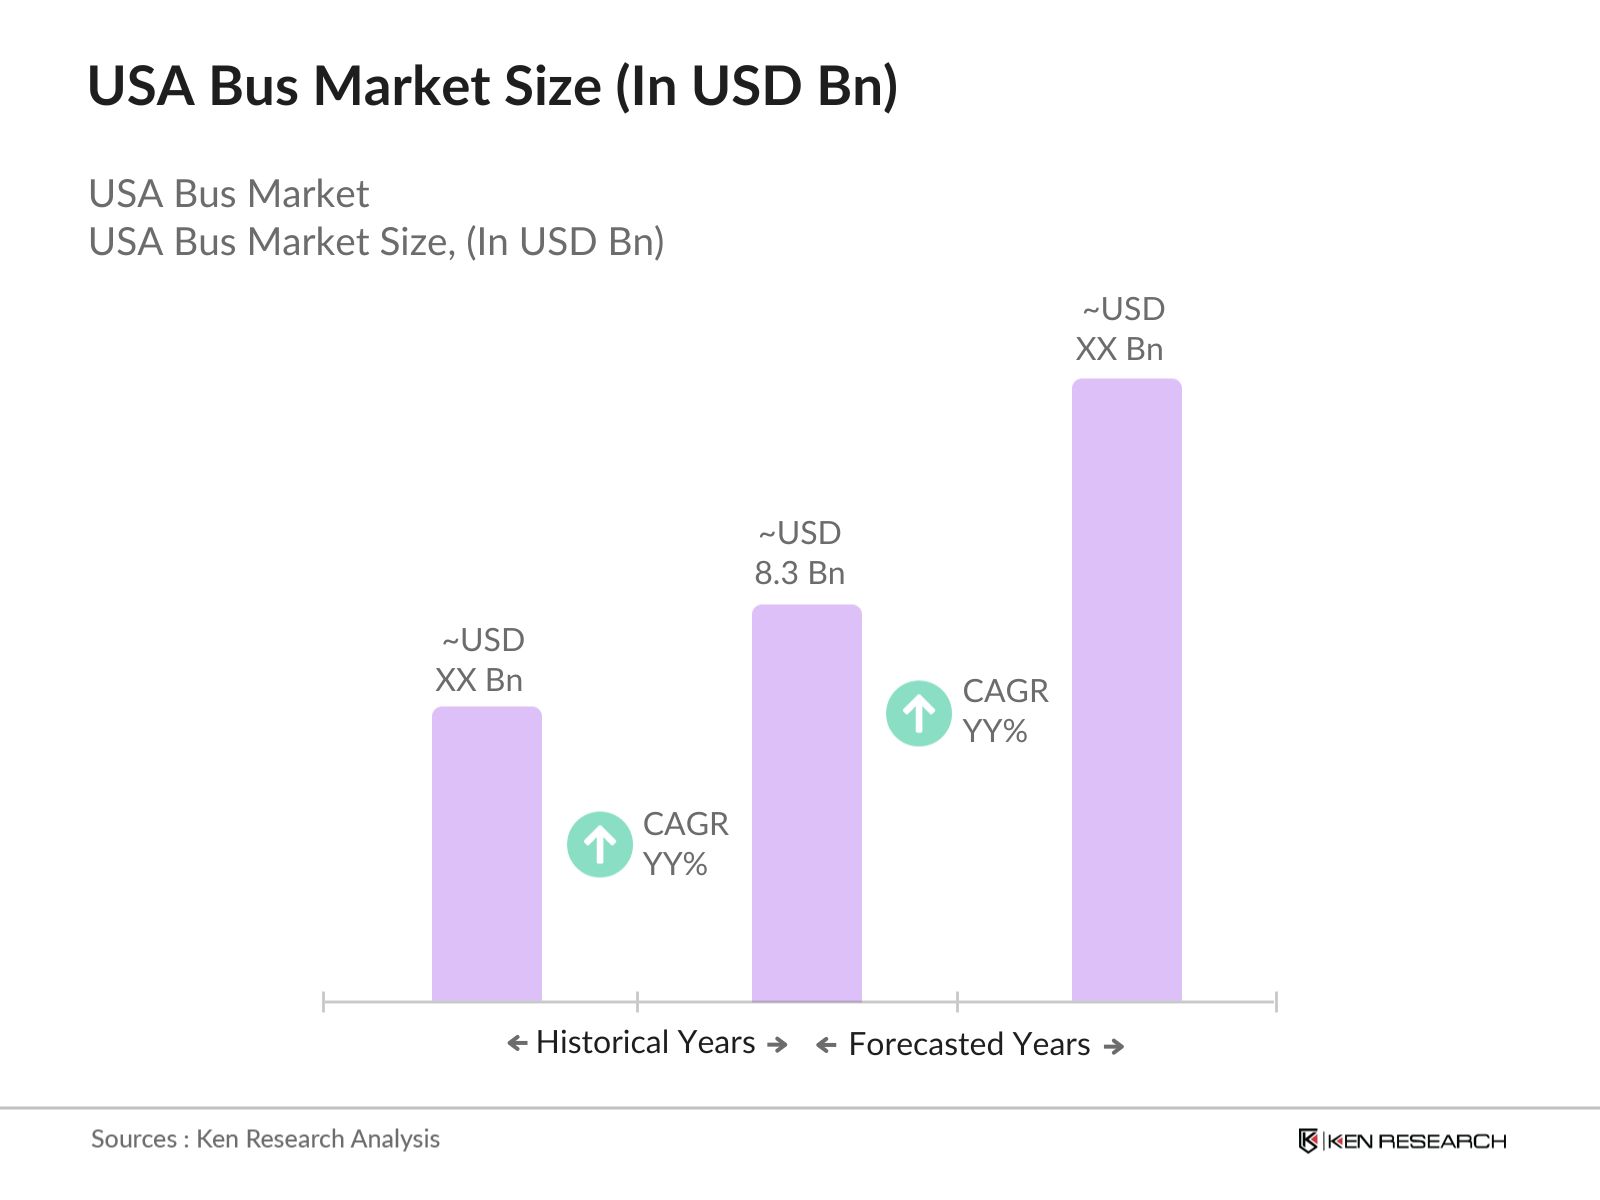
- The USA bus market is valued at USD 8.3 billion, according to a historical five-year analysis. This market is driven by government initiatives aimed at reducing carbon emissions through electrification, public demand for enhanced public transportation systems, and significant infrastructure investments. With increasing urbanization, major metropolitan areas are investing in fleet expansions and upgrades to accommodate a growing population.
- In terms of regional dominance, cities such as New York, Los Angeles, and Chicago lead the market due to their large population densities and strong public transportation networks. These cities have an established and growing infrastructure, making them well-suited to adopt new technologies such as electric and hybrid buses.
- The Bipartisan Infrastructure Law passed in 2021 allocated over $39 billion to modernize public transit in the U.S., including the bus market. By 2024, this funding has helped over 100 transit agencies across the country to procure electric and hybrid buses. The law also focuses on expanding bus rapid transit (BRT) systems, improving intercity connectivity, and reducing greenhouse gas emissions.
USA Bus Market Segmentation
By Bus Type: The market is segmented by bus type into diesel buses, electric buses, hybrid buses, and hydrogen buses. Electric buses have gained a dominant market share due to increased demand for environmentally friendly solutions and government mandates for reducing carbon emissions. Public transit authorities across major cities are increasingly adopting electric buses as part of their fleets, driven by incentives such as the Federal Transit Administration's Low or No Emission Vehicle Program.

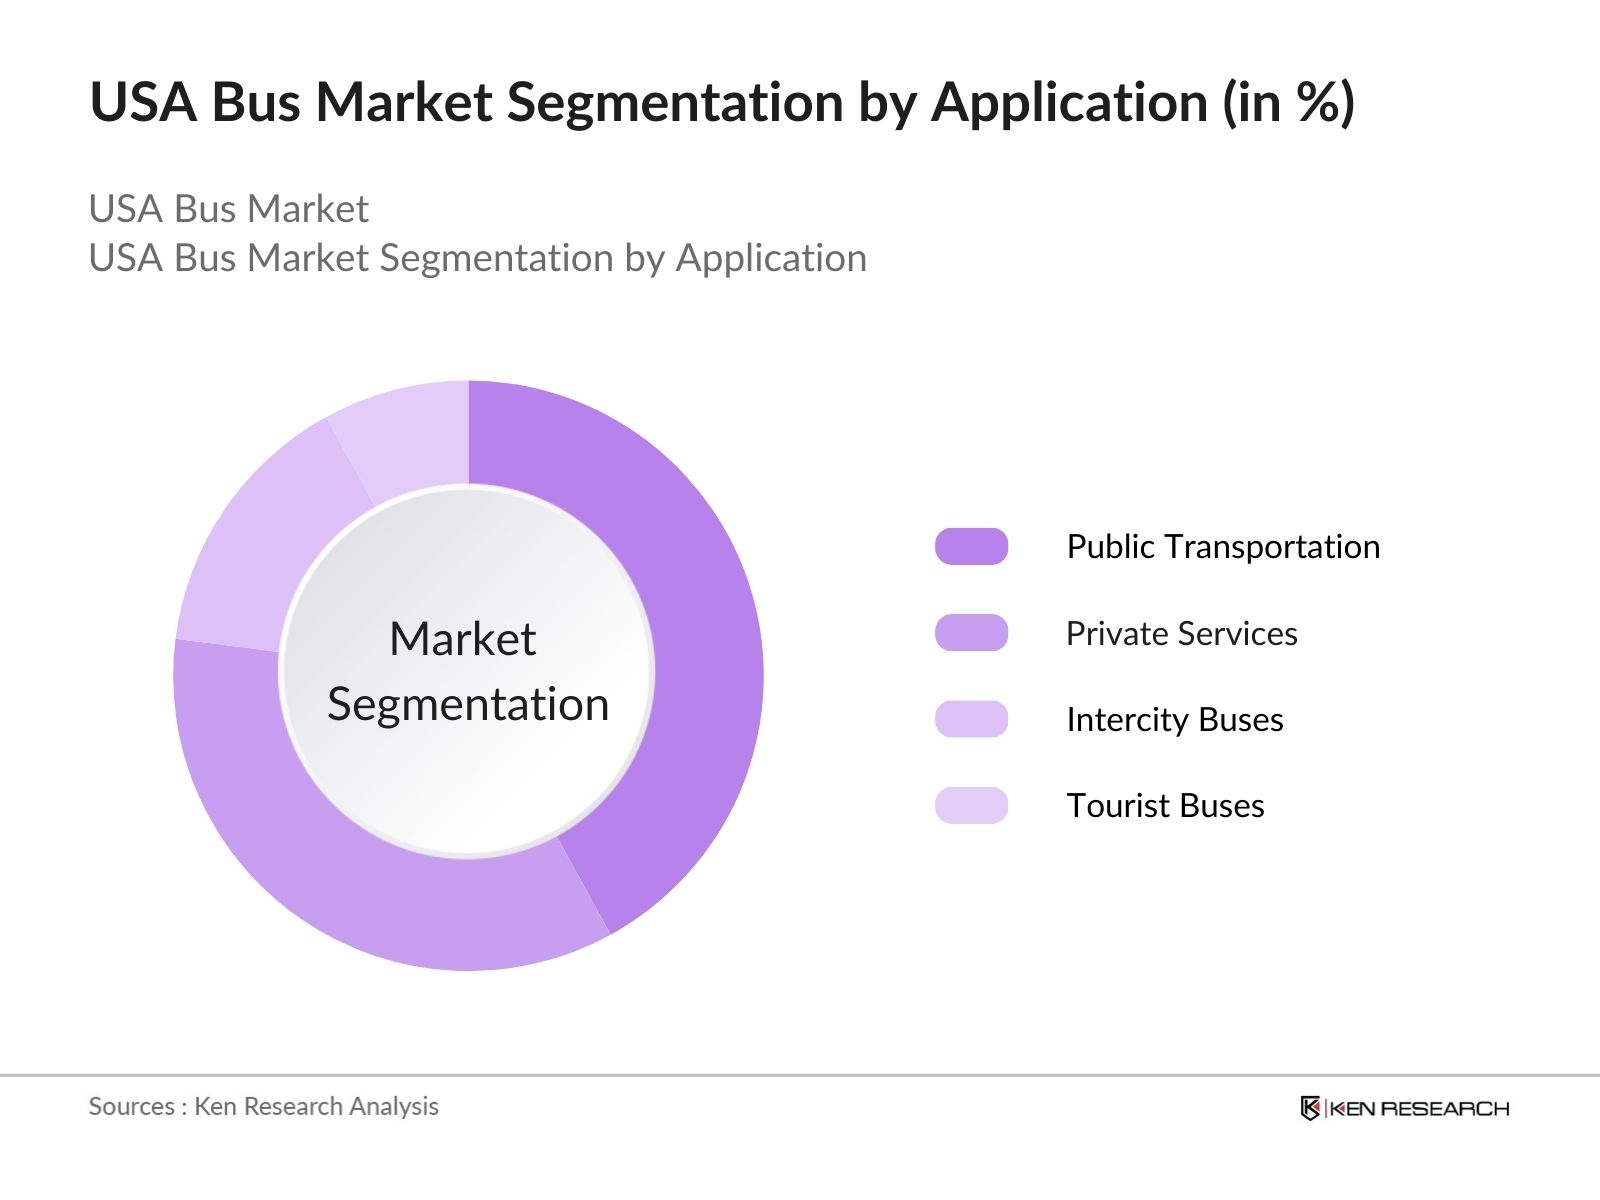
By Application: The market is segmented by application into public transportation, private services (schools, corporations), intercity buses, and tourist buses. Public transportation holds the largest market share due to the extensive use of buses in metropolitan areas for daily commuting. Cities like New York and Los Angeles rely heavily on buses to supplement other forms of mass transit such as subways and trains. Moreover, rising traffic congestion and efforts to reduce private vehicle use have driven municipalities to expand their bus fleets.
USA Bus Market Competitive Landscape
The market is dominated by a mix of domestic and international manufacturers, with companies like Proterra and Blue Bird focusing on electric bus solutions, while global players such as BYD and Nova Bus maintain a strong foothold in hybrid and diesel buses. This consolidation highlights the significant influence of key companies in shaping the market, especially in terms of technological innovation and fleet electrification.
|
Company |
Established |
Headquarters |
Fleet Size |
Product Portfolio |
Annual Revenue (2023) |
R&D Investments |
Market Expansion |
|
Proterra Inc. |
2004 |
Burlingame, California |
|||||
|
Blue Bird Corporation |
1932 |
Fort Valley, Georgia |
|||||
|
BYD Motors Inc. |
1995 |
Los Angeles, California |
|||||
|
New Flyer Industries |
1930 |
Winnipeg, Canada |
|||||
|
Gillig LLC |
1890 |
Livermore, California |
USA Bus Market Analysis
Market Growth Drivers
- Electrification of Buses: The growing emphasis on reducing carbon emissions in the transportation sector is driving the adoption of electric buses in the USA. The U.S. government allocated $5.5 billion in 2022 to help states and local governments transition to zero-emission buses, as part of the Bipartisan Infrastructure Law. By 2024, major cities such as Los Angeles and New York have committed to converting a significant portion of their bus fleets to electric models. This initiative aligns with federal emission targets and promotes investments in charging infrastructure, further fueling market demand for electric buses.
- Public Transport Infrastructure Development: The increasing focus on improving public transport systems has been a key driver for the market. The Federal Transit Administration's (FTA) "Capital Investment Grants Program" has seen an investment of $2 billion in 2023 to enhance bus systems in various states. Cities such as San Francisco and Seattle are expanding their bus rapid transit (BRT) networks, which are highly efficient in congested urban areas. This ongoing infrastructure development is creating new opportunities for manufacturers and service providers in the bus market.
- Investments in Autonomous Technology: Advancements in autonomous driving technology are fostering growth in the market. Several trials of autonomous buses have been initiated in states like California and Michigan. In 2023, the National Highway Traffic Safety Administration (NHTSA) approved $200 million for pilot programs testing autonomous electric buses. These buses are equipped with advanced sensors and AI technology, contributing to enhanced passenger safety and fuel efficiency. The rise of autonomous buses could revolutionize public transport systems in the coming years, encouraging further investment.
Market Challenges
- Aging Bus Fleet: The aging fleet of buses in many U.S. cities is a challenge for the industry. According to the U.S. Department of Transportation, the average age of a public transit bus in 2023 was over 8 years. This leads to increased maintenance requirements and higher fuel consumption. Replacing aging fleets is a costly process, and many public transport agencies lack the necessary funding to modernize their buses, particularly with the push toward electrification.
- Lack of Skilled Workforce for Maintenance: The transition to electric and autonomous buses has created a skills gap in the maintenance workforce. Maintaining electric buses requires specialized training in battery systems, charging infrastructure, and advanced electronics. The National Transit Institute reported that over 5,000 positions for skilled bus mechanics and technicians remain unfilled in 2024. This shortage increases operational downtime and reduces the efficiency of bus services in cities across the U.S.
USA Bus Market Future Outlook
Over the next five years, the USA bus industry is expected to experience growth driven by increasing adoption of electric buses, government initiatives focused on reducing carbon emissions, and investments in public transportation infrastructure. The shift towards electrification, combined with technological advancements in battery and fuel cell technologies, is poised to redefine the landscape of urban and intercity bus transit.
Future Market Opportunities
- Adoption of Hydrogen Fuel Cell Buses: The use of hydrogen fuel cell buses is expected to grow in the coming years. By 2028, states like California and Michigan will have expanded their hydrogen-powered bus fleets, with over 500 hydrogen buses projected to be in operation. This technology offers longer ranges compared to electric buses, making it suitable for long-distance and intercity routes.
- Increased Investment in Autonomous Buses: Autonomous buses are poised to become a more common sight on U.S. roads over the next five years. Several pilot programs in states like Michigan, California, and New York are expected to transition into full-scale deployments by 2028. The National Highway Traffic Safety Administration projects that autonomous buses will improve fuel efficiency by reducing human error and optimizing driving patterns.
Scope of the Report
|
Bus Type |
Diesel Buses Electric Buses Hybrid Buses Hydrogen Buses |
|
Application |
Public Transportation Private Services Intercity Buses Tourist Buses |
|
Powertrain |
Internal Combustion Engine (ICE) Battery Electric Vehicle (BEV) Hybrid Electric Vehicle (HEV) Fuel Cell Electric Vehicle (FCEV) |
|
Seating Capacity |
Less than 30 Seats 30 to 50 Seats More than 50 Seats |
|
Region |
North East West South |
Products
Key Target Audience Organizations and Entities Who Can Benefit by Subscribing This Report:
Bus Manufacturers and OEMs
Government and Regulatory Bodies (e.g., U.S. Department of Transportation, Federal Transit Administration)
Banks and Financial Institutions
Electric Vehicle Component Manufacturers
Investors and Venture Capitalist Firms
Private Equity Firms
Automotive Dealerships
Companies
Players Mentioned in the Report:
Proterra Inc.
Blue Bird Corporation
BYD Motors Inc.
New Flyer Industries
Gillig LLC
Thomas Built Buses (Daimler)
IC Bus (Navistar)
Van Hool
Nova Bus (Volvo)
Eldorado National
MCI (Motor Coach Industries)
Prevost
Alexander Dennis Limited
Freightliner Custom Chassis Corporation
ABC Companies
Table of Contents
1. USA Bus Market Overview
1.1. Definition and Scope
1.2. Market Taxonomy
1.3. Market Growth Rate (Urbanization, Public Transit Demand)
1.4. Market Segmentation Overview
2. USA Bus Market Size (In USD Bn)
2.1. Historical Market Size (In Value)
2.2. Year-on-Year Growth Analysis
2.3. Key Market Developments and Milestones
3. USA Bus Market Analysis
3.1. Growth Drivers
Public Transportation Funding
Electrification and Green Initiatives
Government Support for Emission Reduction
Increasing Urban Population
3.2. Market Challenges
High Initial Investment Costs
Infrastructure Limitations
Regulatory Barriers for Electrification
Competition from Ride-sharing Apps
3.3. Opportunities
Adoption of Electric Buses
Expansion into Rural and Suburban Areas
Smart City Integration
Federal Infrastructure Investments
3.4. Market Trends
Adoption of Autonomous Buses
Transition to Electric and Hydrogen-Fueled Buses
Expansion of Intercity Bus Routes
Integration of IoT and Smart Technologies
3.5. Government Regulations
3.5.1. Emission Standards (EPA Regulations, Clean Air Act)
3.5.2. Federal and State Transportation Funding Programs
3.5.3. Buy America Act Compliance
3.5.4. Incentives for Electric Bus Adoption
3.6. SWOT Analysis
3.7. Stakeholder Ecosystem
3.8. Porters Five Forces Analysis
3.9. Competitive Ecosystem (Fleet Size, Revenue, Service Areas)
4. USA Bus Market Segmentation
4.1. By Bus Type (In Value %)
Diesel Buses
Electric Buses
Hybrid Buses
Hydrogen Buses
4.2. By Application (In Value %)
Public Transportation
Private Services (Schools, Corporations)
Intercity Buses
Tourist Buses
4.3. By Powertrain (In Value %)
Internal Combustion Engine (ICE)
Battery Electric Vehicle (BEV)
Hybrid Electric Vehicle (HEV)
Fuel Cell Electric Vehicle (FCEV)
4.4. By Seating Capacity (In Value %)
Less than 30 Seats
30 to 50 Seats
More than 50 Seats
4.5. By Region (In Value %)
North
East
South
West
5. USA Bus Market Competitive Analysis
5.1. Detailed Profiles of Major Competitors
Blue Bird Corporation
BYD Motors Inc.
New Flyer Industries
Proterra Inc.
Gillig LLC
IC Bus (Navistar)
Thomas Built Buses (Daimler)
Van Hool
Eldorado National
Nova Bus (Volvo)
Alexander Dennis Limited
Prevost
ABC Companies
MCI (Motor Coach Industries)
Freightliner Custom Chassis Corporation
5.2. Cross Comparison Parameters (Fleet Size, Electrification Progress, Regional Market Share, Production Capacity, Service Network, Number of Employees, Revenue, Founding Year)
5.3. Market Share Analysis
5.4. Strategic Initiatives (Joint Ventures, Collaborations)
5.5. Mergers and Acquisitions
5.6. Investment and R&D Analysis
5.7. Public and Private Partnerships (Transportation Authorities)
6. USA Bus Market Regulatory Framework
6.1. Environmental Regulations (Emission Norms)
6.2. Compliance Requirements (Safety Standards, ADA Compliance)
6.3. Certification and Procurement Processes (Federal Transit Administration)
7. USA Bus Future Market Size (In USD Bn)
7.1. Future Market Size Projections
7.2. Key Factors Driving Future Market Growth (Electrification, Autonomous Technologies)
8. USA Bus Market Future Segmentation
8.1. By Bus Type (In Value %)
8.2. By Application (In Value %)
8.3. By Powertrain (In Value %)
8.4. By Seating Capacity (In Value %)
8.5. By Region (In Value %)
9. USA Bus Market Analysts Recommendations
9.1. TAM/SAM/SOM Analysis
9.2. Consumer Behavior Analysis
9.3. Key Marketing Initiatives
9.4. White Space Opportunity Analysis
Research Methodology
Step 1: Identification of Key Variables
The first step involved identifying the key factors influencing the USA bus market, including government policies, emission regulations, and electrification trends. Extensive desk research was conducted using secondary sources like industry reports, government publications, and proprietary databases to map out the industry landscape.
Step 2: Market Analysis and Construction
In this phase, we analyzed historical data on bus production, sales, and adoption rates. Special attention was given to the trends in electric and hybrid bus adoption, particularly in urban centers. Public transportation fleet data was evaluated to estimate the market's growth potential.
Step 3: Hypothesis Validation and Expert Consultation
We validated market assumptions through interviews with industry experts, including representatives from bus manufacturers, fleet operators, and government agencies. These consultations provided firsthand insights into market dynamics, challenges, and opportunities, allowing us to refine our analysis.
Step 4: Research Synthesis and Final Output
Finally, data was synthesized and cross-verified with industry players. This included direct engagement with bus manufacturers to acquire insights into production capacities, sales performance, and future trends, ensuring the accuracy and comprehensiveness of the report.
Frequently Asked Questions
01. How big is the USA Bus Market?
The USA bus market is valued at USD 8.3 billion. This growth is driven by increased government funding for public transportation, the shift towards electric buses, and infrastructure developments in key cities.
02. What are the key challenges in the USA Bus Market?
Key challenges in the USA bus market include the high initial cost of electric buses, limited charging infrastructure, and regulatory hurdles. Additionally, competition from ride-sharing apps is impacting demand for traditional public transit in some urban areas.
03. Who are the major players in the USA Bus Market?
Major players in the USA bus market include Proterra Inc., Blue Bird Corporation, BYD Motors Inc., New Flyer Industries, and Gillig LLC. These companies dominate due to their technological advancements, focus on electrification, and strong presence in key regions.
04. What are the growth drivers in the USA Bus Market?
The growth of the USA bus market is propelled by government initiatives aimed at reducing emissions, increasing investments in public transportation infrastructure, and the shift towards electric and hybrid buses. Advancements in battery technology are also a key driver.
05. What are the future trends in the USA Bus Market?
Future trends in the USA bus market include the adoption of autonomous buses, integration of smart technologies for route optimization, and a greater focus on sustainability through the use of electric and hydrogen buses. The market is also expected to see an increase in rural and suburban bus routes to meet growing demand.
Why Buy From Us?
 Framework")
What makes us stand out is that our consultants follows Robust, Refine and Result (RRR) methodology. i.e. Robust for clear definitions, approaches and sanity checking, Refine for differentiating respondents facts and opinions and Result for presenting data with story

We have set a benchmark in the industry by offering our clients with syndicated and customized market research reports featuring coverage of entire market as well as meticulous research and analyst insights.

While we don't replace traditional research, we flip the method upside down. Our dual approach of Top Bottom & Bottom Top ensures quality deliverable by not just verifying company fundamentals but also looking at the sector and macroeconomic factors.

With one step in the future, our research team constantly tries to show you the bigger picture. We help with some of the tough questions you may encounter along the way: How is the industry positioned? Best marketing channel? KPI's of competitors? By aligning every element, we help maximize success.

Our report gives you instant access to the answers and sources that other companies might choose to hide. We elaborate each steps of research methodology we have used and showcase you the sample size to earn your trust.

If you need any support, we are here! We pride ourselves on universe strength, data quality, and quick, friendly, and professional service.