
USA Freight and Logistics Market Outlook to 2030
Region:United States
Author(s):Vijay Kumar
Product Code:KROD6775
Region:United States
Author(s):Vijay Kumar
Product Code:KROD6775
November 2024
87
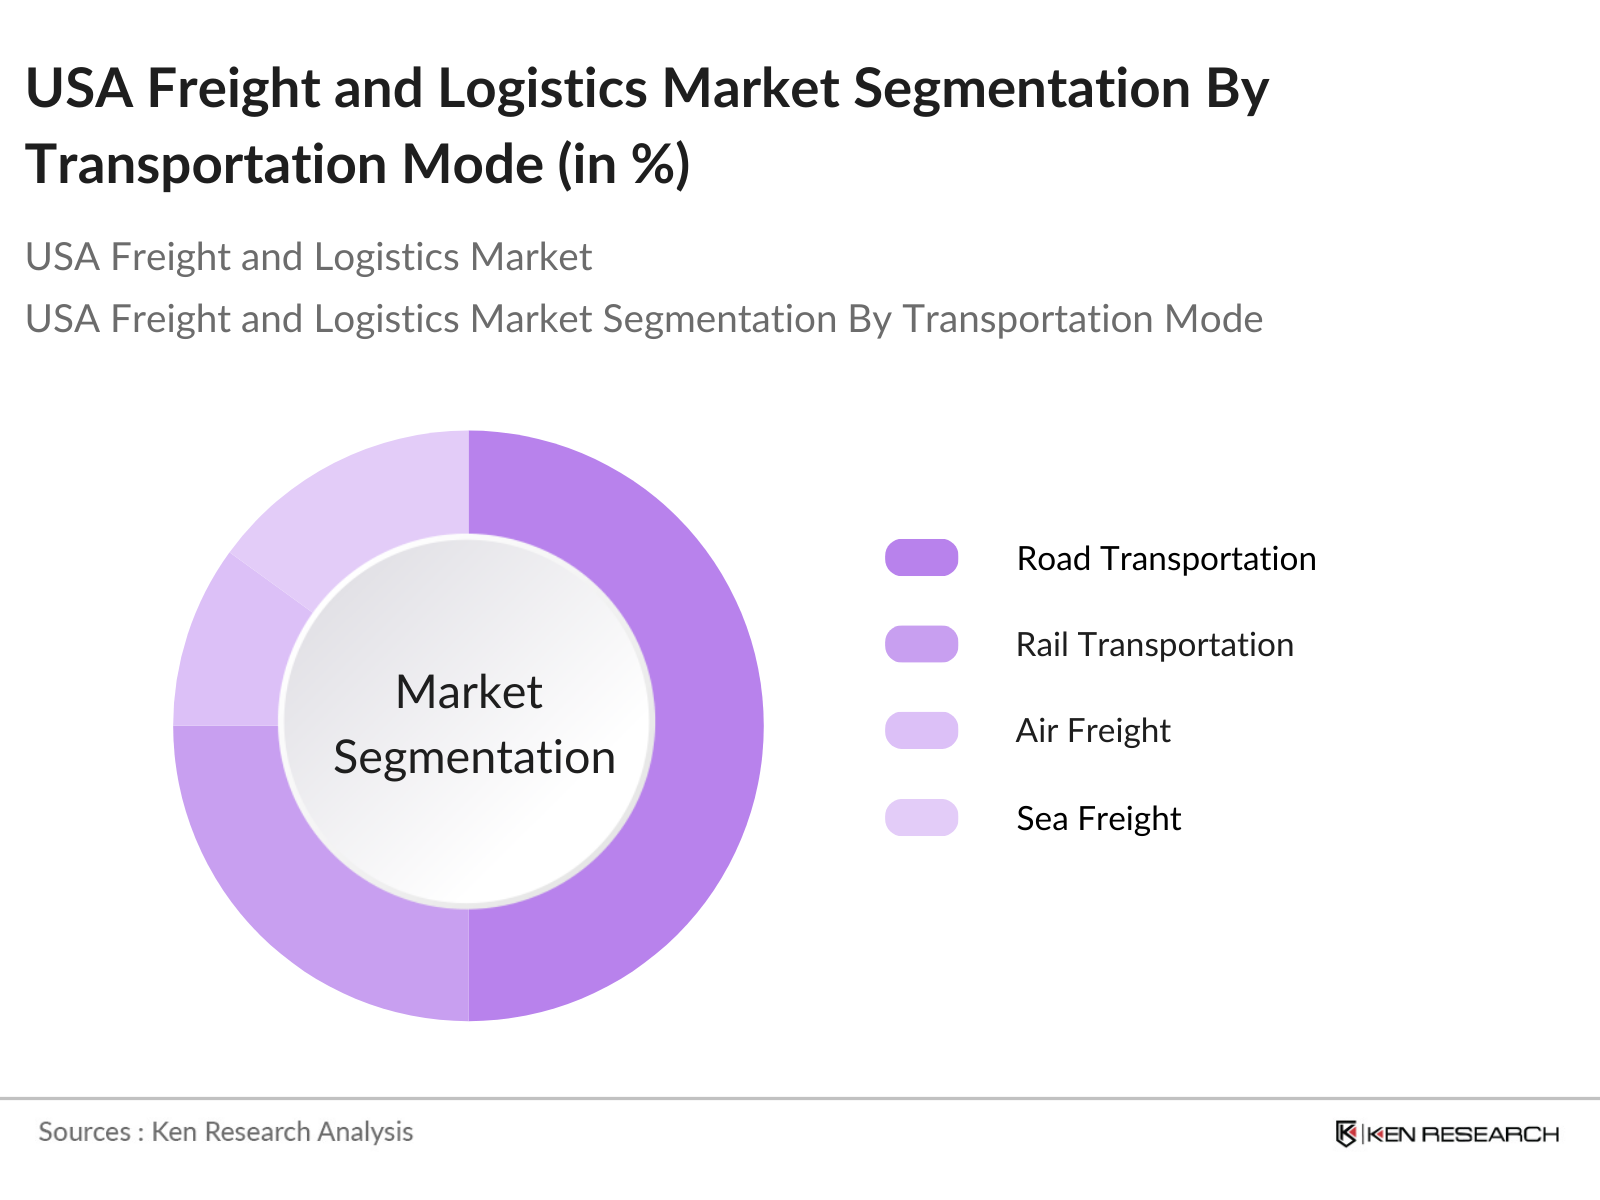
By Transportation Mode: The USA freight and logistics market is segmented by transportation mode into road transportation, rail transportation, air freight, sea freight, and intermodal transportation. Road transportation has the dominant market share owing to the expansive road networks across the USA, the flexibility it offers for last-mile deliveries, and the rising demand from e-commerce businesses.
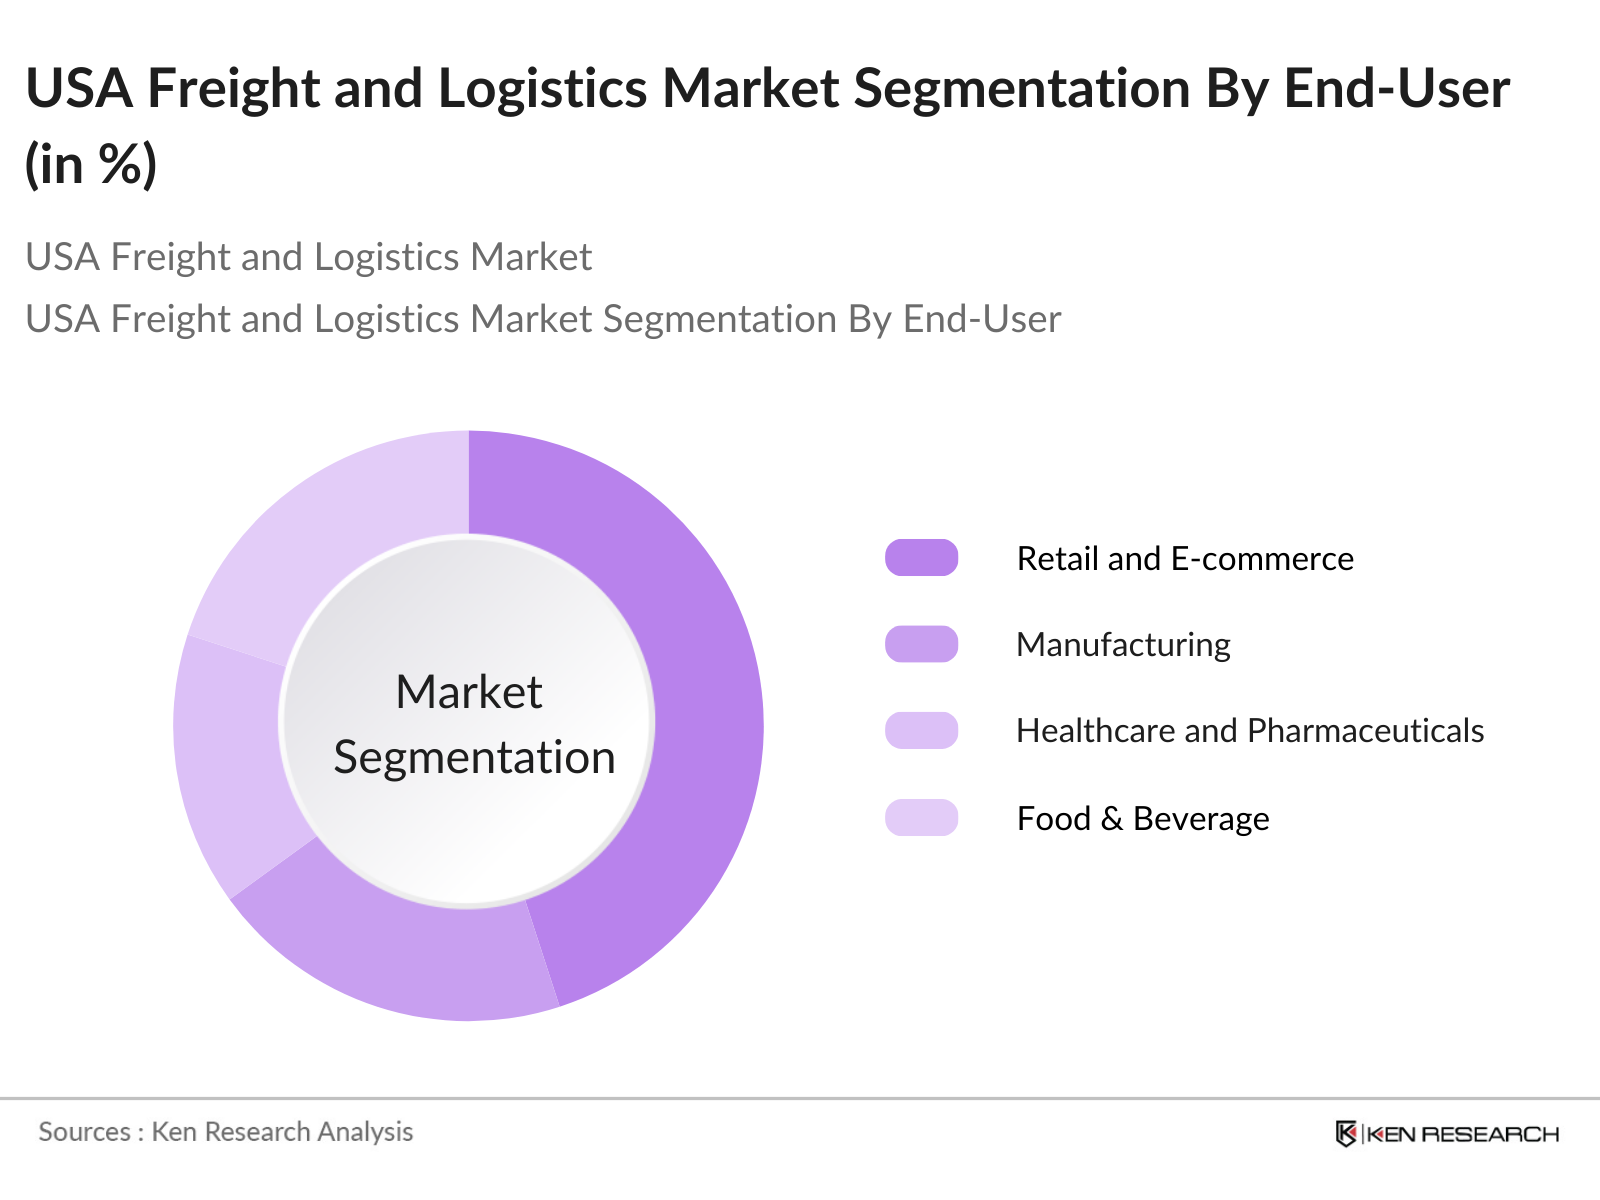
By End-User: The USA freight and logistics market is also segmented by end-users into retail and e-commerce, manufacturing, healthcare and pharmaceuticals, food & beverage, and automotive. Retail and e-commerce dominate the market due to the surging growth in online shopping, which has seen significant expansion post-pandemic.
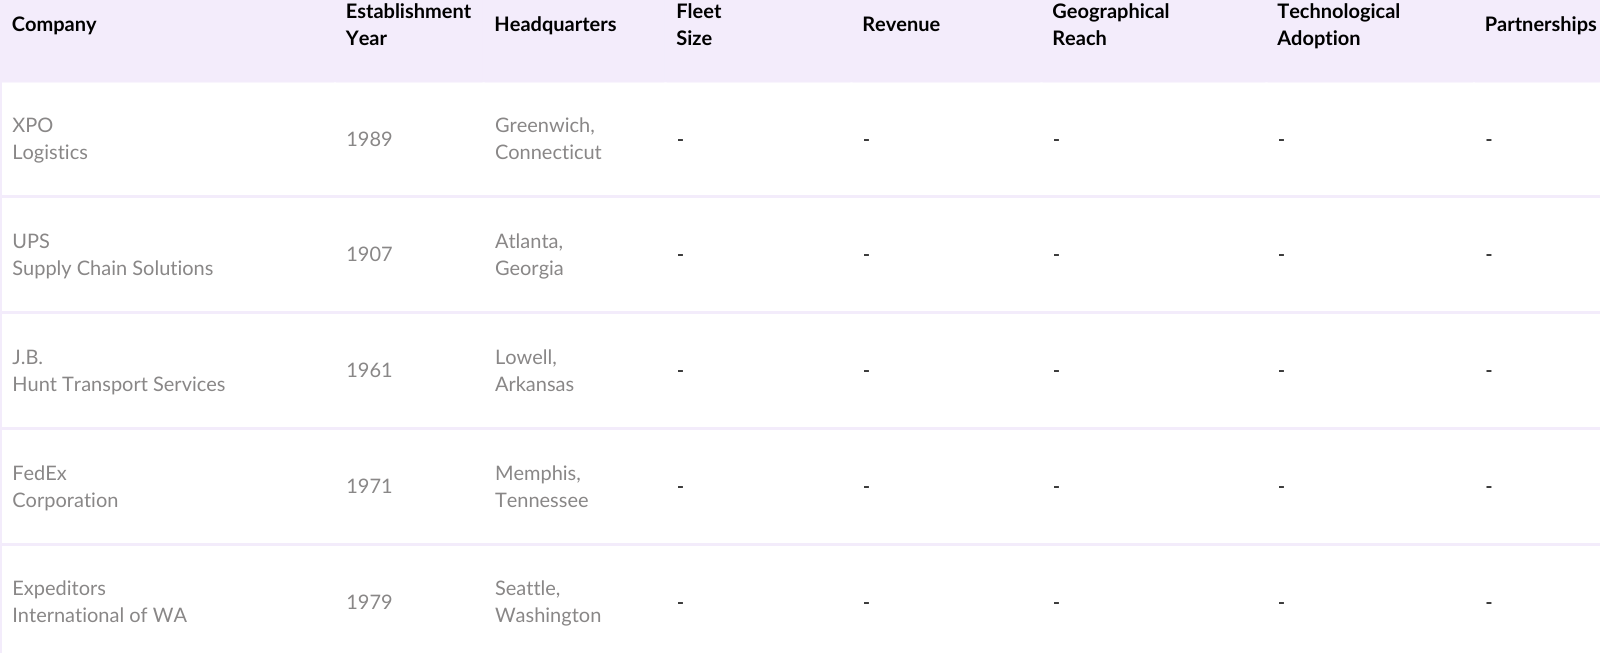
The USA freight and logistics market is characterized by a mix of global giants and regional players, with the top companies holding significant market share. This competitive environment is shaped by factors such as fleet size, geographic coverage, technological innovation, and partnerships with key clients. Companies are increasingly adopting technologies like blockchain, AI, and IoT to enhance supply chain transparency and operational efficiency.
Over the next five years, the USA freight and logistics market is expected to experience steady growth, driven by the expansion of e-commerce, technological innovations, and increasing investment in transportation infrastructure. As the country transitions towards sustainability, logistics companies are likely to adopt green freight solutions to reduce carbon emissions.
|
By Transportation Mode |
Road Transportation Rail Transportation Air Freight Sea Freight Intermodal Transportation |
|
By End-User |
Retail and E-commerce Manufacturing Healthcare and Pharmaceuticals Food & Beverage Automotive |
|
By Logistics Type |
First-Party Logistics (1PL) Second-Party Logistics (2PL) Third-Party Logistics (3PL) Fourth-Party Logistics (4PL) |
|
By Service Type |
Freight Forwarding Warehousing Distribution Inventory Management Last-Mile Delivery |
|
By Region |
East Coast Midwest West Coast Southern States Northern States |
1.1. Definition and Scope
1.2. Market Taxonomy
1.3. Market Growth Rate (Logistics Performance Index, Freight Tonnage, Load Factors)
1.4. Market Segmentation Overview
2.1. Historical Market Size
2.2. Year-On-Year Growth Analysis
2.3. Key Market Developments and Milestones (Freight Tonnage Movement, Route Optimizations)
3.1. Growth Drivers
3.1.1. Expansion of E-Commerce and Retail Trade
3.1.2. Infrastructure Development Projects (Intermodal Transportation, Rail and Road Expansions)
3.1.3. Adoption of Technology and Automation (AI in Supply Chain, Telematics, and IoT Integration)
3.1.4. Increasing Trade Volumes and Imports/Exports
3.2. Market Challenges
3.2.1. Driver Shortage and Labor Challenges
3.2.2. Regulatory Constraints (Federal Regulations, Compliance Costs)
3.2.3. High Fuel and Operational Costs
3.3. Opportunities
3.3.1. Rising Demand for Sustainable Logistics (Green Freight Initiatives, Fuel Efficiency)
3.3.2. Increased Focus on Last-Mile Delivery Optimization
3.3.3. Investments in Cold Chain Logistics
3.4. Trends
3.4.1. Shift towards Multi-Modal Transportation Solutions
3.4.2. Adoption of Blockchain for Transparency in Freight Management
3.4.3. Emergence of Autonomous Vehicles in Freight
3.4.4. Increasing Focus on Freight Security Solutions
3.5. Government Regulations
3.5.1. US DOT Freight Regulations
3.5.2. FMCSA Compliance Guidelines
3.5.3. Environmental Standards for Freight Emissions (Greenhouse Gas Regulations)
3.6. SWOT Analysis
3.7. Stakeholder Ecosystem
3.8. Porters Five Forces Analysis
3.9. Competition Ecosystem
4.1. By Transportation Mode (In Value %)
4.1.1. Road Transportation
4.1.2. Rail Transportation
4.1.3. Air Freight
4.1.4. Sea Freight
4.1.5. Intermodal Transportation
4.2. By End-User (In Value %)
4.2.1. Retail and E-commerce
4.2.2. Manufacturing
4.2.3. Healthcare and Pharmaceuticals
4.2.4. Food & Beverage
4.2.5. Automotive
4.3. By Logistics Type (In Value %)
4.3.1. First-Party Logistics (1PL)
4.3.2. Second-Party Logistics (2PL)
4.3.3. Third-Party Logistics (3PL)
4.3.4. Fourth-Party Logistics (4PL)
4.4. By Service Type (In Value %)
4.4.1. Freight Forwarding
4.4.2. Warehousing
4.4.3. Distribution
4.4.4. Inventory Management
4.4.5. Last-Mile Delivery
4.5. By Region (In Value %)
4.5.1. East Coast
4.5.2. Midwest
4.5.3. West Coast
4.5.4. Southern States
4.5.5. Northern States
5.1. Detailed Profiles of Major Companies
5.1.1. XPO Logistics
5.1.2. UPS Supply Chain Solutions
5.1.3. J.B. Hunt Transport Services
5.1.4. FedEx Corporation
5.1.5. Ryder System, Inc.
5.1.6. Expeditors International of Washington, Inc.
5.1.7. C.H. Robinson Worldwide, Inc.
5.1.8. Schneider National, Inc.
5.1.9. Landstar System, Inc.
5.1.10. Old Dominion Freight Line
5.1.11. Swift Transportation
5.1.12. Werner Enterprises
5.1.13. Kuehne + Nagel Inc.
5.1.14. DHL Supply Chain
5.1.15. Maersk Logistics USA Inc.
5.2. Cross Comparison Parameters (Fleet Size, Service Offerings, Revenue, Geographical Coverage, Operational Efficiency, Delivery Time, Customer Satisfaction, Carbon Footprint)
5.3. Market Share Analysis
5.4. Strategic Initiatives
5.5. Mergers and Acquisitions
5.6. Investment Analysis
5.7. Venture Capital Funding
5.8. Government Grants
5.9. Private Equity Investments
6.1. Environmental Regulations (Emission Standards, Clean Freight Programs)
6.2. Safety and Compliance Standards (Hours of Service, Weight Limitations)
6.3. Certification Processes
7.1. Future Market Size Projections
7.2. Key Factors Driving Future Market Growth
8.1. By Transportation Mode (In Value %)
8.2. By End-User (In Value %)
8.3. By Logistics Type (In Value %)
8.4. By Service Type (In Value %)
8.5. By Region (In Value %)
9.1. TAM/SAM/SOM Analysis
9.2. Supply Chain Optimization Strategies
9.3. Technology Adoption Roadmap
9.4. White Space Opportunity Analysis
The research process begins with the identification of major stakeholders and the creation of an ecosystem map of the USA freight and logistics market. Comprehensive secondary research, including market reports, government databases, and company reports, is conducted to identify key variables affecting market dynamics, such as transportation modes and operational efficiencies.
In this phase, historical market data is compiled and analyzed. Key indicators such as freight tonnage, fleet utilization, and transportation costs are assessed. The market share of each logistics type is calculated to understand the level of market penetration and competitive positioning.
To validate market hypotheses, expert consultations are conducted through interviews with logistics managers, industry analysts, and transportation companies. This process involves gathering firsthand insights into trends, market challenges, and operational strategies.
The final step involves synthesizing the findings from desk research and expert consultations. Data is cross-verified using a bottom-up approach, ensuring the reliability of revenue and market share estimates. The comprehensive analysis is finalized for publication.
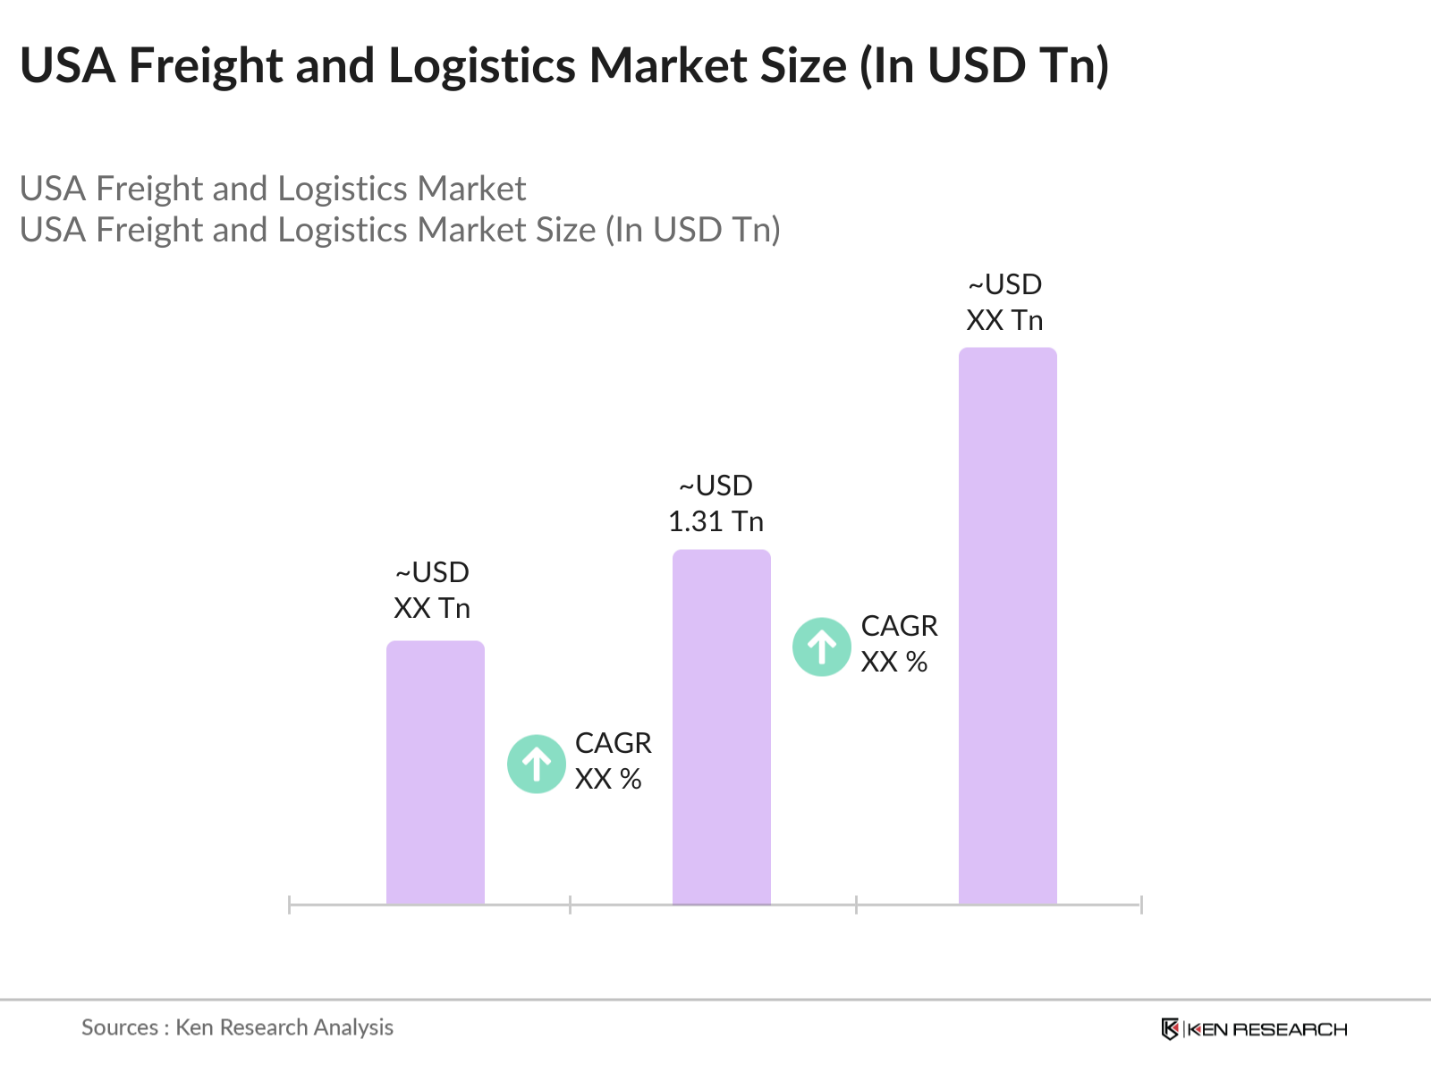
The USA Freight and Logistics market is valued at USD 1.31 trillion, based on a five-year historical analysis. This market is driven by the rapid growth of e-commerce, rising consumer demand for faster deliveries, and advancements in technology such as AI, IoT, and automation.
The major challenges include driver shortages, rising fuel costs, and regulatory hurdles. High operational costs due to fuel price fluctuations and compliance with federal safety regulations also constrain profitability.
The market is dominated by companies like XPO Logistics, UPS, FedEx, J.B. Hunt, and Expeditors International. These companies have extensive geographic reach, large fleets, and advanced technology integration, giving them a competitive edge.
Key growth drivers include the rise of e-commerce, increased investments in infrastructure, and technological advancements such as AI and IoT that enhance logistics efficiency. There is also rising demand for cold chain logistics, especially for pharmaceuticals.

What makes us stand out is that our consultants follows Robust, Refine and Result (RRR) methodology. i.e. Robust for clear definitions, approaches and sanity checking, Refine for differentiating respondents facts and opinions and Result for presenting data with story

We have set a benchmark in the industry by offering our clients with syndicated and customized market research reports featuring coverage of entire market as well as meticulous research and analyst insights.

While we don't replace traditional research, we flip the method upside down. Our dual approach of Top Bottom & Bottom Top ensures quality deliverable by not just verifying company fundamentals but also looking at the sector and macroeconomic factors.

With one step in the future, our research team constantly tries to show you the bigger picture. We help with some of the tough questions you may encounter along the way: How is the industry positioned? Best marketing channel? KPI's of competitors? By aligning every element, we help maximize success.

Our report gives you instant access to the answers and sources that other companies might choose to hide. We elaborate each steps of research methodology we have used and showcase you the sample size to earn your trust.

If you need any support, we are here! We pride ourselves on universe strength, data quality, and quick, friendly, and professional service.