CHAPTER 1 - MARKET SUMMARY
Market Overview
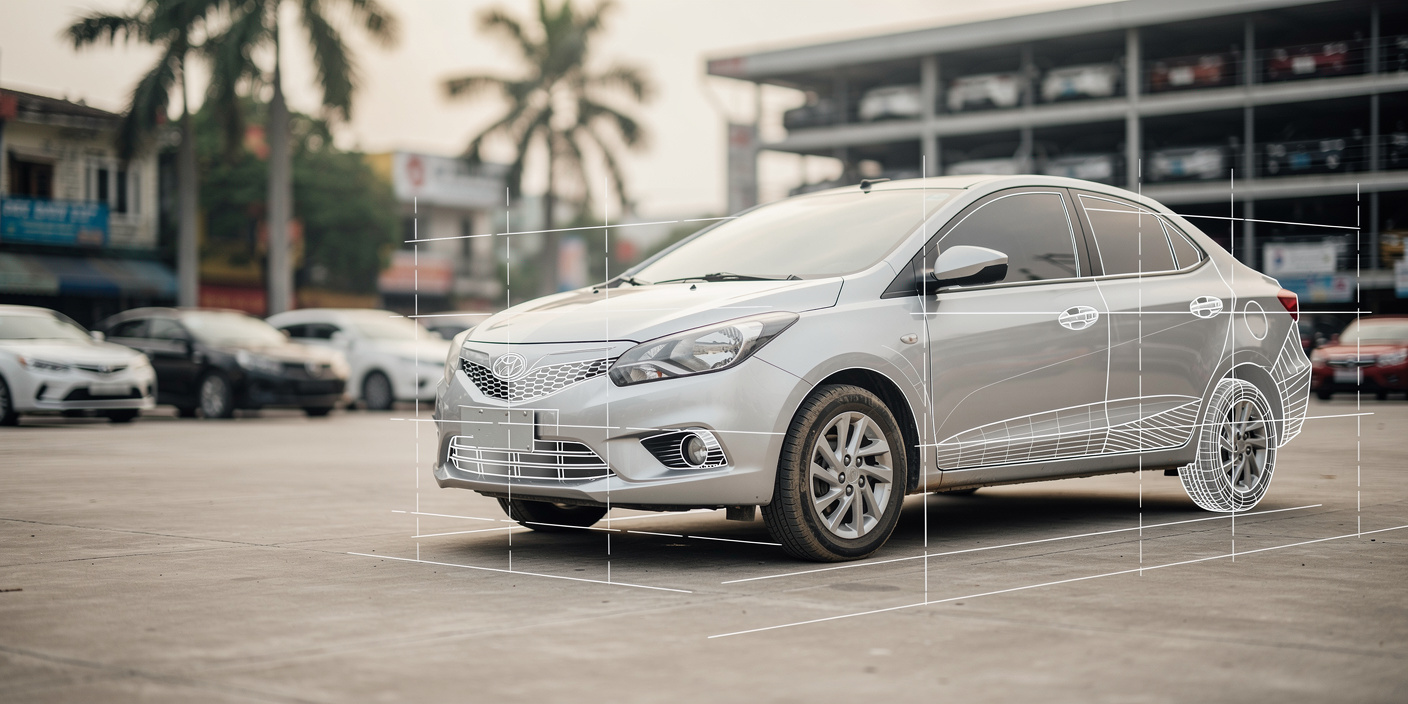
The Vietnam Used Car Market operates through independent dealers, consumer-to-consumer transactions, certified pre-owned programs, and online classifieds. Demand is anchored by affordability and low car penetration: Vietnam had roughly 22 cars per 1,000 people in 2025, while more than 624,000 new cars were registered during 2025. Each new-car purchase expands future trade-in supply, creating a compounding inventory base for resale operators.
Commercial activity is concentrated in the country’s two largest metropolitan economies. A July 2026 marketplace snapshot showed 15,129 used-car listings in Ho Chi Minh City and 4,396 in Hanoi, together representing about 67% of listed inventory on the platform. This concentration improves dealer stock turnover, inspection utilization, financing distribution, and customer acquisition economics, while secondary cities remain underpenetrated and operationally fragmented.
Market Value
USD 11,600 million
2025
Dominant Region
Southern Vietnam
2025
Dominant Segment
SUV and Crossover Vehicles
fastest growing, 2026-2031
Total Number of Players
1,500
Future Outlook
The Vietnam Used Car Market is projected to rise from USD 11,600 million in 2025 to USD 25,140 million by 2031. Historical expansion averaged 11.21% during 2020-2025, supported by rising incomes, increasing new-car registrations, and a broader stock of vehicles entering second and third ownership cycles. The near-term outlook remains favorable because used cars retain a meaningful affordability advantage over new vehicles, especially for first-time buyers and small businesses. Organized retailers can capture disproportionate value by combining inspection, warranty, financing, insurance, and digital lead generation into a single transaction journey.
From 2026 to 2031, market value is forecast to grow at a 13.75% CAGR, with transaction volume reaching approximately 1.74 million units in 2031. Average transaction value is expected to increase as SUVs, crossovers, younger vehicles, and electrified models gain share, while transparent vehicle histories improve confidence in higher-ticket purchases. The primary strategic shift is from fragmented intermediation toward managed retail and certified inventory. Investors should prioritize scalable sourcing, standardized refurbishment, lender integration, and data-led residual-value management because these capabilities directly influence stock turns, gross margin, credit approval rates, and lifetime customer monetization.
13.75%
Forecast CAGR
$25,140 Mn
2030 Projection
Base Year
2025
Historical Period
2020-2025
Forecast Period
2026-2031
Historical CAGR
11.21%
CHAPTER 2 - SCOPE OF REPORT
Scope of the Market
CHAPTER 3 - Key Stakeholders
Key Target Audience
Key stakeholders who can leverage from this market analysis for investment, strategy, and operational planning.
Investors
CAGR, stock turns, gross margin, capital intensity, exit pathways
Corporates
sourcing scale, conversion, warranties, financing, customer lifetime value
Government
ownership transfer, emissions compliance, roadworthiness, consumer protection, formalization
Operators
appraisal accuracy, refurbishment, inventory aging, lead conversion, aftersales
Financial institutions
residual values, loan-to-value, defaults, collateral recovery, commissions
CHAPTER 4 - Market Size & Growth
Market Size, Growth Forecast and Trends
This section evaluates the historical market size, analyzes year-over-year growth dynamics, and presents forecast projections supported by market performance indicators and demand-side drivers.
Historical & Projected Market Size ($ Million)
Year-over-Year Growth Rate (%)
Market Value vs Volume Growth (%)
Historical Market Performance (2020-2025)
Historical growth accelerated after the 2021 trough, when market value expanded only 6.7% as mobility restrictions and weaker discretionary spending disrupted transactions. The market inflected in 2022 with 12.4% growth, supported by normalized dealership operations and wider online discovery. The strongest historical expansion occurred in 2025 at 13.8%, while estimated transaction volume reached 980,000 units. Demand remained concentrated in entry and mass-market vehicles, with the below-USD 20,000 tier representing an estimated 47% of transaction volume, reinforcing the importance of affordable inventory and financing approval.
Forecast Market Outlook (2026-2031)
The market is forecast to compound at 13.75% from 2026 to 2031, rising from USD 13,200 million to USD 25,140 million. Transaction volume is projected to reach 1.74 million units by 2031, while the average transaction value increases to approximately USD 14,448 as younger SUVs, crossovers, and electrified vehicles enter the resale pool. Organized and managed channels are expected to reach about 42% of transactions, improving monetization through warranties, inspections, finance commissions, insurance referrals, and refurbishment services. Growth therefore shifts from simple brokerage toward vertically integrated retail economics.
CHAPTER 5 - Market Data
Market Breakdown
The Vietnam Used Car Market is moving from fragmented brokerage toward a larger, digitally discoverable, and increasingly managed transaction ecosystem. For CEOs and investors, the core value drivers are transaction volume, average selling price, and the share captured by organized channels that can monetize financing, warranties, insurance, and aftersales.
Year | Market Size (USD Mn) | YoY Growth (%) | Used-car Transactions (000 Units) | Average Transaction Price (USD) | Organized Channel Share (%) | Period |
|---|---|---|---|---|---|---|
| 2020 | $6,820 Mn | +- | 620 | 11,000 | Forecast | |
| 2021 | $7,280 Mn | +6.7% | 650 | 11,200 | Forecast | |
| 2022 | $8,180 Mn | +12.4% | 715 | 11,441 | Forecast | |
| 2023 | $9,150 Mn | +11.9% | 790 | 11,582 | Forecast | |
| 2024 | $10,190 Mn | +11.4% | 870 | 11,713 | Forecast | |
| 2025 | $11,600 Mn | +13.8% | 980 | 11,837 | Forecast | |
| 2026 | $13,200 Mn | +13.8% | 1,090 | 12,110 | Forecast | |
| 2027 | $15,020 Mn | +13.8% | 1,210 | 12,413 | Forecast | |
| 2028 | $17,090 Mn | +13.8% | 1,340 | 12,754 | Forecast | |
| 2029 | $19,440 Mn | +13.8% | 1,480 | 13,135 | Forecast | |
| 2030 | $22,120 Mn | +13.8% | 1,630 | 13,571 | Forecast | |
| 2031 | $25,140 Mn | +13.7% | 1,740 | 14,448 | Forecast |
Used-car Transactions
980,000 units, 2025, Vietnam. Volume scale supports multi-site sourcing and centralized refurbishment. More than 624,000 new cars were registered in 2025, enlarging the future trade-in pool.
Average Transaction Price
USD 11,837, 2025, Vietnam. Higher pricing expands absolute gross profit but raises financing sensitivity. Ch? T?t Xe displayed average asking prices near USD 8,000-28,000 for popular mass-market models in July 2026.
Organized Channel Share
30%, 2025, Vietnam. Formalization enables warranties and lender partnerships, increasing revenue per vehicle. Ch? T?t Xe reported more than 16 million monthly visits and 120,000 monthly vehicle listings, demonstrating scalable digital lead generation.
CHAPTER 6 - Segmentation
Market Segmentation Framework
Comprehensive analysis across key dimensions providing insights into market structure, consumer preferences, and distribution patterns.
No of Segments
7
Dominant Segment
Vehicle Type
Fastest Growing Segment
Powertrain
Vehicle Type
Customer Type
Sales Channel
Powertrain
Usage Type
Price Tier
Geography
Key Segmentation Takeaways
Comprehensive analysis across all extracted segmentation dimensions providing insights into market structure, consumer preferences, and distribution patterns.
Vehicle Type
Vehicle configuration remains the strongest determinant of resale value, sourcing liquidity, and buyer conversion. Sedans retain the largest installed base and transaction pool, while SUVs and crossovers generate faster inventory turns and stronger pricing resilience. Dealers need model-level residual-value curves because body style, age, mileage, and powertrain jointly determine refurbishment spend and margin risk.
Powertrain
Powertrain is the fastest-changing dimension as battery-electric and hybrid vehicles begin entering secondary ownership. Battery health, charging access, software support, and residual-value uncertainty create new inspection and warranty requirements. Gasoline vehicles remain dominant, but electrified models are likely to deliver the strongest growth as Vietnam’s new-car market shifts toward electric mobility and fleet operators rotate early EV cohorts.
CHAPTER 7 - Regional Analysis
Regional Analysis
Vietnam ranks third by 2025 used-car market value among the selected Southeast Asian peer countries, behind Indonesia and Malaysia but ahead of the Philippines and Thailand. Its strategic differentiation is growth: low car ownership, strong new-car registrations, and rapid digitalization support a forecast rate materially above mature regional markets.
Focus Country Ranking
3rd
Focus Country Market Size
USD 11.60 Bn (2025)
Focus Country CAGR
13.75% (2026-2031)
Focus Country Ranking
3rd
Focus Country Market Size
USD 11.60 Bn (2025)
Focus Country CAGR
13.75% (2026-2031)
Regional Analysis (Current Year)
Market Position
Vietnam’s USD 11.60 billion market ranks third in the peer set, supported by a 2025 new-car market of approximately 604,000 units that continually replenishes future used inventory.
Growth Advantage
Vietnam’s 13.75% CAGR materially exceeds Thailand’s 7.13% and Malaysia’s 6.36%, positioning the country as the peer group’s growth leader rather than its largest current profit pool.
Competitive Strengths
Vietnam combines only 22 cars per 1,000 people, more than 624,000 new registrations in 2025, and 84% internet penetration, enabling long-run motorization and lower-cost digital customer acquisition.
CHAPTER 8 - INDUSTRY ANALYSIS
Growth Drivers, Challenges & Opportunities
Comprehensive analysis of key factors shaping the Vietnam Used Car Market, including growth catalysts, operational challenges, and emerging opportunities across sourcing, distribution, financing, and consumer segments.
Growth Drivers
Expanding Car Parc and Trade-in Supply
- Passenger cars represented 3.74 million vehicles (October 2023, Vietnam), creating a deep pool that progressively enters replacement and second-owner cycles, benefiting dealer sourcing networks and inspection providers.
- More than 624,000 new cars were registered (2025, Vietnam), increasing the future availability of three-to-five-year-old trade-ins, the age band generally preferred by organized retailers and lenders.
- New automobile sales exceeded 604,000 units (2025, Vietnam), supporting OEM-certified used programs and enabling dealers to convert showroom trade-ins into higher-margin pre-owned inventory.
Income Growth and Low Motorization
- Vietnam’s population reached 101.6 million people (2025, World Bank), giving dealers and lenders a large addressable customer base as households transition from motorcycles to passenger cars.
- Car ownership was approximately 22 vehicles per 1,000 people (2025, Vietnam), far below peer-market levels, leaving substantial headroom for entry-level used vehicles that lower the cost of motorization.
- Real GDP expanded by 7.1% (2024, Vietnam), supporting household income, business formation, and mobility spending, while used cars capture buyers unable or unwilling to absorb new-car depreciation.
Digital Discovery and Transaction Formalization
- The platform reported 120,000 vehicle listings per month (2026, Vietnam), enabling price comparison and wider geographic reach, which improves lead flow for dealers and increases buyer bargaining transparency.
- Used cars represented more than 90% of automobile listings (July 2026, Ch? T?t Xe), confirming that digital classifieds are primarily serving secondary-market liquidity rather than only new-car promotion.
- Internet usage reached 84% of the population (2024, World Bank), expanding the addressable audience for digital inspection booking, finance pre-approval, vehicle-history reports, and managed transactions.
Market Challenges
Opaque Vehicle Condition and Fragmented Records
- Independent and consumer-to-consumer channels lack standardized disclosures for accident history, odometer integrity, and maintenance, increasing warranty losses and forcing buyers to price in a risk discount of roughly 5-10% (2025, industry estimate).
- Inspection requirements shorten to 6 months for private passenger cars older than 20 years (2025, Vietnam), making older inventory costly to hold and harder to finance.
- Without interoperable records, organized retailers must spend an estimated USD 150-500 per vehicle (2025, Vietnam) on inspection and verification, directly affecting gross margin and stock acquisition bids.
Price Competition from New and Electric Vehicles
- VinFast delivered approximately 97,000 vehicles (2024, global), nearly all in Vietnam, accelerating EV availability and compressing resale expectations for older internal-combustion vehicles.
- Battery-electric vehicles benefited from a 0% first-registration fee through February 2027 (Vietnam), reducing the effective new-car price gap and forcing used dealers to reprice competing gasoline vehicles.
- The under-USD 20,000 segment accounts for an estimated 47% of used transactions (2025, Vietnam), so even modest new-car discounts can shift price-sensitive buyers and extend dealer inventory days.
Financing Friction and Residual-value Risk
- Used vehicles have heterogeneous age and condition, leading lenders to apply shorter tenors and higher down payments, often 20-30% of purchase value (2025, Vietnam), which reduces conversion among first-time buyers.
- Average transaction value is estimated at USD 11,837 (2025, Vietnam), equivalent to more than twice annual GDP per capita, making monthly payment affordability a decisive transaction constraint.
- Electrified vehicles introduce battery-health uncertainty, and a 10 percentage-point residual-value error (2026, modeled) can eliminate dealer gross profit on inventory-led transactions, requiring stronger appraisal data and warranties.
Market Opportunities
Certified Pre-Owned Retail at Scale
- inspection, refurbishment, warranty, finance, and insurance can add an estimated USD 700-1,500 revenue per vehicle (2025, Vietnam) beyond the trading margin.
- dealer groups, OEM networks, lenders, and insurers can share a projected 1.74 million annual transactions (2031, Vietnam) through embedded service bundles and repeat ownership cycles.
- standardized multi-point inspection and buyback guarantees should reduce buyer risk premiums by an estimated 3-5 percentage points (2026-2031, modeled), improving conversion and pricing power.
Digital Finance and Transaction Infrastructure
- platforms can earn lender referral fees, insurance commissions, inspection charges, and listing revenue, lifting revenue per completed sale by 2-4% of vehicle value (2026, modeled).
- digital marketplaces and banks gain access to 120,000 monthly vehicle listings (2026, Ch? T?t Xe), creating a large funnel for credit scoring and lead monetization.
- lenders need model-level residual-value databases and API-based underwriting capable of reducing approval turnaround from days to under 30 minutes (2026-2031, target).
Used Electric Vehicle Ecosystem
- battery diagnostics, certified state-of-health reports, extended warranties, and charging bundles can support a 10-15% service premium (2027-2031, modeled) over unmanaged EV sales.
- OEMs, battery service firms, dealers, and fleet operators can remarket early EV cohorts while capturing value from approximately 150,000 charging points (2025, Vietnam).
- industry-wide battery health standards and lender valuation curves are required before used EVs can achieve financing penetration comparable with gasoline vehicles, targeted at 50% by 2031 (modeled).
CHAPTER 9 - Competitive Landscape
Competitive Landscape Overview
The market remains fragmented, with independent dealers and direct owner transactions dominating. Competitive advantage increasingly depends on inventory sourcing, inspection credibility, stock-turn discipline, digital traffic, financing partnerships, and the ability to provide warranties without eroding gross margin.
Market Share Distribution
Top 5 Players
Market Dynamics
8 new entrants in the past 5 years, indicating strong market attractiveness and growth potential.
Company Name | Market Share | Headquarters | Founding Year | Core Market Focus |
|---|---|---|---|---|
Ch? T?t Xe | - | Ho Chi Minh City, Vietnam | 2017 | Online vehicle classifieds, dealer leads, private listings |
| - | Hanoi, Vietnam | - | Used-car listings and dealer marketplace | |
| - | Hanoi, Vietnam | - | Automotive classifieds, valuation content, dealer leads | |
Carmudi Vietnam | - | Ho Chi Minh City, Vietnam | 2014 | Digital automotive marketplace and dealer advertising |
CARPLA | - | Hanoi, Vietnam | 2024 | Inventory-led used-car retail, inspection, insurance, services |
Anycar Vietnam | - | Hanoi, Vietnam | - | Multi-brand used-car buying, retail, and exchange |
Toyota Sure Vietnam | - | Hanoi, Vietnam | - | OEM-certified Toyota used vehicles and trade-ins |
Ford Assured Vietnam | - | Hai Duong, Vietnam | - | OEM-certified Ford used vehicles and warranties |
Haxaco Used Cars | - | Ho Chi Minh City, Vietnam | 2000 | Premium trade-ins and pre-owned Mercedes-Benz vehicles |
Mercedes-Benz Certified Pre-Owned Vietnam | - | Ho Chi Minh City, Vietnam | - | Certified premium used vehicles and dealer-backed warranties |
Cross Comparison Parameters
The report provides detailed cross-comparison of key players across 10 performance parameters to identify competitive strengths and weaknesses.
Analysis Covered
Market Share Analysis:
Estimates transaction concentration across organized platforms, dealers, and certified networks.
Cross Comparison Matrix:
Benchmarks sourcing, conversion, inventory turns, margins, and ancillary monetization performance.
SWOT Analysis:
Evaluates brand trust, capital intensity, technology capability, and sourcing vulnerabilities.
Pricing Strategy Analysis:
Compares appraisal discipline, refurbishment recovery, warranty pricing, and markdown cadence.
Company Profiles:
Reviews positioning, footprint, channel model, customer proposition, and operating capabilities.
CHAPTER 10 - REPORT TOC
Market Report Structure
Comprehensive coverage across three strategic phases — Market Assessment, Go-To-Market Strategy, and Survey — delivering end-to-end insights from market analysis and execution roadmap to customer demand validation.
Phase 1Market Assessment Phase
11
Chapters
Supply-side and competitive intelligence covering market sizing, segmentation, competitive dynamics, regulatory landscape, and future forecasts.
Phase 2Go-To-Market Strategy Phase
15
Chapters
Entry strategy evaluation, execution roadmap, partner recommendations, and profitability outlook.
Complete Report Coverage
201+ detailed sections covering every aspect of the market
143
Assessment Sections
58
Strategy Sections
CHAPTER 11 - Our Approach
Research Methodology
Desk Research
- Reviewed vehicle registration and inspection statistics
- Mapped used-car listings and asking prices
- Analyzed dealer networks and certified programs
- Tracked transfer fees and emissions policies
Primary Research
- Interviewed used-car dealership general managers
- Consulted automotive credit risk heads
- Engaged vehicle inspection operations managers
- Surveyed marketplace category and pricing leads
Validation and Triangulation
- Validated assumptions across 324 respondents
- Reconciled listings with dealer sell-through
- Cross-checked prices against financed values
- Tested transaction ratios against vehicle parc
CHAPTER 12 - FAQ
FAQs
Still have questions?
Our research team is here to help you find the right solution
CHAPTER 13 - Related Research
Explore Related Reports
Expand your market intelligence with complementary research across regions and adjacent markets.
Regional/Country ReportsRelated market analysis across key regions
Related market analysis across key regions
- USA Used Car Market Size, Share & Forecast, By Vehicle Type, Sales Channel & Price Tier, 2026-2032
- Philippines Used Car Market Size, Share & Forecast, By Vehicle Type, Sales Channel & Price Tier, 2026-2032
- New Zealand Used Car Market Size, Share & Forecast, By Vehicle Type, Sales Channel & Powertrain, 2026-2031
- Singapore Used Car Market Size, Share & Forecast, By Vehicle Type, Sales Channel & Powertrain, 2026-2031
- Russia Used Car Market
Adjacent ReportsRelated markets and complementary research
Related markets and complementary research
- Belgium Pre-Owned Motorcycle Market
- Egypt Vehicle Financing Services Market
- Japan Automotive Inspection Technology Market
- Oman Certificate of Origin Compliance Market
- South Korea SUV and Crossover Vehicle Market
500+
Market Research Reports
50+
Countries Covered
15+
Industry Verticals