
APAC Solvents Market Outlook to 2030
Region:Afganistan
Author(s):Shubham Kashyap
Product Code:KROD5418
Region:Afganistan
Author(s):Shubham Kashyap
Product Code:KROD5418
December 2024
83
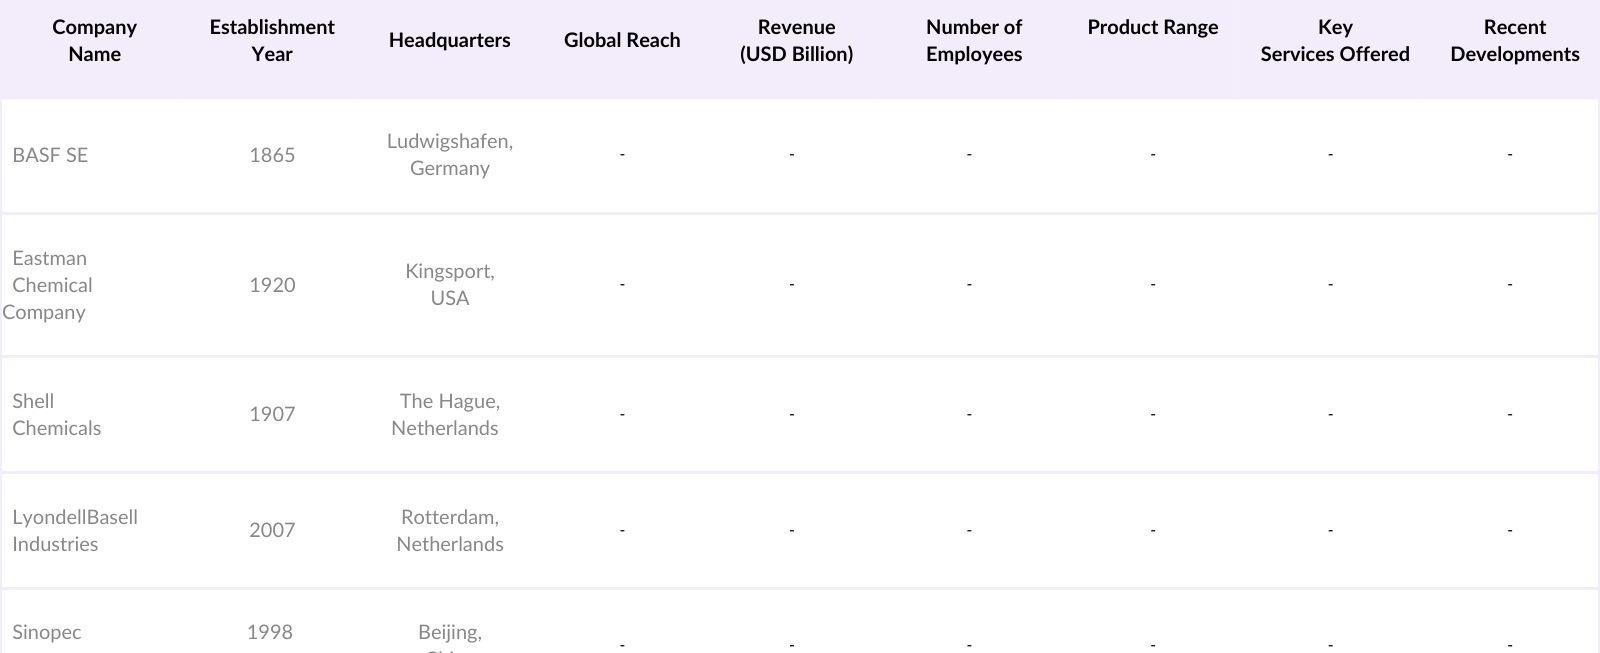
The APAC solvents market is highly competitive, with key players leveraging strong distribution networks, advanced production capabilities, and continuous innovation to maintain their market positions. Major companies include BASF SE, Eastman Chemical Company, Shell Chemicals, LyondellBasell Industries, and Sinopec. These leaders focus on developing ecofriendly and highperformance solvent solutions to address stringent regulatory requirements and meet evolving customer demands.
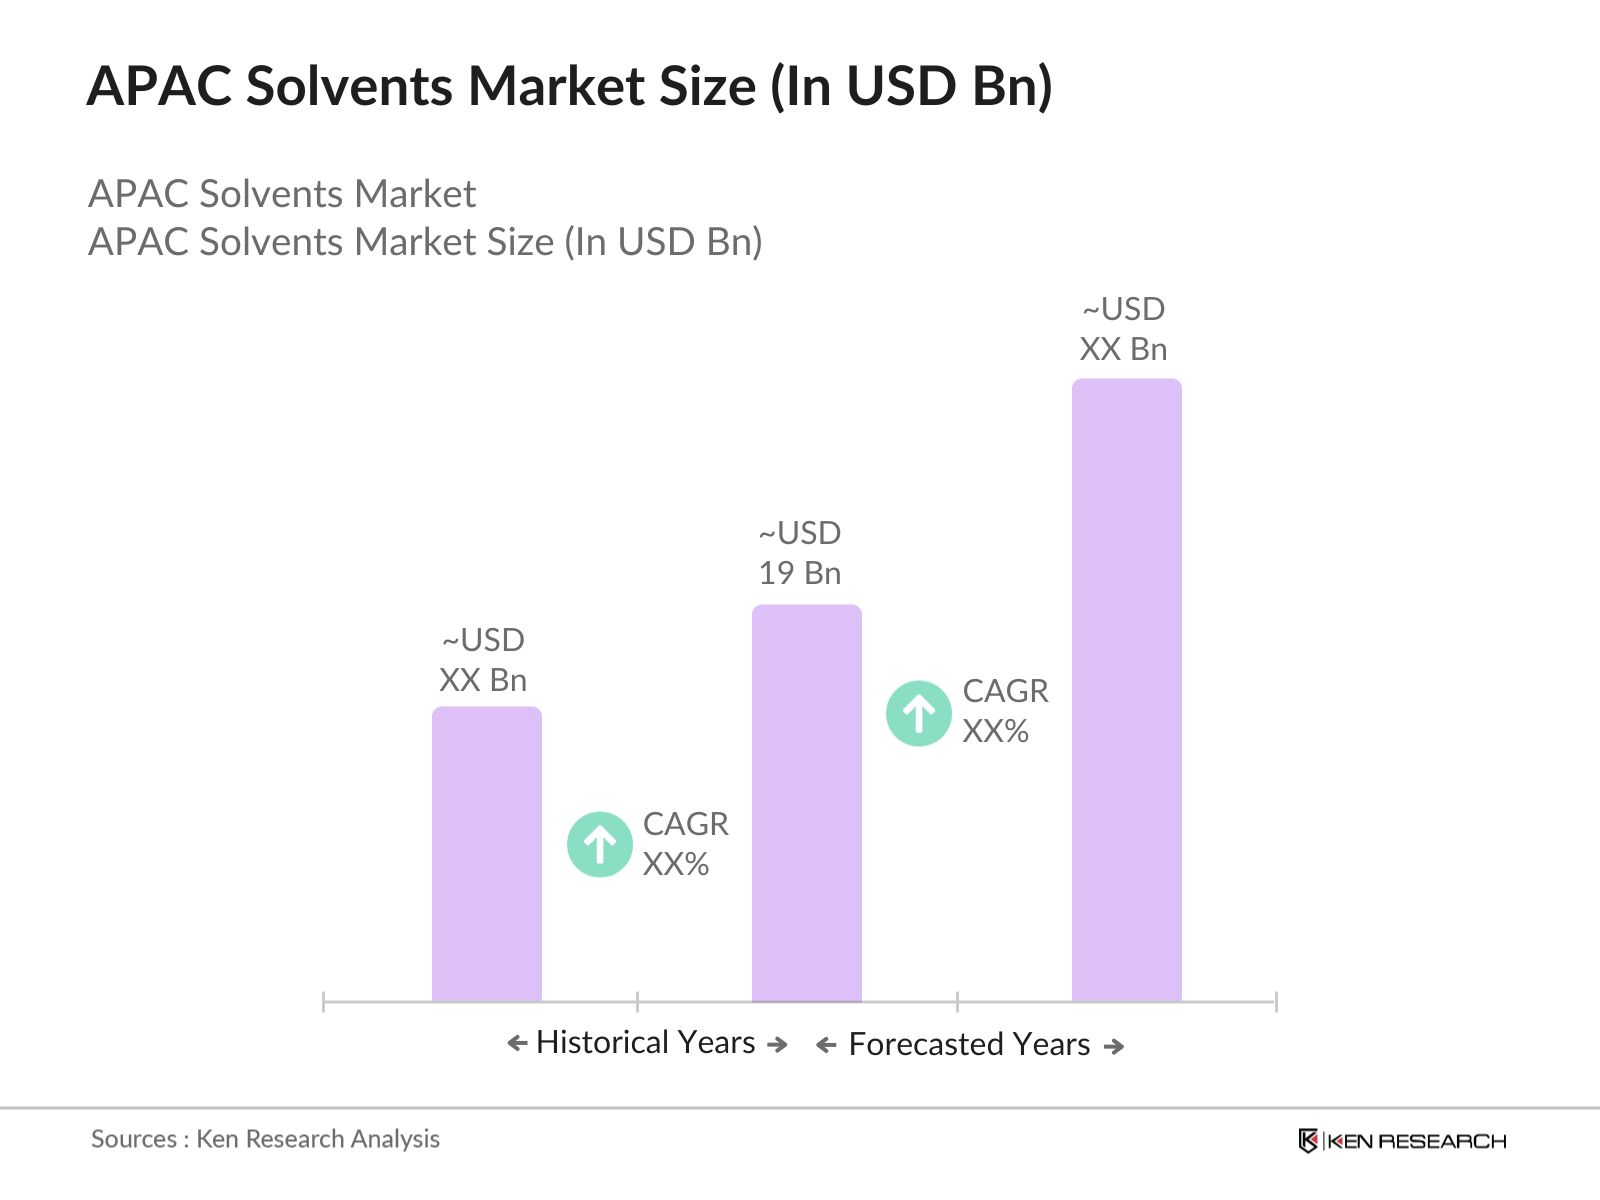
The APAC solvents market is poised for substantial growth, driven by continuous industrial expansion, advancements in solvent production technologies, and the adoption of sustainable practices. With increasing investments in infrastructure, manufacturing, and personal care, the market is expected to thrive. Moreover, the shift toward biobased and lowVOC solvents will gain momentum as environmental concerns shape purchasing decisions and regulatory compliance.
|
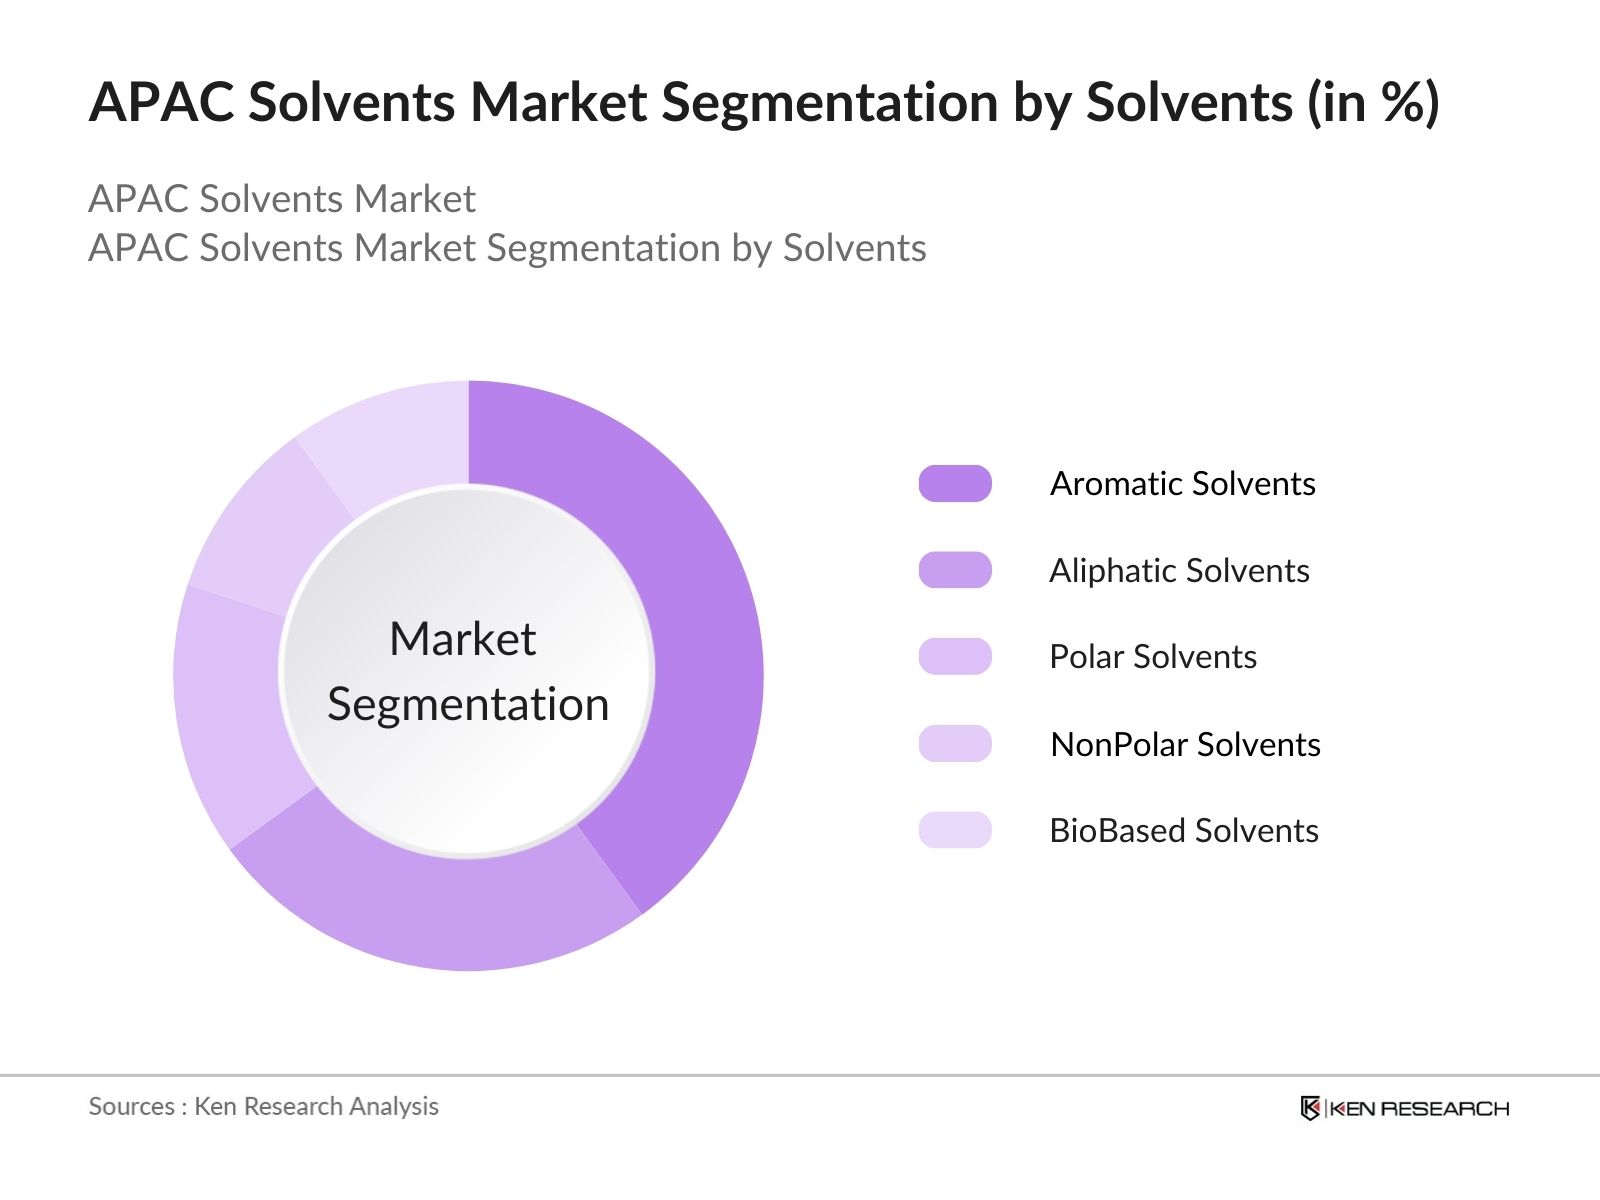
By Solvent Type |
Aromatic Solvents Aliphatic Solvents Polar Solvents NonPolar Solvents Specialty Solvents |
|
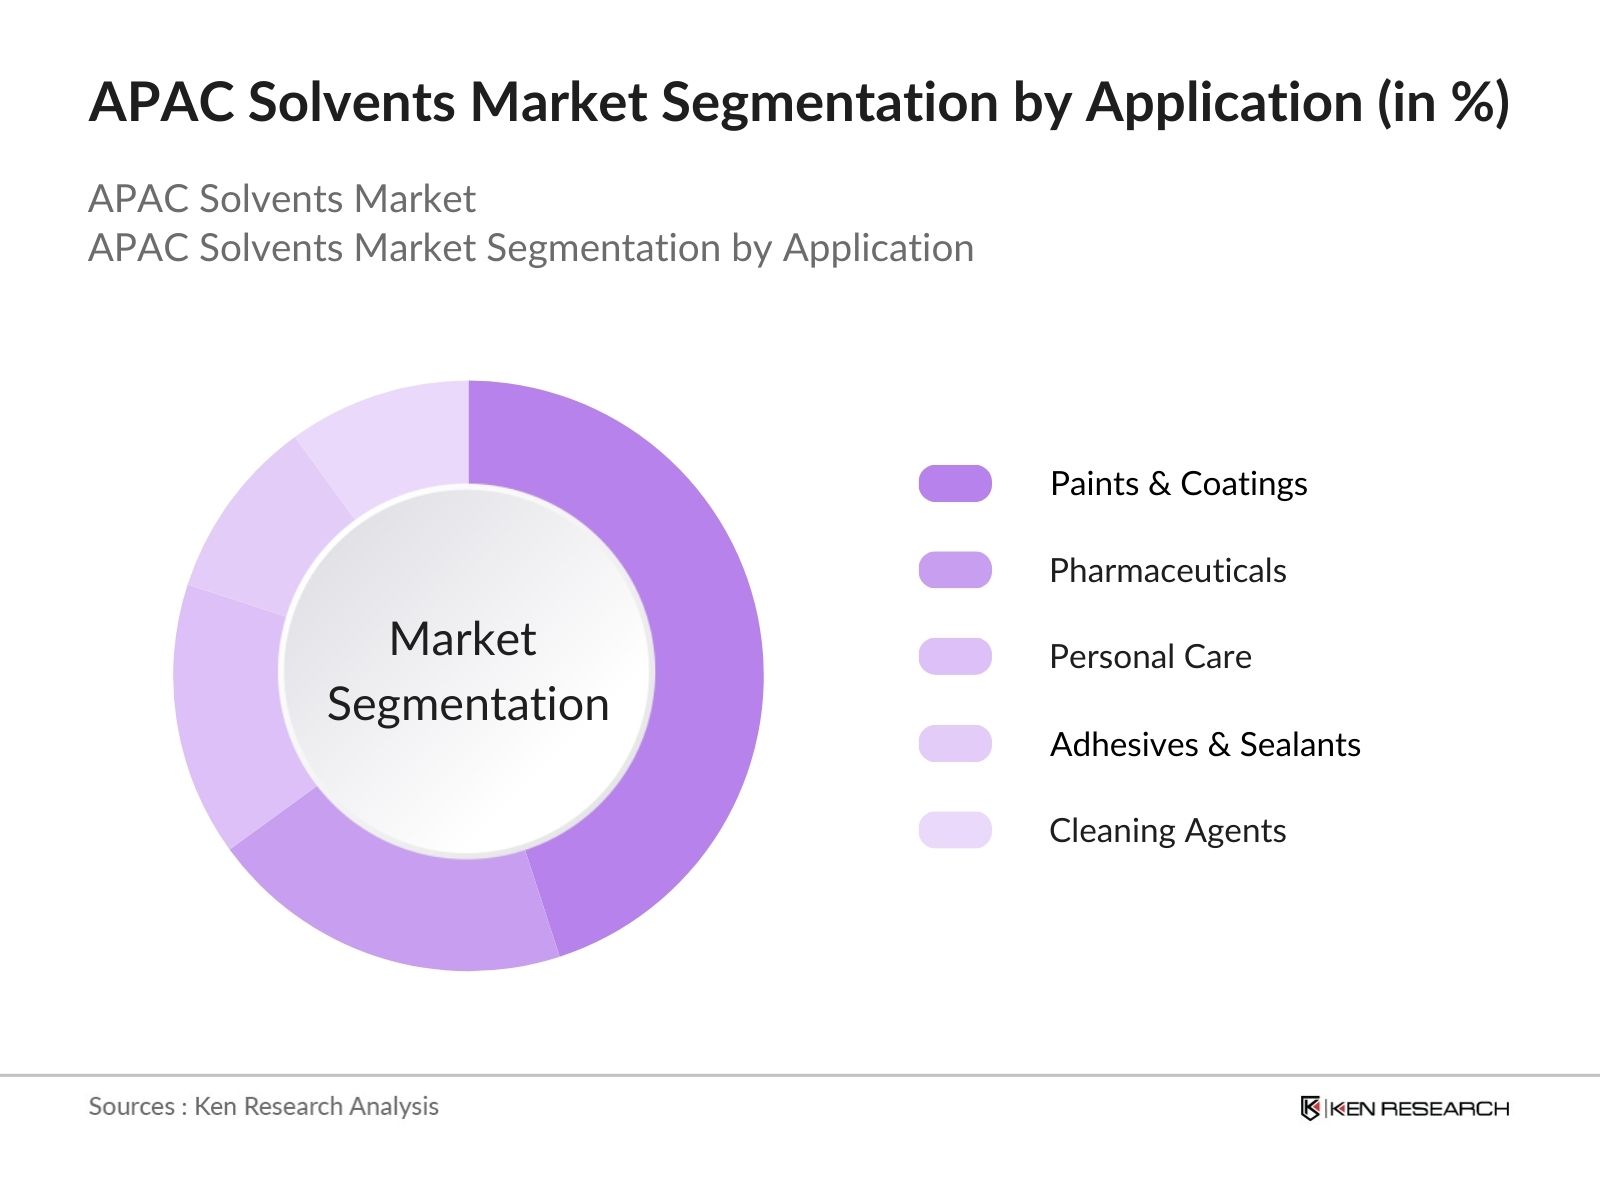
By Application |
Paints & Coatings Pharmaceuticals Personal Care Adhesives & Sealants Cleaning Agents |
|
By End-user |
Automotive Construction Electronics Textile Others |
|
By Region |
China India Japan South Korea Southeast Asia |
|
By Distribution Channel |
Direct Sales Distributors Online Retail Others OEM Partnerships |
1.1. Definition and Scope
1.2. Market Taxonomy
1.3. Market Growth Rate
1.4. Market Segmentation Overview
2.1. Historical Market Size
2.2. Year-On-Year Growth Analysis
2.3. Key Market Developments and Milestones
3.1. Growth Drivers
3.1.1. Industrial Expansion (Industrial Output Growth)
3.1.2. Technological Innovations (R&D Expenditure)
3.1.3. Increasing Demand from End-Use Industries (Sectoral Demand Growth)
3.1.4. Regulatory Support (Policy Initiatives)
3.2. Market Challenges
3.2.1. Volatility in Raw Material Prices (Price Index Fluctuations)
3.2.2. Environmental Concerns (Emission Standards Compliance)
3.2.3. Stringent Regulatory Frameworks (Compliance Costs)
3.3. Opportunities
3.3.1. Emerging Markets in APAC (Market Penetration Rates)
3.3.2. Growth in Specialty Solvents (Niche Market Expansion)
3.3.3. Sustainable Solvent Development (Green Chemistry Initiatives)
3.4. Trends
3.4.1. Shift Towards Bio-based Solvents (Sustainability Trends)
3.4.2. Adoption of Advanced Manufacturing Techniques (Automation and AI)
3.4.3. Increasing Mergers and Acquisitions (Consolidation Trends)
3.5. Government Regulation
3.5.1. Environmental Protection Laws
3.5.2. Safety Standards Compliance
3.5.3. Import and Export Regulations
3.5.4. Incentives for Sustainable Practices
3.6. SWOT Analysis
3.7. Stakeholder Ecosystem
3.8. Porters Five Forces
3.9. Competitive Landscape
4.1. By Solvent Type (In Value %)
4.1.1. Aromatic Solvents
4.1.2. Aliphatic Solvents
4.1.3. Polar Solvents
4.1.4. Non-Polar Solvents
4.1.5. Specialty Solvents
4.2. By Application (In Value %)
4.2.1. Paints & Coatings
4.2.2. Pharmaceuticals
4.2.3. Personal Care
4.2.4. Adhesives & Sealants
4.2.5. Cleaning Agents
4.3. By End-Use Industry (In Value %)
4.3.1. Automotive
4.3.2. Construction
4.3.3. Electronics
4.3.4. Textile
4.3.5. Others
4.4. By Region (In Value %)
4.4.1. China
4.4.2. India
4.4.3. Japan
4.4.4. South Korea
4.4.5. Southeast Asia
4.5. By Distribution Channel (In Value %)
4.5.1. Direct Sales
4.5.2. Distributors
4.5.3. Online Retail
4.5.4. Others
4.5.5. OEM Partnerships
5.1. Detailed Profiles of Major Companies
5.1.1. Dow Inc.
5.1.2. BASF SE
5.1.3. Shell Chemicals
5.1.4. ExxonMobil
5.1.5. Eastman Chemical Company
5.1.6. LyondellBasell Industries
5.1.7. Chevron Phillips Chemical
5.1.8. Sinopec
5.1.9. SABIC
5.1.10. Evonik Industries
5.1.11. Mitsubishi Chemical Holdings
5.1.12. INEOS Group
5.1.13. Formosa Plastics Corporation
5.1.14. Celanese Corporation
5.1.15. Huntsman Corporation
5.2. Cross Comparison Parameters (Number of Employees, Headquarters, Inception Year, Revenue, Product Portfolio, Geographic Presence, R&D Investment, Market Share)
5.3. Market Share Analysis
5.4. Strategic Initiatives
5.5. Mergers and Acquisitions
5.6. Investment Analysis
5.7. Venture Capital Funding
5.8. Government Grants
5.9. Private Equity Investments
6.1. Environmental Standards
6.2. Compliance Requirements
6.3. Certification Processes
7.1. Future Market Size Projections
7.2. Key Factors Driving Future Market Growth
8.1. By Solvent Type (In Value %)
8.2. By Application (In Value %)
8.3. By End-Use Industry (In Value %)
8.4. By Region (In Value %)
8.5. By Distribution Channel (In Value %)
9.1. TAM/SAM/SOM Analysis
9.2. Customer Cohort Analysis
9.3. Marketing Initiatives
9.4. White Space Opportunity Analysis
Disclaimer Contact Us
The initial phase involves constructing an ecosystem map encompassing all major stakeholders within the APAC Solvents Market. This step is underpinned by extensive desk research, utilizing a combination of secondary and proprietary databases to gather comprehensive industrylevel information. The primary objective is to identify and define the critical variables that influence market dynamics.
In this phase, we compile and analyze historical data pertaining to the APAC Solvents Market. This includes assessing market penetration, the ratio of marketplaces to service providers, and the resultant revenue generation. Furthermore, an evaluation of service quality statistics will be conducted to ensure the reliability and accuracy of the revenue estimates.
Market hypotheses will be developed and subsequently validated through computerassisted telephone interviews (CATIs) with industry experts representing a diverse array of companies. These consultations will provide valuable operational and financial insights directly from industry practitioners, which will be instrumental in refining and corroborating the market data.
The final phase involves direct engagement with multiple solvent manufacturers to acquire detailed insights into product segments, sales performance, consumer preferences, and other pertinent factors. This interaction will serve to verify and complement the statistics derived from the bottomup approach, thereby ensuring a comprehensive, accurate, and validated analysis of the APAC Solvents Market.
The APAC Solvents market is valued at USD 19 billion, driven by increasing demand from key industries such as paints & coatings, pharmaceuticals, and personal care products. The region's rapid industrialization and technological advancements significantly contribute to the market's substantial size.
Challenges in the APAC Solvents market include volatility in raw material prices, stringent environmental regulations, and high initial investment costs. Additionally, the market faces technical challenges related to solvent efficiency and sustainability requirements.
Key players in the APAC Solvents market include Dow Inc., BASF SE, Shell Chemicals, Eastman Chemical Company, and LyondellBasell Industries. These companies dominate the market due to their extensive product portfolios, strong geographic presence, and continuous innovation.
The APAC Solvents market is propelled by factors such as increasing industrial expansion, technological advancements in solvent production, and rising demand from enduse industries like paints & coatings and pharmaceuticals. Additionally, the shift towards sustainable and ecofriendly solvents is boosting market growth.
 Framework")
What makes us stand out is that our consultants follows Robust, Refine and Result (RRR) methodology. i.e. Robust for clear definitions, approaches and sanity checking, Refine for differentiating respondents facts and opinions and Result for presenting data with story

We have set a benchmark in the industry by offering our clients with syndicated and customized market research reports featuring coverage of entire market as well as meticulous research and analyst insights.

While we don't replace traditional research, we flip the method upside down. Our dual approach of Top Bottom & Bottom Top ensures quality deliverable by not just verifying company fundamentals but also looking at the sector and macroeconomic factors.

With one step in the future, our research team constantly tries to show you the bigger picture. We help with some of the tough questions you may encounter along the way: How is the industry positioned? Best marketing channel? KPI's of competitors? By aligning every element, we help maximize success.

Our report gives you instant access to the answers and sources that other companies might choose to hide. We elaborate each steps of research methodology we have used and showcase you the sample size to earn your trust.

If you need any support, we are here! We pride ourselves on universe strength, data quality, and quick, friendly, and professional service.