
APAC Steam Turbine Market Outlook to 2030
Region:Asia
Author(s):Meenakshi Bisht
Product Code:KROD5902
December 2024
93
About the Report
APAC Steam Turbine Market Overview
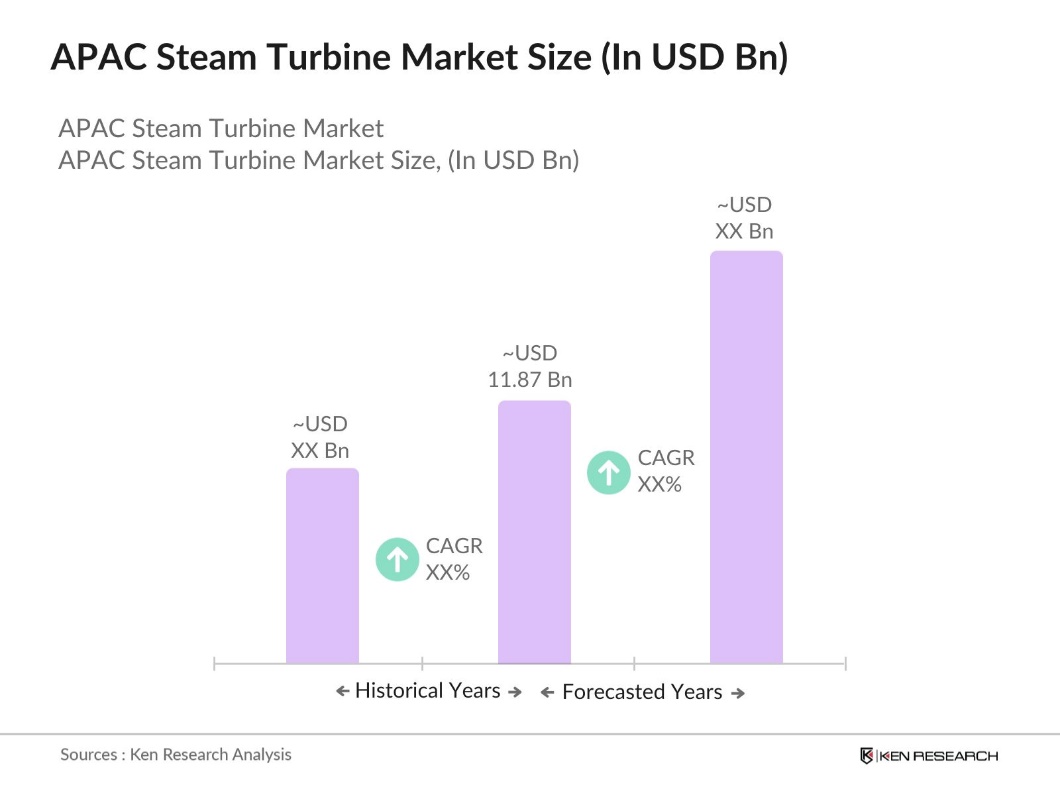
- The APAC Steam Turbine Market is currently valued at USD 11.87 billion, based on a five-year historical analysis. This market is primarily driven by the region's industrial expansion, increasing energy demands, and government initiatives to modernize power generation infrastructure. Significant investments in renewable energy, particularly in geothermal and biomass energy, are further accelerating the demand for steam turbines across key APAC countries.
- Dominant countries in this market include China, India, and Japan, due to their large-scale industrial sectors, high energy demands, and ongoing government-backed initiatives to promote cleaner, more efficient energy generation systems. China remains the largest producer and consumer of steam turbines, while Japan and India continue to be hubs for technological advancements in turbine efficiency and renewable energy integration.
- In December 2023, the State Council released an action plan focusing on air quality enhancement for the coming year. The plan sets a 10% reduction target for PM2.5 density in prefecture-level cities compared to 2020 levels, with specific regional targets of 20% reduction in the Beijing-Tianjin-Hebei region and 15% in the Fenwei Plain.
APAC Steam Turbine Market Segmentation
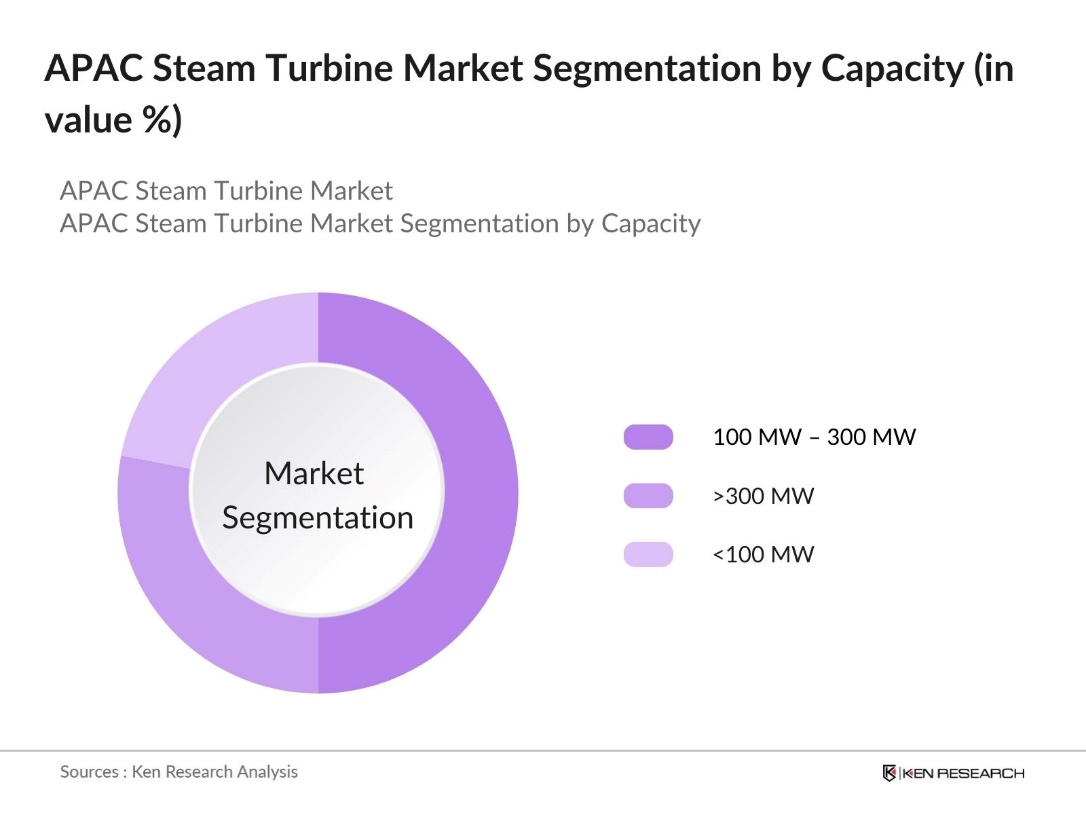
By Capacity: The APAC steam turbine market is segmented by capacity into three key sub-segments: <100 MW, 100 MW 300 MW, and >300 MW. Recently, the 100 MW 300 MW segment has held a dominant market share due to its widespread adoption in medium-sized power plants and industrial facilities. The flexibility and balance offered by turbines within this range make them a preferred choice for both private and public sector projects aimed at improving energy efficiency.
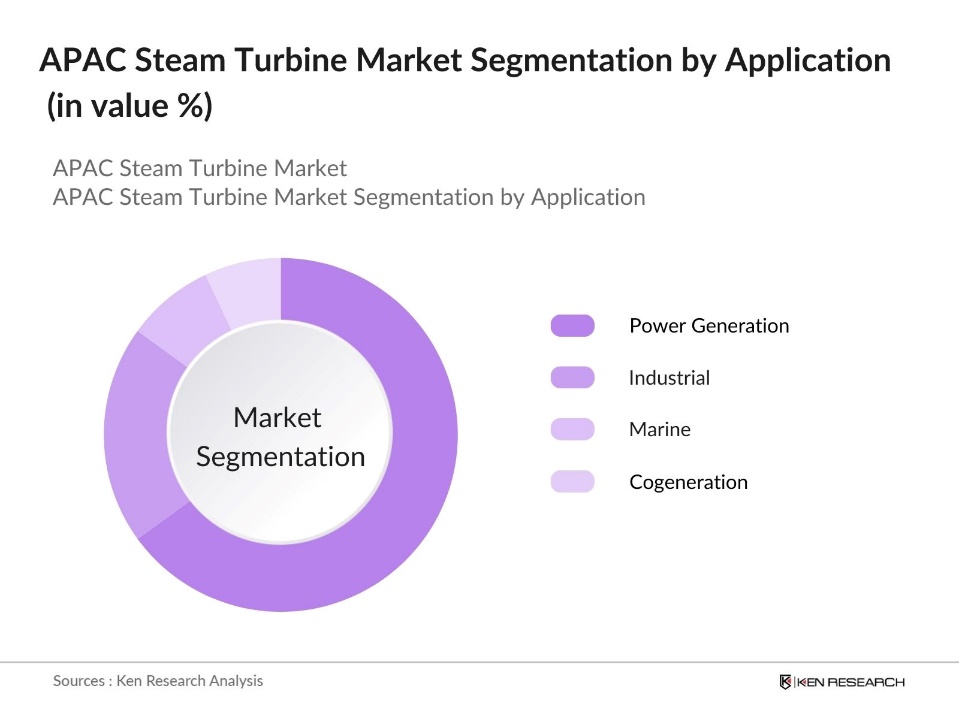
By Application: The APAC steam turbine market is segmented by application into power generation, industrial, marine, and cogeneration. Power generation continues to dominate this segment, as steam turbines remain the backbone of thermal power plants and renewable energy projects like biomass and geothermal energy. In particular, the demand for clean energy sources has pushed the integration of steam turbines into renewable energy projects, making this sub-segment the most significant contributor to the overall market.
APAC Steam Turbine Market Competitive Landscape
The market is dominated by a combination of multinational giants and local manufacturers. The key players in this sector have established a strong foothold through a combination of technological advancements, large-scale manufacturing capabilities, and government-backed projects. The competition is characterized by strategic mergers, acquisitions, and collaborations aimed at enhancing operational efficiency and innovation.
|
Company |
Establishment Year |
Headquarters |
Annual Revenue (USD) |
Installed Capacity (MW) |
Product Line |
Number of Employees |
R&D Expenditure (USD) |
Global Presence |
|
General Electric (GE) |
1892 |
USA |
||||||
|
Siemens Energy |
1847 |
Germany |
||||||
|
Mitsubishi Power |
1870 |
Japan |
||||||
|
Toshiba Energy Systems |
1939 |
Japan |
||||||
|
Harbin Electric International |
1951 |
China |
APAC Steam Turbine Industry Analysis
Growth Drivers
- Industrial Power Needs (Heavy Industries, Manufacturing Plants): Industrial expansion in the Asia-Pacific region is driving significant demand for steam turbines, especially in heavy industries such as steel production and chemical manufacturing. In 2023, China's total electricity consumption reached approximately 8,392 TWh, marking a 7% increase from the previous year, contributing to the growing demand for steam turbines in power generation systems. The region's ongoing industrialization continues to drive the steam turbine market.
- Integration of Steam Turbines in Renewable Energy (Geothermal, Biomass): The Asia-Pacific region is actively integrating renewable energy projects such as geothermal and biomass into its energy grid, creating opportunities for steam turbines. The total geothermal energy capacity in the Philippines reached approximately 1,952 megawatts in 2023, which indicates a robust infrastructure for geothermal energy production. Similarly, Japan and Indonesia are expanding biomass energy projects that utilize steam turbines.
- Energy Efficiency Improvements: Advances in steam turbine technology are boosting energy efficiency, reducing energy losses, and optimizing power generation across the Asia-Pacific region. Governments like Japan are promoting energy-saving technologies to meet sustainability goals, driving demand for modern steam turbines. These improvements help industries reduce operational costs while complying with regulatory standards. Energy efficiency remains a critical factor in the adoption of advanced turbine solutions to meet growing energy demands.
Market Challenges
- High Initial Capital Investment: A major challenge in the APAC steam turbine market is the high initial capital required for installation. The significant upfront costs pose barriers for smaller operators and industries with limited budgets. For industries looking to modernize their power infrastructure, this financial commitment can be substantial, making capital investment a key factor in the decision-making process, especially when considering long-term operational benefits.
- Technological Advancements in Competitor Energy Sources (Gas, Solar, Wind): The steam turbine market is facing increasing competition from energy alternatives like gas, solar, and wind, which are advancing rapidly in efficiency. As industries and governments focus on cleaner and more efficient energy solutions, investments are shifting toward these technologies. This shift challenges steam turbine manufacturers, pushing them to innovate to stay competitive in a market moving toward alternative energy sources.
APAC Steam Turbine Market Future Outlook
Over the next five years, the APAC steam turbine market is poised for substantial growth, driven by increasing investments in power infrastructure and a shift towards cleaner energy sources. Countries such as China, India, and Japan will continue to dominate this market due to their focus on expanding power generation capacity, both in traditional thermal power and renewable energy projects. Additionally, technological advancements like digital twins, AI-powered maintenance solutions, and high-efficiency turbines will further shape the market landscape.
Market Opportunities
- Rising Demand for Green Energy: The growing focus on green energy in the Asia-Pacific region presents key opportunities for steam turbine adoption, particularly in renewable energy projects like geothermal and biomass. As governments prioritize sustainable energy sources, steam turbines are becoming essential for generating electricity in these sectors. This shift towards clean energy solutions creates a strong market for steam turbine technology in power generation, contributing to the regions energy transition.
- Infrastructure Development in Emerging Economies: Emerging economies in the Asia-Pacific region are making substantial investments in infrastructure, driving demand for steam turbines. Countries like Vietnam and the Philippines are focusing on energy infrastructure modernization, with steam turbines playing a critical role in power generation. These infrastructure projects, aimed at enhancing energy capacity and reliability, are creating new opportunities for steam turbine manufacturers in the region.
Scope of the Report
|
Capacity |
<100 MW 100 MW 300 MW >300 MW |
|
Application |
Power Generation Industrial Marine Cogeneration |
|
Technology |
Condensing Non-Condensing Extraction Condensing Reheat Turbines |
|
Fuel Type |
Coal Natural Gas Biomass Nuclear |
|
Region |
East Southeast South Oceania |
Products
Key Target Audience
Environmental and Sustainability Firms
Power Generation Companies
Industrial Automation Companies
Utility Companies
Project Financing Firms
Government and Regulatory Bodies (Ministry of Power, Energy Regulatory Commissions)
Investor and venture capital Firms
Banks and Financial Institutions
Companies
Players Mentioned in the Report
General Electric (GE)
Siemens Energy
Mitsubishi Power
Toshiba Energy Systems
Harbin Electric International
Bharat Heavy Electricals Limited (BHEL)
Doosan koda Power
Hitachi Power
MAN Energy Solutions
Kawasaki Heavy Industries
Shanghai Electric
Table of Contents
1. APAC Steam Turbine Market Overview
1.1. Definition and Scope
1.2. Market Taxonomy
1.3. Market Growth Rate
1.4. Market Segmentation Overview
2. APAC Steam Turbine Market Size (In USD Bn)
2.1. Historical Market Size
2.2. Year-On-Year Growth Analysis
2.3. Key Market Developments and Milestones
3. APAC Steam Turbine Market Analysis
3.1. Growth Drivers (Industrial Expansion, Renewable Energy Integration, Urbanization)
3.1.1. Industrial Power Needs (Heavy Industries, Manufacturing Plants)
3.1.2. Integration of Steam Turbines in Renewable Energy (Geothermal, Biomass)
3.1.3. Energy Efficiency Improvements
3.1.4. Government Energy Policies and Subsidies
3.2. Market Challenges (Technological Complexity, Supply Chain, Competition from Other Energy Sources)
3.2.1. High Initial Capital Investment
3.2.2. Technological Advancements in Competitor Energy Sources (Gas, Solar, Wind)
3.2.3. Geopolitical Factors Impacting Supply Chains
3.3. Opportunities (Technological Advancements, Green Energy Projects, Infrastructure Investments)
3.3.1. Rising Demand for Green Energy
3.3.2. Infrastructure Development in Emerging Economies
3.3.3. Technological Breakthroughs in Steam Turbines (Efficiency, Customization)
3.4. Trends (Digitalization, Efficiency Enhancements, Modular Turbines)
3.4.1. Increasing Use of Digital Twins and IoT in Turbine Management
3.4.2. Hybrid Systems Integrating Gas and Steam Turbines
3.4.3. Compact, Modular Turbines for Distributed Power Generation
3.5. Government Regulation (Environmental Policies, Efficiency Standards, Safety Regulations)
3.5.1. Emission Reduction Regulations
3.5.2. Government Policies for Power Sector Modernization
3.5.3. Energy Efficiency Mandates and Incentives
3.5.4. Regional Safety and Certification Requirements
3.6. SWOT Analysis (Strengths, Weaknesses, Opportunities, Threats)
3.7. Stakeholder Ecosystem (Developers, SaaS Providers, IT Consultants)
3.8. Porters Five Forces Analysis (Competitive Rivalry, Threat of New Entrants)
3.9. Competitive Landscape Analysis
4. APAC Steam Turbine Market Segmentation
4.1. By Capacity (In Value %)
4.1.1. <100 MW
4.1.2. 100 MW 300 MW
4.1.3. >300 MW
4.2. By Application (In Value %)
4.2.1. Power Generation (Thermal, Nuclear, Renewable)
4.2.2. Industrial (Chemical, Pulp & Paper, Oil & Gas)
4.2.3. Marine (Propulsion)
4.2.4. Cogeneration (Combined Heat and Power)
4.3. By Technology (In Value %)
4.3.1. Condensing
4.3.2. Non-Condensing
4.3.3. Extraction Condensing
4.3.4. Reheat Turbines
4.4. By Fuel Type (In Value %)
4.4.1. Coal
4.4.2. Natural Gas
4.4.3. Biomass
4.4.4. Nuclear
4.5. By Region (In Value %)
4.5.1. East Asia
4.5.2. Southeast Asia
4.5.3. South Asia
4.5.4. Oceania
5. APAC Steam Turbine Market Competitive Analysis
5.1 Detailed Profiles of Major Companies
5.1.1. General Electric (GE)
5.1.2. Siemens Energy
5.1.3. Mitsubishi Power
5.1.4. Toshiba Energy Systems
5.1.5. Doosan koda Power
5.1.6. Bharat Heavy Electricals Limited (BHEL)
5.1.7. Hitachi Power
5.1.8. MAN Energy Solutions
5.1.9. Kawasaki Heavy Industries
5.1.10. Harbin Electric International
5.1.11. Shanghai Electric
5.1.12. Ansaldo Energia
5.1.13. Fuji Electric
5.1.14. Elliott Group
5.1.15. Dongfang Electric Corporation
5.2 Cross Comparison Parameters (Market Share, Installed Base, Revenue, Power Capacity Installed)
5.3. Market Share Analysis
5.4. Strategic Initiatives
5.5. Mergers And Acquisitions
5.6. Investment Analysis
5.7. Private Equity and Venture Capital Involvement
6. APAC Steam Turbine Market Regulatory Framework
6.1. Environmental Standards (Emission Control, Carbon Footprint Reduction)
6.2. Compliance Requirements (Safety, Energy Efficiency)
6.3. Certification Processes (ISO Standards, Government Mandates)
7. APAC Steam Turbine Future Market Size (In USD Bn)
7.1. Future Market Size Projections
7.2. Key Factors Driving Future Market Growth
8. APAC Steam Turbine Future Market Segmentation
8.1. By Capacity (In Value %)
8.2. By Application (In Value %)
8.3. By Technology (In Value %)
8.4. By Fuel Type (In Value %)
8.5. By Region (In Value %)
9. APAC Steam Turbine Market Analysts Recommendations
9.1. TAM/SAM/SOM Analysis
9.2. Customer Cohort Analysis
9.3. Market Expansion Strategies
9.4. New Investment Opportunities
Disclaimer Contact UsResearch Methodology
Step 1: Identification of Key Variables
The initial phase involves identifying key market drivers, restraints, and opportunities. This includes mapping the ecosystem by analyzing major players, market dynamics, and regulatory frameworks across the APAC steam turbine market. Secondary data from government publications, industry journals, and reports will form the backbone of this research.
Step 2: Market Analysis and Construction
The second phase entails analyzing historical market data for the APAC steam turbine industry. This step includes evaluating installed capacities, market penetration, and revenue generation. We will rely on company filings, annual reports, and industry databases to construct a comprehensive view of market performance.
Step 3: Hypothesis Validation and Expert Consultation
In the third step, market hypotheses will be validated through expert consultations and industry stakeholder interviews. These interviews will provide insights into current market trends, future outlooks, and technological advancements.
Step 4: Research Synthesis and Final Output
The final phase will involve synthesizing the data collected from primary and secondary sources, ensuring accurate and validated market estimates. The results will be presented in a detailed report, providing key market insights for stakeholders.
Frequently Asked Questions
01. How big is the APAC Steam Turbine Market?
The APAC Steam Turbine Market is valued at USD 11.87 billion. This growth is driven by large-scale industrialization, increased power generation capacity, and government investments in renewable energy projects across the region.
02. What are the challenges in the APAC Steam Turbine Market?
Challenges in the APAC steam turbine market include high initial capital expenditure, evolving emission regulations, and competition from alternative energy sources like solar and wind. Technological advancements in other forms of power generation also pose a threat.
03. Who are the major players in the APAC Steam Turbine Market?
The major players in the APAC steam turbine market include General Electric (GE), Siemens Energy, Mitsubishi Power, Toshiba Energy Systems, and Harbin Electric International. These companies dominate due to their extensive manufacturing capabilities and focus on technological innovation.
04. What are the growth drivers of the APAC Steam Turbine Market?
The APAC steam turbine market is driven by industrial expansion, increasing demand for efficient power generation systems, and the integration of steam turbines into renewable energy projects like biomass and geothermal. Additionally, government policies supporting cleaner energy sources further boost market growth.
Why Buy From Us?
 Framework")
What makes us stand out is that our consultants follows Robust, Refine and Result (RRR) methodology. i.e. Robust for clear definitions, approaches and sanity checking, Refine for differentiating respondents facts and opinions and Result for presenting data with story

We have set a benchmark in the industry by offering our clients with syndicated and customized market research reports featuring coverage of entire market as well as meticulous research and analyst insights.

While we don't replace traditional research, we flip the method upside down. Our dual approach of Top Bottom & Bottom Top ensures quality deliverable by not just verifying company fundamentals but also looking at the sector and macroeconomic factors.

With one step in the future, our research team constantly tries to show you the bigger picture. We help with some of the tough questions you may encounter along the way: How is the industry positioned? Best marketing channel? KPI's of competitors? By aligning every element, we help maximize success.

Our report gives you instant access to the answers and sources that other companies might choose to hide. We elaborate each steps of research methodology we have used and showcase you the sample size to earn your trust.

If you need any support, we are here! We pride ourselves on universe strength, data quality, and quick, friendly, and professional service.