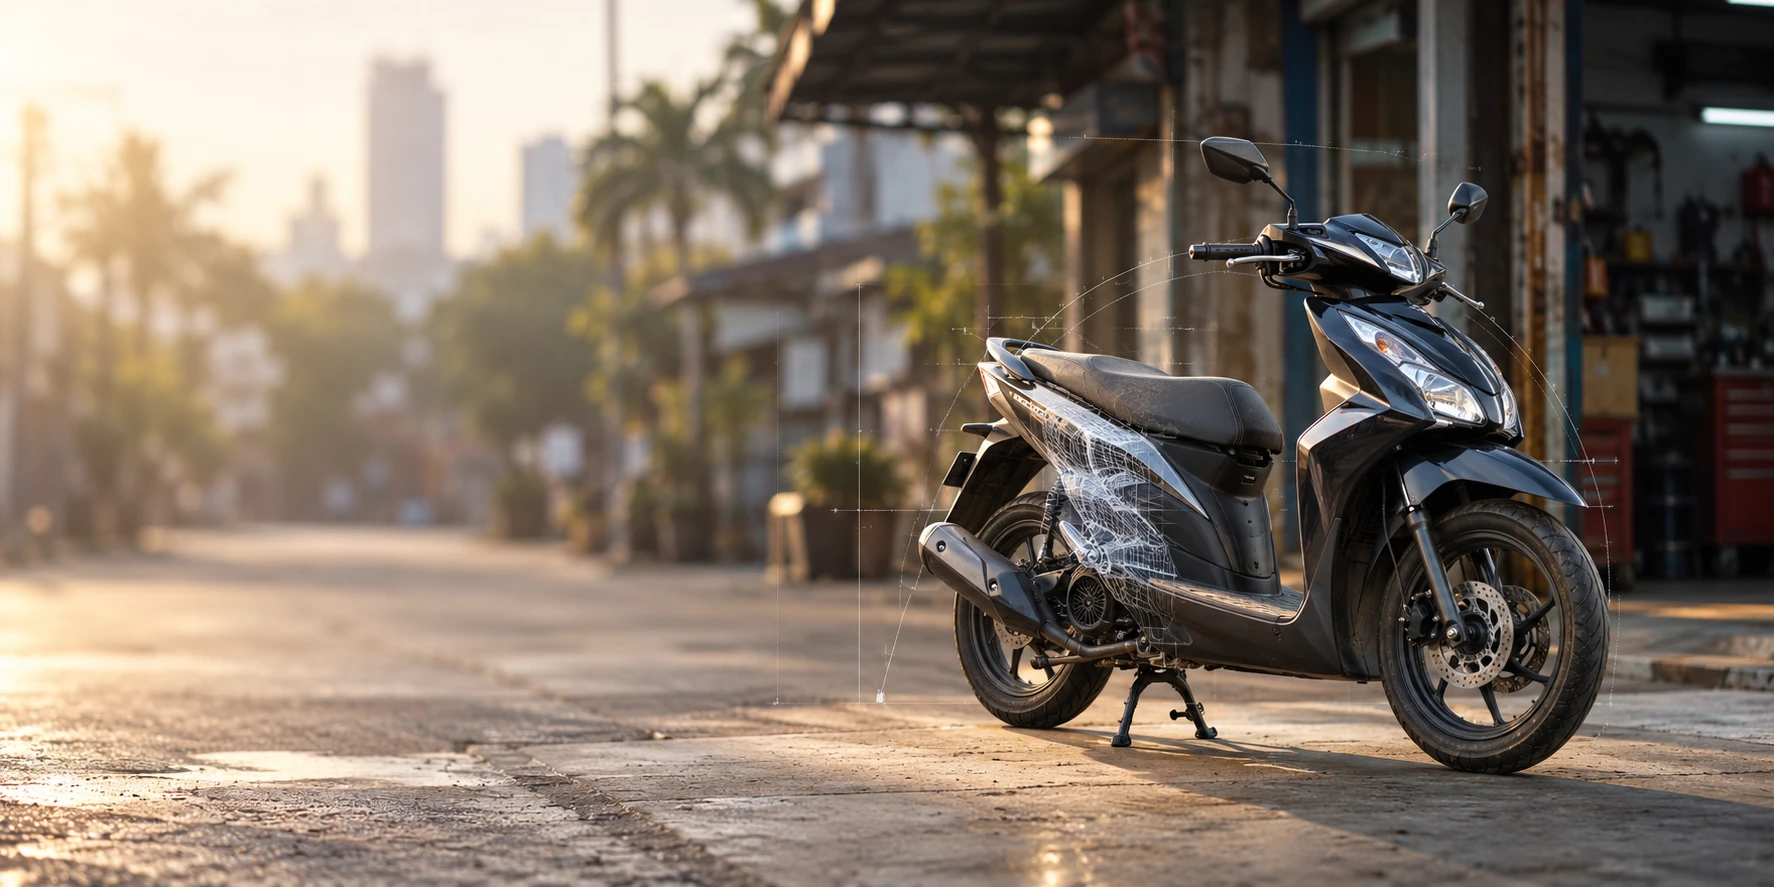
CHAPTER 1 - MARKET SUMMARY
Market Overview
The Indonesia Used Two-Wheeler Market operates through household resales, independent dealers, auctions, digital classifieds and financed marketplace transactions. In 2024, motorcycles were owned by approximately 84% of Indonesian households, supporting a large replacement and resale pool. Buyers prioritize acquisition cost, documentation status, mechanical condition and access to financing, making liquidity and inspection credibility commercially decisive.
Java is the principal transaction corridor because of its population density, dealership networks, financing infrastructure and concentration of app-based delivery activity. West Java alone recorded approximately 23.35 million motorcycles in 2024. This installed base produces recurring replacement inventory and enables dealers, auction houses and finance companies to operate with higher stock turnover than in less densely populated provinces.
Market Value
USD 7,610 million
2025
Dominant Region
Java
2025
Dominant Segment
Automatic Scooters
fastest growing
Total Number of Players
95,000
Future Outlook
The Indonesia Used Two-Wheeler Market is projected to increase from USD 7,610 million in 2025 to approximately USD 16,299 million by 2032, representing an 11.5% forecast CAGR. The corresponding 2031 value is projected at USD 14,618 million. Growth is expected to combine 6.6% annual transaction-volume expansion with approximately 4.6% annual average-price appreciation. Rising new-motorcycle replacement costs, continued growth in the circulating fleet and demand from delivery riders should redirect price-sensitive consumers toward younger used automatic scooters. Formal dealers can capture a larger profit pool through inspections, warranties, financing referrals and documentation support.
Historical gross transaction value expanded at approximately 9.0% annually during 2020-2025, including pandemic disruption and subsequent mobility normalization. Forecast growth is higher because digital listings, auctions and financed dealer channels increase inventory visibility and transaction velocity. Volume is projected to reach approximately 15.11 million units in 2032, while average transaction value rises to about USD 1,079 per unit. Risks include household purchasing-power weakness, inconsistent vehicle histories, fraud, regional ownership-transfer complexity and uncertain residual values for older internal-combustion models as electric mobility develops. Operators with standardized inspection and title verification should achieve stronger conversion and pricing.
11.5%
Forecast CAGR
$16,299 Mn
2030 Projection
Base Year
2025
Historical Period
2020-2025
Forecast Period
2025-2032
Historical CAGR
9.0%
CHAPTER 2 - SCOPE OF REPORT
Scope of the Market
CHAPTER 3 - Key Stakeholders
Key Target Audience
Key stakeholders who can leverage from this market analysis for investment, strategy, and operational planning.
Investors
CAGR, transaction liquidity, margins, credit risk, formalization
Corporates
inventory turnover, sourcing, pricing, warranties, channel expansion
Government
transfers, taxation, roadworthiness, consumer protection, electrification
Operators
inspections, listings, conversion, refurbishment, documentation, logistics
Financial institutions
originations, collateral grading, delinquencies, residual values, insurance
CHAPTER 4 - Market Size & Growth
Market Size, Growth Forecast and Trends
This section evaluates the historical market size, analyzes year-over-year growth dynamics, and presents forecast projections supported by market performance indicators and demand-side drivers.
Historical & Projected Market Size ($ Million)
Year-over-Year Growth Rate (%)
Market Value vs Volume Growth (%)
Historical Market Performance (2020-2025)
Historical performance reflects recovery in mobility activity, expanding motorcycle ownership and rising nominal vehicle prices. Transaction volume increased from approximately 7.20 million units in 2020 to 9.66 million in 2025. Growth moderated to 6.6% in value during 2024 before accelerating in 2025 as price-sensitive buyers shifted toward used vehicles. Automatic scooters captured the strongest liquidity because of their suitability for commuting and delivery work. The 2025 implied average transaction value was approximately USD 788 per unit, confirming that the market remained centered on mass-market models rather than premium motorcycles.
Forecast Market Outlook (2025-2032)
Forecast value growth of 11.5% annually incorporates a 6.6% transaction-volume CAGR and approximately 4.6% annual price appreciation. Volume is expected to reach 15.11 million units by 2032, while the average transaction value approaches USD 1,079. Higher prices for new motorcycles, digital inventory discovery and wider financing access support the expansion. The model retains a domestic-inventory constraint because used-motorcycle imports remain prohibited. Formalized channels should outgrow direct informal transactions as buyers assign greater value to inspections, documentation support, warranties and financing, although consumer-to-consumer trading will remain structurally significant.
CHAPTER 5 - Market Data
Market Breakdown
The market's 2025-2032 trajectory reflects simultaneous increases in transaction count and average selling price. For CEOs and investors, the principal value-creation question is whether inspection, financing and digital-discovery services can monetize a historically informal transaction pool.
Year | Market Size (USD Mn) | YoY Growth (%) | Volume (Mn Units) | Average Transaction Value (USD) | Formal-Channel Penetration (%) | Period |
|---|---|---|---|---|---|---|
| 2020 | $4,945 Mn | +- | 7.20 | 687 | Forecast | |
| 2021 | $5,340 Mn | +8.0% | 7.50 | 712 | Forecast | |
| 2022 | $5,830 Mn | +9.2% | 8.00 | 729 | Forecast | |
| 2023 | $6,400 Mn | +9.8% | 8.50 | 753 | Forecast | |
| 2024 | $6,825 Mn | +6.6% | 9.00 | 758 | Forecast | |
| 2025 | $7,610 Mn | +11.5% | 9.66 | 788 | Forecast | |
| 2026 | $8,480 Mn | +11.4% | 10.30 | 823 | Forecast | |
| 2027 | $9,450 Mn | +11.4% | 10.98 | 861 | Forecast | |
| 2028 | $10,540 Mn | +11.5% | 11.70 | 901 | Forecast | |
| 2029 | $11,750 Mn | +11.5% | 12.47 | 942 | Forecast | |
| 2030 | $13,110 Mn | +11.6% | 13.30 | 986 | Forecast | |
| 2031 | $14,618 Mn | +11.5% | 14.18 | 1,031 | Forecast | |
| 2032 | $16,299 Mn | +11.5% | 15.11 | 1,079 | Forecast |
Transaction Volume
9.66 million units, 2025, Indonesia. Scale rewards platforms that aggregate fragmented supply and shorten dealer inventory days. The national motorcycle fleet reached 139.45 million units in 2024.
Average Transaction Value
USD 788 per unit, 2025, Indonesia. Pricing remains concentrated around affordable commuter scooters, limiting pure trading margins and increasing the importance of finance referrals and ancillary services. The most-searched OLX band was IDR 10-20 million in 2025.
Formal-Channel Penetration
40% of transaction value, 2025, Indonesia. Inspection, title verification and warranty products can shift transactions from informal sellers. Momotor combines used listings with Adira-backed financing under financial-services supervision.
CHAPTER 6 - Segmentation
Market Segmentation Framework
Comprehensive analysis across key dimensions providing insights into market structure, consumer preferences, and distribution patterns.
No of Segments
7
Dominant Segment
Vehicle Type
Fastest Growing Segment
Sales Channel
Vehicle Type
Customer Type
Sales Channel
Powertrain
Usage Type
Price Tier
Geography
Key Segmentation Takeaways
Comprehensive analysis across all extracted segmentation dimensions providing insights into market structure, consumer preferences, and distribution patterns.
Vehicle Type
Automatic scooters dominate transaction liquidity because their step-through configuration, fuel economy and storage capacity suit commuting and delivery activity. Honda BeAT, Scoopy and Vario families have broad servicing networks and readily observable resale prices. Buyers therefore face lower search costs and dealers can turn standardized scooter inventory faster than specialist sport, trail or collectible models.
Sales Channel
Digital marketplaces are the fastest-growing channel because searchable inventory, location filters and direct buyer-seller communication reduce discovery friction. Managed channels add inspection, documentation, financing and auction functionality. Growth depends on converting online leads into verified physical transactions, since vehicle condition, ownership records and local transfer requirements prevent the market from becoming entirely remote.
CHAPTER 7 - Regional Analysis
Regional Analysis
Indonesia ranks first among selected Southeast Asian peer markets by estimated used two-wheeler transaction value, supported by its exceptionally large registered fleet and widespread household ownership. Vietnam and Thailand remain relevant comparators, while the Philippines and Malaysia have smaller addressable resale pools.
Peer-Country Ranking
1st
Indonesia Market Size (2025)
USD 7,610 Mn
Indonesia CAGR (2025-2032)
11.5%
Peer-Country Ranking
1st
Indonesia Market Size (2025)
USD 7,610 Mn
Indonesia CAGR (2025-2032)
11.5%
Regional Analysis (Current Year)
Regional Analysis Comparison
| Metric | Indonesia | Vietnam | Thailand | Philippines | Malaysia |
|---|---|---|---|---|---|
| Market Size (2025, USD Mn) | 7,610 | 4,200 | 2,850 | 2,100 | 1,650 |
| CAGR (2025-2032) | 11.5% | 7.8% | 6.9% | 9.4% | 6.2% |
Market Position
Indonesia ranks first in the selected peer group, with its 139.45 million-unit registered motorcycle fleet creating the region's deepest domestic pool of resale inventory.
Growth Advantage
Indonesia's projected 11.5% CAGR exceeds the modelled 9.4% for the Philippines and 7.8% for Vietnam, reflecting stronger formalization and nominal price effects.
Competitive Strengths
An 84% household ownership rate, a 139.45 million-unit fleet and 0% down-payment eligibility provide Indonesia with exceptional transaction depth and financing potential.
CHAPTER 8 - INDUSTRY ANALYSIS
Growth Drivers, Challenges & Opportunities
Comprehensive analysis of key factors shaping the Indonesia Used Two-Wheeler Market, including growth catalysts, operational challenges, and emerging opportunities across sourcing, distribution and consumer segments.
Growth Drivers
Expanding Domestic Resale Pool
- Fleet growth expands the number of vehicles reaching typical first-resale age, supporting dealer sourcing and household liquidity beyond new-motorcycle sales cycles. 139.45 million units (2024, Indonesia)
- Household penetration sustains replacement demand across income groups, with 84% household motorcycle ownership (2024, Indonesia) reinforcing the product's role as essential mobility.
- West Java's dense installed base supports local procurement and faster stock rotation, with 23.35 million motorcycles (2024, West Java) providing scale for multi-outlet dealers.
Affordability-Led Substitution
- Popular scooter families concentrate liquidity and reduce resale-price uncertainty, with five leading searched models (2025, Indonesia) led by Vario, BeAT and Scoopy.
- Opsen taxation and ownership expenses increase total new-vehicle acquisition costs, strengthening substitution toward inspected used stock from 2025 onward (Indonesia).
- Rupiah depreciation raises imported-component replacement costs and nominal resale anchors, with IDR 16,703 per USD (November 2025, Indonesia) influencing price formation.
Financing and Digital Channel Development
- Qualifying financiers may offer 0% down payments (effective December 2025, Indonesia), potentially widening the financed-buyer pool while increasing underwriting requirements.
- Finance-backed marketplaces integrate discovery and applications, with Momotor operating under Adira's supervised framework in 2026 (Indonesia).
- Online classifieds offer direct communication, location and model filters across thousands of listings (2025, Indonesia), reducing buyer search costs while preserving offline inspection.
Market Challenges
Unmeasured Informal Transactions
- Cash-based household resales remain difficult to observe, producing a minus 24% to plus 44% confidence interval (2025 estimate, Indonesia) around national transaction value.
- Fragmentation across an estimated 95,000 dealer and reseller outlets (2025, Indonesia) complicates inventory census, tax reporting and standardized consumer protection.
- The absence of consolidated second-transfer data forces operators to rely on platform leads and local sourcing intelligence despite a 139.45 million-unit fleet (2024, Indonesia).
Condition, Fraud and Documentation Risk
- Undisclosed collision or flood damage can create warranty losses for dealers, making standardized inspection necessary across millions of annual transactions (2025, Indonesia).
- Ownership documents and tax status must be checked before payment; OLX explicitly advises physical verification for every direct transaction (2025, Indonesia).
- Regional variation in transfer procedures increases completion time, while online-to-offline transactions remain necessary across 38 provinces (2025, Indonesia).
Household Purchasing-Power Pressure
- Higher financing costs increase monthly instalments and delinquency sensitivity on a used-two-wheeler book of IDR 24.63 trillion (July 2025, Indonesia).
- Price-sensitive buyers cluster around IDR 10-20 million (2025, Indonesia), restricting dealer reconditioning expenditure and gross-margin headroom.
- Electric-transition uncertainty can shorten holding periods for older combustion models, while electric used units remain a small share of the 2025 market (Indonesia).
Market Opportunities
Certified Used-Motorcycle Programs
- Dealers can bundle inspection, refurbishment and limited warranty products, increasing revenue per unit above the USD 788 average transaction value (2025, Indonesia).
- Financiers benefit from better collateral grading and residual-value data against a IDR 24.63 trillion used-two-wheeler book (July 2025, Indonesia).
- Scale requires shared inspection standards and auditable vehicle histories across an estimated 95,000 outlets (2025, Indonesia).
Embedded Finance and Insurance
- Platforms can earn referral and servicing income by converting listing traffic into financed purchases within a USD 7,610 million market (2025, Indonesia).
- Financiers and insurers benefit from standardized buyer verification and asset inspection across 9.66 million annual transactions (2025, Indonesia).
- Responsible expansion requires fraud controls and affordability assessment despite the permitted 0% minimum down payment (2025 regulation, Indonesia).
Digital Auctions and Fleet Remarketing
- Fleet operators can reduce disposal time by aggregating repossessed and replacement units into transparent auctions serving nationwide dealer demand. JBA processed more than 150,000 mixed vehicle lots (H1 2026, Indonesia).
- Dealers benefit from standardized condition reports and remote bidding, improving sourcing beyond local networks across 38 provinces (2025, Indonesia).
- Growth requires interoperable documentation and logistics support because physical delivery remains necessary for 100% of completed vehicle transactions (Indonesia).
CHAPTER 9 - Competitive Landscape
Competitive Landscape Overview
Competition is highly fragmented across household sellers, dealers, marketplaces, auctions and financiers. Scale advantages arise from listing liquidity, inspection capability, dealer reach, credit underwriting and remarketing infrastructure rather than exclusive inventory ownership.
Market Share Distribution
Top 5 Players
Market Dynamics
8 new entrants in the past 5 years, indicating strong market attractiveness and growth potential.
Company Name | Market Share | Headquarters | Founding Year | Core Market Focus |
|---|---|---|---|---|
OLX Indonesia | - | Jakarta, Indonesia | - | Digital used-motorcycle classifieds |
PT Adira Dinamika Multi Finance Tbk and Momotor | - | Jakarta, Indonesia | 1990 | Used-motorcycle marketplace and financing |
PT Federal International Finance | - | Jakarta, Indonesia | 1989 | Two-wheeler consumer financing |
PT Wahana Ottomitra Multiartha Tbk | - | Jakarta, Indonesia | 1982 | Motorcycle financing |
PT Mandala Multifinance Tbk | - | Jakarta, Indonesia | 1983 | New and used motorcycle financing |
PT BFI Finance Indonesia Tbk | - | South Tangerang, Indonesia | 1982 | Vehicle-backed and consumer financing |
JBA Indonesia | - | Jakarta, Indonesia | - | Physical and online vehicle auctions |
Carousell Indonesia | - | Singapore | 2012 | Consumer-to-consumer digital classifieds |
Facebook Marketplace | - | Menlo Park, United States | 2004 | Social marketplace listings |
Motoran | - | Jakarta, Indonesia | 2018 | Used-motorcycle dealer enablement |
Cross Comparison Parameters
The report provides detailed cross-comparison of key players across 10 performance parameters to identify competitive strengths and weaknesses.
Verified Motorcycle Listings
Dealer and Auction Network Coverage
Used-Two-Wheeler Financing Growth
Revenue per Completed Transaction
Analysis Covered
Market Share Analysis:
Compares transaction reach across fragmented digital and physical channels.
Cross Comparison Matrix:
Benchmarks listings, networks, financing growth and transaction monetization performance.
SWOT Analysis:
Evaluates platform liquidity, underwriting capability, trust and execution constraints.
Pricing Strategy Analysis:
Compares listing, inspection, financing and auction monetization approaches.
Company Profiles:
Reviews ownership, operating focus, channel position and strategic capabilities.
CHAPTER 10 - REPORT TOC
Market Report Structure
Comprehensive coverage across three strategic phases - Market Assessment, Go-To-Market Strategy, and Survey - delivering end-to-end insights from market analysis and execution roadmap to customer demand validation.
Market Assessment Phase
Supply-side and competitive intelligence covering market sizing, segmentation, competitive dynamics, regulatory landscape, and future forecasts.
Go-To-Market Strategy Phase
15 chapters
Entry strategy evaluation, execution roadmap, partner recommendations, and profitability outlook.
Survey Phase
8 chapters
Demand-side primary research conducted through structured interviews and online surveys with end users across priority metros and Tier 2/3 cities to capture consumption behavior, unmet needs, and purchase drivers.
Complete Report Coverage
201+ detailed sections covering every aspect of the market
143
Assessment Sections
58
Strategy Sections
CHAPTER 11 - Our Approach
Research Methodology
Desk Research
- Motorcycle fleet statistics review
- Used-financing portfolio assessment
- Marketplace listing and pricing analysis
- Ownership-transfer regulation mapping
Primary Research
- Used-motorcycle dealer owner interviews
- Multifinance portfolio manager interviews
- Auction operations manager consultations
- Marketplace category manager interviews
Validation and Triangulation
- 280 respondent evidence sample
- Dealer throughput cross-checking
- Fleet turnover sensitivity testing
- Financing stock-flow reconciliation
CHAPTER 12 - FAQ
FAQs
Still have questions?
Our research team is here to help you find the right solution
CHAPTER 13 - Related Research
Explore Related Reports
Expand your market intelligence with complementary research across regions and adjacent markets.
Regional/Country ReportsRelated market analysis across key regions
Related market analysis across key regions
- Indonesia Used Two-Wheeler Market Size, Share & Forecast, By Vehicle Type, Sales Channel & Price Tier, 2025-2032
- Vietnam Used Two-Wheeler Market Size, Share & Forecast, By Vehicle Type, Sales Channel & Price Tier, 2025-2032
- Thailand Used Two-Wheeler Market Size, Share & Forecast, By Vehicle Type, Sales Channel & Price Tier, 2025-2032
- Malaysia Used Two-Wheeler Market Size, Share & Forecast, By Vehicle Type, Sales Channel & Price Tier, 2025-2032
- Philippines Used Two-Wheeler Market Size, Share & Forecast, By Vehicle Type, Sales Channel & Price Tier, 2025-2032
Adjacent ReportsRelated markets and complementary research
Related markets and complementary research
- UAE Digital Automotive Marketplace Market
- Philippines Motorcycle Financing Solutions Market
- Germany Vehicle Inspection and Certification Market
- Germany Used Vehicle Auction Market
- Japan Automotive Insurance Technology Market
500+
Market Research Reports
50+
Countries Covered
15+
Industry Verticals