About the Report
Base Year 2024Europe Coffee Machine Market Overview
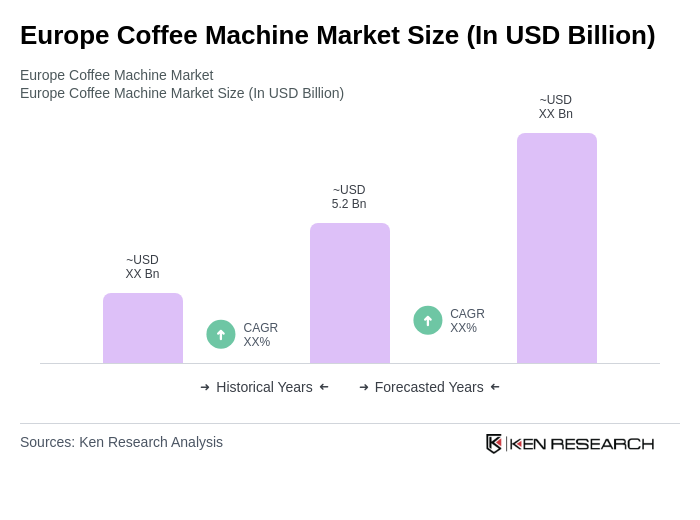
- The Europe Coffee Machine Market is valued at USD 5.2 billion, based on a five-year historical analysis. This growth is primarily driven by the increasing demand for premium coffee experiences, the rise of specialty coffee culture, and the growing trend of home brewing among consumers. The market has seen a significant shift towards high-quality, innovative coffee machines that cater to the evolving preferences of coffee enthusiasts. Recent trends highlight the adoption of smart and connected coffee machines, integration with mobile apps, and a marked consumer preference for energy-efficient and eco-friendly appliances.
- Countries such as Germany, Italy, and France dominate the Europe Coffee Machine Market due to their rich coffee culture and high consumption rates. Germany leads with its strong retail presence and consumer preference for advanced coffee machines, while Italy is renowned for its espresso culture, driving demand for espresso machines. France, with its café culture, also significantly contributes to the market's growth. In Germany, technological innovation and environmental trends are especially strong drivers, with a notable rise in smart and energy-efficient coffee machine sales.
- In 2023, the European Union implemented regulations aimed at enhancing energy efficiency standards for household appliances, including coffee machines. This regulation mandates that all new coffee machines must meet specific energy consumption criteria, promoting sustainability and reducing environmental impact. Manufacturers are required to comply with these standards to ensure their products are marketable within the EU.
Europe Coffee Machine Market Segmentation
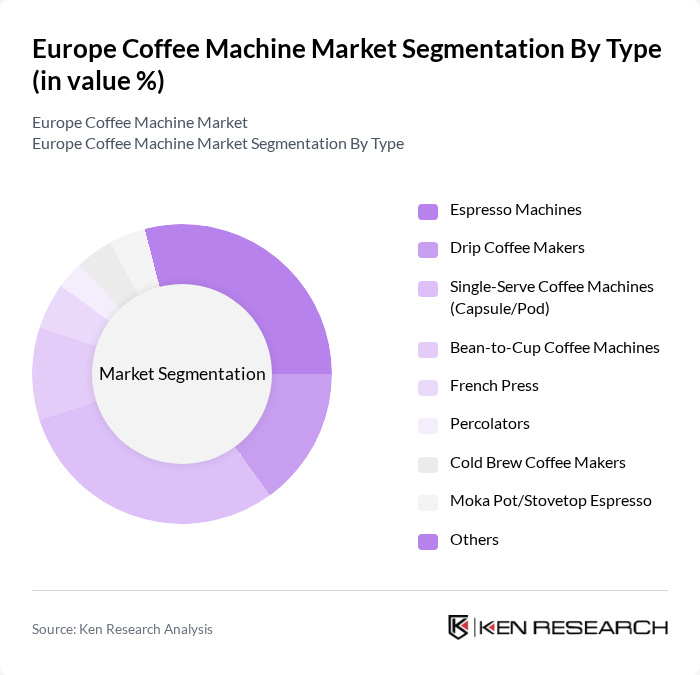
By Type:The coffee machine market can be segmented into various types, including Espresso Machines, Drip Coffee Makers, Single-Serve Coffee Machines (Capsule/Pod), Bean-to-Cup Coffee Machines, French Press, Percolators, Cold Brew Coffee Makers, Moka Pot/Stovetop Espresso, and Others. Among these, Single-Serve Coffee Machines have gained significant popularity due to their convenience and ease of use, catering to the busy lifestyles of consumers. Espresso Machines also hold a substantial share, driven by the growing preference for café-style coffee at home. The market is also witnessing increased demand for smart and connected models, as well as energy-efficient and sustainable brewing solutions.
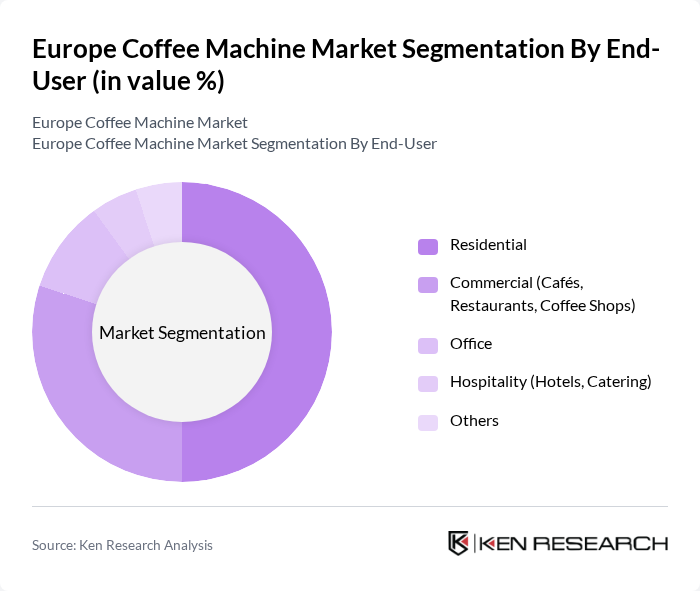
By End-User:The market can be segmented based on end-users, including Residential, Commercial (Cafés, Restaurants, Coffee Shops), Office, Hospitality (Hotels, Catering), and Others. The Residential segment is currently the largest, driven by the increasing trend of home brewing and the desire for high-quality coffee experiences at home. The Commercial segment also plays a crucial role, as cafés and restaurants invest in premium coffee machines to meet customer demands. Offices and hospitality venues are increasingly adopting energy-efficient and smart coffee machines to enhance user experience and operational efficiency.
Europe Coffee Machine Market Competitive Landscape
The Europe Coffee Machine Market is characterized by a dynamic mix of regional and international players. Leading participants such as Nestlé S.A. (Nespresso, Dolce Gusto), JURA Elektroapparate AG, De'Longhi S.p.A., Breville Group Limited, Koninklijke Philips N.V., Bosch Home Appliances (BSH Hausgeräte GmbH), Krups S.A.S. (Groupe SEB), Saeco International Group S.p.A. (Philips), Gaggia S.p.A., Hamilton Beach Brands Holding Company, Cuisinart (Conair Corporation), Smeg S.p.A., Rancilio Group S.p.A., La Marzocco S.r.l., Tchibo GmbH, Melitta Group, Miele & Cie. KG, Siemens Home Appliances (BSH Hausgeräte GmbH), WMF Group GmbH, Lavazza Group contribute to innovation, geographic expansion, and service delivery in this space.
Europe Coffee Machine Market Industry Analysis
Growth Drivers
- Increasing Consumer Demand for Specialty Coffee:The European coffee market is witnessing a significant shift towards specialty coffee, with sales reaching approximately €3.8 billion in future. This trend is driven by consumers' growing preference for high-quality, artisanal coffee experiences. According to the European Coffee Federation, 60% of coffee drinkers in Europe now prefer specialty options, indicating a robust demand that is expected to continue fueling the coffee machine market as consumers seek equipment that can replicate café-quality brews at home.
- Rise in Home Brewing Trends:The home brewing segment has seen a remarkable increase, with over 45% of European households owning a coffee machine in future. This trend is largely attributed to the COVID-19 pandemic, which shifted consumer behavior towards home-based coffee experiences. The market for home brewing machines is projected to grow, with an estimated 16 million units sold in future, as consumers invest in quality equipment to enhance their home coffee rituals and save on café visits.
- Technological Advancements in Coffee Machines:The coffee machine industry is rapidly evolving, with innovations such as smart technology and IoT integration becoming prevalent. In future, approximately 30% of coffee machines sold in Europe featured smart capabilities, allowing users to control brewing remotely. This technological shift is expected to drive sales further, as consumers increasingly seek convenience and customization in their coffee-making processes, with an estimated 25% growth in smart coffee machine sales anticipated in future.
Market Challenges
- High Competition Among Established Brands:The European coffee machine market is characterized by intense competition, with major players like De'Longhi, Breville, and Philips dominating the landscape. In future, these brands accounted for over 65% of the market share. This competitive pressure can lead to price wars, reducing profit margins for manufacturers. As new entrants emerge, established brands must innovate continuously to maintain their market position, which can strain resources and impact overall profitability.
- Fluctuating Coffee Bean Prices:The coffee industry is significantly affected by the volatility of coffee bean prices, which can fluctuate due to climate change, geopolitical factors, and supply chain disruptions. In future, the average price of Arabica coffee beans rose to €2.75 per kilogram, a 35% increase from the previous period. Such fluctuations can impact the cost of coffee machines, as manufacturers may face increased production costs, which could be passed on to consumers, affecting demand.
Europe Coffee Machine Market Future Outlook
The future of the Europe coffee machine market appears promising, driven by evolving consumer preferences and technological advancements. As the demand for specialty coffee continues to rise, manufacturers are likely to focus on developing innovative, user-friendly machines that cater to this trend. Additionally, the integration of sustainable practices and eco-friendly materials in production will become increasingly important, aligning with consumer values. The market is expected to adapt to these changes, fostering growth and enhancing the overall coffee experience for consumers.
Market Opportunities
- Growth in E-commerce Sales Channels:The shift towards online shopping presents a significant opportunity for coffee machine manufacturers. In future, e-commerce sales accounted for 35% of total coffee machine sales in Europe. This trend is expected to grow, with online sales projected to reach €1.2 billion in future, as consumers increasingly prefer the convenience of purchasing appliances online, driving market expansion.
- Increasing Focus on Sustainable Products:As consumers become more environmentally conscious, there is a growing demand for sustainable coffee machines. In future, sales of eco-friendly coffee machines increased by 45%, reflecting a shift in consumer preferences. Manufacturers that prioritize sustainability in their product offerings are likely to capture a larger market share, with potential sales growth of €600 million anticipated in future, as eco-conscious consumers seek greener options.
Scope of the Report
| Segment | Sub-Segments |
|---|---|
| By Type | Espresso Machines Drip Coffee Makers Single-Serve Coffee Machines (Capsule/Pod) Bean-to-Cup Coffee Machines French Press Percolators Cold Brew Coffee Makers Moka Pot/Stovetop Espresso Others |
| By End-User | Residential Commercial (Cafés, Restaurants, Coffee Shops) Office Hospitality (Hotels, Catering) Others |
| By Distribution Channel | Online Retail Specialty Stores Supermarkets/Hypermarkets Direct Sales (B2B) Others |
| By Price Range | Budget Mid-Range Premium Luxury |
| By Brand | Established Brands Emerging Brands Private Labels Others |
| By Features | Programmable Settings Built-in Grinder Milk Frother Smart Connectivity (Wi-Fi/Bluetooth) Energy Efficiency Touchless Operation Others |
| By Material | Plastic Stainless Steel Glass Others |
Key Target Audience
Investors and Venture Capitalist Firms
Government and Regulatory Bodies (e.g., European Food Safety Authority, European Commission)
Manufacturers and Producers
Distributors and Retailers
Importers and Exporters
Technology Providers
Industry Associations (e.g., Specialty Coffee Association, European Coffee Federation)
Financial Institutions
Players Mentioned in the Report:
Nestle S.A. (Nespresso, Dolce Gusto)
JURA Elektroapparate AG
De'Longhi S.p.A.
Breville Group Limited
Koninklijke Philips N.V.
Bosch Home Appliances (BSH Hausgerate GmbH)
Krups S.A.S. (Groupe SEB)
Saeco International Group S.p.A. (Philips)
Gaggia S.p.A.
Hamilton Beach Brands Holding Company
Cuisinart (Conair Corporation)
Smeg S.p.A.
Rancilio Group S.p.A.
La Marzocco S.r.l.
Tchibo GmbH
Melitta Group
Miele & Cie. KG
Siemens Home Appliances (BSH Hausgerate GmbH)
WMF Group GmbH
Lavazza Group
Table of Contents
Market Assessment Phase
1. Executive Summary and Approach
2. Europe Coffee Machine Market Overview
2.1 Key Insights and Strategic Recommendations
2.2 Europe Coffee Machine Market Overview
2.3 Definition and Scope
2.4 Evolution of Market Ecosystem
2.5 Timeline of Key Regulatory Milestones
2.6 Value Chain & Stakeholder Mapping
2.7 Business Cycle Analysis
2.8 Policy & Incentive Landscape
3. Europe Coffee Machine Market Analysis
3.1 Growth Drivers
3.1.1 Increasing Consumer Demand for Specialty Coffee
3.1.2 Rise in Home Brewing Trends
3.1.3 Technological Advancements in Coffee Machines
3.1.4 Expansion of Coffee Shops and Cafés
3.2 Market Challenges
3.2.1 High Competition Among Established Brands
3.2.2 Fluctuating Coffee Bean Prices
3.2.3 Regulatory Compliance Costs
3.2.4 Consumer Price Sensitivity
3.3 Market Opportunities
3.3.1 Growth in E-commerce Sales Channels
3.3.2 Increasing Focus on Sustainable Products
3.3.3 Development of Smart Coffee Machines
3.3.4 Expansion into Emerging Markets
3.4 Market Trends
3.4.1 Shift Towards Eco-friendly Coffee Machines
3.4.2 Customization and Personalization in Coffee Brewing
3.4.3 Integration of IoT in Coffee Machines
3.4.4 Growth of Subscription Services for Coffee Supplies
3.5 Government Regulation
3.5.1 Compliance with EU Energy Efficiency Standards
3.5.2 Regulations on Waste Management and Recycling
3.5.3 Safety Standards for Electrical Appliances
3.5.4 Import Tariffs on Coffee Machines
4. SWOT Analysis
5. Stakeholder Analysis
6. Porter's Five Forces Analysis
7. Europe Coffee Machine Market Market Size, 2019-2024
7.1 By Value
7.2 By Volume
7.3 By Average Selling Price
8. Europe Coffee Machine Market Segmentation
8.1 By Type
8.1.1 Espresso Machines
8.1.2 Drip Coffee Makers
8.1.3 Single-Serve Coffee Machines (Capsule/Pod)
8.1.4 Bean-to-Cup Coffee Machines
8.1.5 French Press
8.1.6 Percolators
8.1.7 Cold Brew Coffee Makers
8.1.8 Moka Pot/Stovetop Espresso
8.1.9 Others
8.2 By End-User
8.2.1 Residential
8.2.2 Commercial (Cafés, Restaurants, Coffee Shops)
8.2.3 Office
8.2.4 Hospitality (Hotels, Catering)
8.2.5 Others
8.3 By Distribution Channel
8.3.1 Online Retail
8.3.2 Specialty Stores
8.3.3 Supermarkets/Hypermarkets
8.3.4 Direct Sales (B2B)
8.3.5 Others
8.4 By Price Range
8.4.1 Budget
8.4.2 Mid-Range
8.4.3 Premium
8.4.4 Luxury
8.5 By Brand
8.5.1 Established Brands
8.5.2 Emerging Brands
8.5.3 Private Labels
8.5.4 Others
8.6 By Features
8.6.1 Programmable Settings
8.6.2 Built-in Grinder
8.6.3 Milk Frother
8.6.4 Smart Connectivity (Wi-Fi/Bluetooth)
8.6.5 Energy Efficiency
8.6.6 Touchless Operation
8.6.7 Others
8.7 By Material
8.7.1 Plastic
8.7.2 Stainless Steel
8.7.3 Glass
8.7.4 Others
9. Europe Coffee Machine Market Competitive Analysis
9.1 Market Share of Key Players
9.2 Cross Comparison of Key Players
9.2.1 Company Name
9.2.2 Group Size (Large, Medium, or Small as per industry convention)
9.2.3 Revenue Growth Rate (annual %)
9.2.4 Market Penetration Rate (units sold or % share in Europe)
9.2.5 Customer Retention Rate (%)
9.2.6 Average Order Value (EUR/unit)
9.2.7 Pricing Strategy (Budget, Premium, Luxury)
9.2.8 Product Innovation Rate (number of new models launched/year)
9.2.9 Distribution Network Efficiency (number of retail partners, coverage)
9.2.10 Brand Recognition Score (survey-based or market index)
9.2.11 Sustainability Initiatives (energy efficiency, recyclability, eco-certifications)
9.2.12 After-Sales Service Quality (service network size, response time)
9.3 SWOT Analysis of Top Players
9.4 Pricing Analysis
9.5 Detailed Profile of Major Companies
9.5.1 Nestlé S.A. (Nespresso, Dolce Gusto)
9.5.2 JURA Elektroapparate AG
9.5.3 De'Longhi S.p.A.
9.5.4 Breville Group Limited
9.5.5 Koninklijke Philips N.V.
9.5.6 Bosch Home Appliances (BSH Hausgeräte GmbH)
9.5.7 Krups S.A.S. (Groupe SEB)
9.5.8 Saeco International Group S.p.A. (Philips)
9.5.9 Gaggia S.p.A.
9.5.10 Hamilton Beach Brands Holding Company
9.5.11 Cuisinart (Conair Corporation)
9.5.12 Smeg S.p.A.
9.5.13 Rancilio Group S.p.A.
9.5.14 La Marzocco S.r.l.
9.5.15 Tchibo GmbH
9.5.16 Melitta Group
9.5.17 Miele & Cie. KG
9.5.18 Siemens Home Appliances (BSH Hausgeräte GmbH)
9.5.19 WMF Group GmbH
9.5.20 Lavazza Group
10. Europe Coffee Machine Market End-User Analysis
10.1 Procurement Behavior of Key Ministries
10.1.1 Government Procurement Policies
10.1.2 Budget Allocations for Coffee Machines
10.1.3 Supplier Selection Criteria
10.2 Corporate Spend on Infrastructure & Energy
10.2.1 Investment in Coffee Equipment
10.2.2 Budget Trends in Corporate Cafés
10.2.3 Cost Management Strategies
10.3 Pain Point Analysis by End-User Category
10.3.1 Quality Consistency Issues
10.3.2 Maintenance and Service Challenges
10.3.3 User Experience and Usability Concerns
10.4 User Readiness for Adoption
10.4.1 Awareness of New Technologies
10.4.2 Training and Support Needs
10.4.3 Adoption Barriers
10.5 Post-Deployment ROI and Use Case Expansion
10.5.1 Measurement of ROI
10.5.2 Expansion of Use Cases
10.5.3 Long-term Value Assessment
11. Europe Coffee Machine Market Future Size, 2025-2030
11.1 By Value
11.2 By Volume
11.3 By Average Selling Price
Go-To-Market Strategy Phase
1. Whitespace Analysis + Business Model Canvas
1.1 Market Gaps Identification
1.2 Business Model Framework
2. Marketing and Positioning Recommendations
2.1 Branding Strategies
2.2 Product USPs
3. Distribution Plan
3.1 Urban Retail Strategies
3.2 Rural NGO Tie-ups
4. Channel & Pricing Gaps
4.1 Underserved Routes
4.2 Pricing Bands
5. Unmet Demand & Latent Needs
5.1 Category Gaps
5.2 Consumer Segments
6. Customer Relationship
6.1 Loyalty Programs
6.2 After-sales Service
7. Value Proposition
7.1 Sustainability Initiatives
7.2 Integrated Supply Chains
8. Key Activities
8.1 Regulatory Compliance
8.2 Branding Efforts
8.3 Distribution Setup
9. Entry Strategy Evaluation
9.1 Domestic Market Entry Strategy
9.1.1 Product Mix Considerations
9.1.2 Pricing Band Strategy
9.1.3 Packaging Approaches
9.2 Export Entry Strategy
9.2.1 Target Countries
9.2.2 Compliance Roadmap
10. Entry Mode Assessment
10.1 Joint Ventures
10.2 Greenfield Investments
10.3 Mergers & Acquisitions
10.4 Distributor Model
11. Capital and Timeline Estimation
11.1 Capital Requirements
11.2 Timelines for Implementation
12. Control vs Risk Trade-Off
12.1 Ownership vs Partnerships
13. Profitability Outlook
13.1 Breakeven Analysis
13.2 Long-term Sustainability
14. Potential Partner List
14.1 Distributors
14.2 Joint Ventures
14.3 Acquisition Targets
15. Execution Roadmap
15.1 Phased Plan for Market Entry
15.1.1 Market Setup
15.1.2 Market Entry
15.1.3 Growth Acceleration
15.1.4 Scale & Stabilize
15.2 Key Activities and Milestones
15.2.1 Milestone Planning
15.2.2 Activity Tracking
Research Methodology
Phase 1: Approach1
Desk Research
- Analysis of market reports from industry associations and trade publications
- Review of consumer behavior studies and coffee consumption trends in Europe
- Examination of import/export data and market entry regulations for coffee machines
Primary Research
- Interviews with product managers at leading coffee machine manufacturers
- Surveys targeting coffee shop owners and baristas to understand usage patterns
- Focus groups with consumers to gauge preferences and brand perceptions
Validation & Triangulation
- Cross-validation of findings through multiple data sources, including sales data and consumer surveys
- Triangulation of insights from industry experts and market analysts
- Sanity checks through expert panel discussions to ensure data reliability
Phase 2: Market Size Estimation1
Top-down Assessment
- Estimation of total market size based on overall coffee consumption in Europe
- Segmentation by coffee machine types, including espresso, drip, and single-serve
- Incorporation of growth rates from historical data and market trends
Bottom-up Modeling
- Collection of sales data from major retailers and online platforms
- Estimation of average selling prices across different coffee machine categories
- Volume estimates based on production data from manufacturers and import statistics
Forecasting & Scenario Analysis
- Utilization of time series analysis to project future market growth
- Scenario modeling based on economic indicators and consumer spending patterns
- Development of best-case, worst-case, and most-likely market scenarios through 2030
Phase 3: CATI Sample Composition1
| Scope Item/Segment | Sample Size | Target Respondent Profiles |
|---|---|---|
| Residential Coffee Machine Users | 120 | Homeowners, Coffee Enthusiasts |
| Commercial Coffee Machine Users | 90 | Café Owners, Restaurant Managers |
| Retail Buyers of Coffee Machines | 60 | Retail Managers, Purchasing Agents |
| Online Coffee Machine Shoppers | 50 | E-commerce Managers, Digital Marketing Specialists |
| Industry Experts and Analysts | 40 | Market Analysts, Industry Consultants |
Frequently Asked Questions
What is the current value of the Europe Coffee Machine Market?
The Europe Coffee Machine Market is valued at approximately USD 5.2 billion, reflecting a significant growth driven by the increasing demand for premium coffee experiences and the rise of specialty coffee culture among consumers.
Which countries dominate the Europe Coffee Machine Market?
What are the key trends in the Europe Coffee Machine Market?
How has the COVID-19 pandemic affected coffee machine sales in Europe?
Other Regional/Country Reports
Why Buy From Us?

What makes us stand out is that our consultants follow Robust, Refine and Result (RRR) methodology. Robust for clear definitions, approaches and sanity checking, Refine for differentiating respondents' facts and opinions, and Result for presenting data with story.

We have set a benchmark in the industry by offering our clients with syndicated and customized market research reports featuring coverage of entire market as well as meticulous research and analyst insights.

While we don't replace traditional research, we flip the method upside down. Our dual approach of Top Bottom & Bottom Top ensures quality deliverable by not just verifying company fundamentals but also looking at the sector and macroeconomic factors.

With one step in the future, our research team constantly tries to show you the bigger picture. We help with some of the tough questions you may encounter along the way: How is the industry positioned? Best marketing channel? KPI's of competitors? By aligning every element, we help maximize success.

Our report gives you instant access to the answers and sources that other companies might choose to hide. We elaborate each steps of research methodology we have used and showcase you the sample size to earn your trust.

If you need any support, we are here! We pride ourselves on universe strength, data quality, and quick, friendly, and professional service.