About the Report
Base Year 2024Listen to the audio summary
Global Fast Food Quick Services Restaurants Market Overview
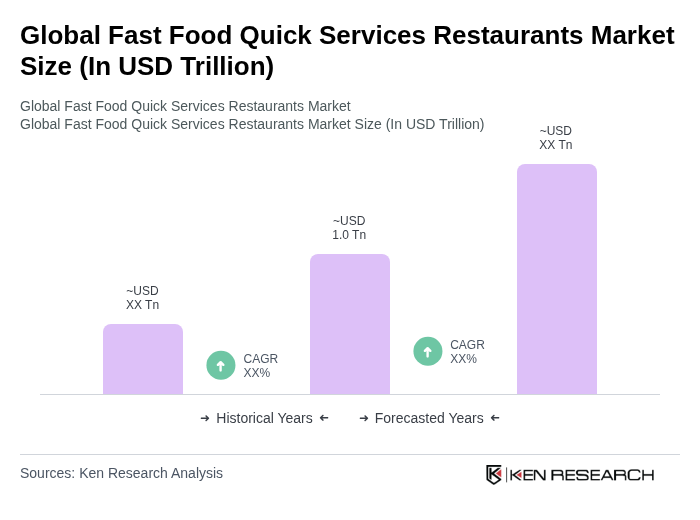
- The Global Fast Food Quick Services Restaurants Market is valued at USD 1.0 trillion, based on a five?year historical analysis. This growth is primarily driven by increasing demand for convenience, rapid urbanization, higher participation of women in the workforce, and the rising trend of on-the-go eating, particularly among younger and working populations. The market has seen a pronounced shift towards digital ordering, mobile apps, and third?party delivery platforms, with contactless payment and loyalty programs becoming essential tools for consumer engagement and retention worldwide.
- Key players in this market include the United States, China, and India, which dominate due to their large populations, fast-paced lifestyles, and a growing urban middle class that increasingly spends on out?of?home food and convenience dining. The U.S. is a pioneer and the single largest national market, accounting for roughly one?quarter to one?third of global fast food and QSR revenues, supported by extensive chain penetration and mature drive?thru and delivery infrastructure. China and India are experiencing rapid growth in consumer spending and urbanization, with rising smartphone adoption and food delivery apps further accelerating demand for quick?service dining options in tier?1 and tier?2 cities.
- In the United States, federal and state authorities continue to strengthen food safety and nutrition disclosure requirements for quick service and fast food restaurants, building on regulations such as the Food Safety Modernization Act (FSMA) issued by the U.S. Food and Drug Administration in 2011 and the nationwide menu labeling provisions under Section 4205 of the Affordable Care Act implemented by the U.S. Food and Drug Administration in 2018, which require chains with 20 or more locations to provide clear calorie and nutritional information at the point of sale and to maintain robust food safety plans and preventive controls. These frameworks, alongside ongoing updates to the Food Code and state-level health regulations, require restaurants to adhere to stricter hygiene practices, time?temperature controls, and transparent nutrition labeling, ensuring that public health is prioritized while supporting the high?volume, fast?paced nature of QSR operations.
Global Fast Food Quick Services Restaurants Market Segmentation
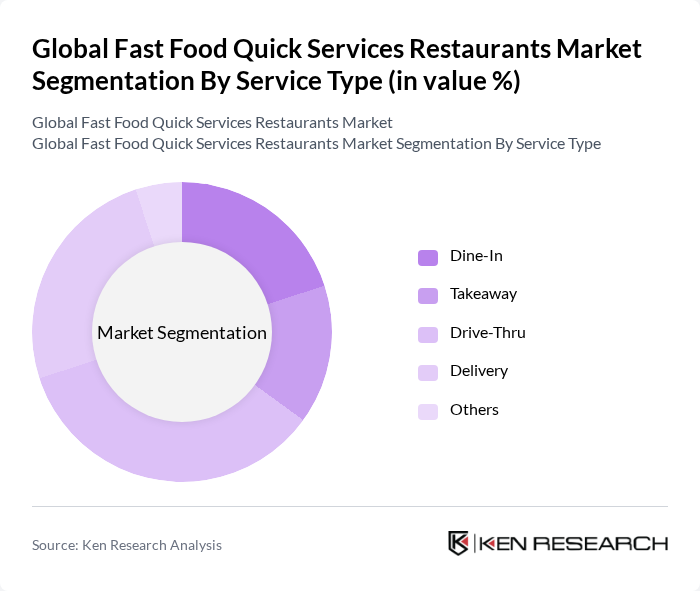
By Service Type:The service type segmentation includes various methods through which consumers can access fast food offerings. The primary subsegments are Dine-In, Takeaway, Drive-Thru, Delivery, and Others. Drive?Thru and other limited?service formats collectively account for the largest share of fast food sales globally, reflecting consumer preference for speed and convenience, especially in markets such as North America where drive?thru penetration is high. The Drive?Thru segment has gained significant traction as it allows customers to order and receive food without leaving their vehicles, a model reinforced during the pandemic and now embedded as a core access channel in suburban and highway locations. The Delivery segment has also seen substantial growth worldwide, supported by aggregator platforms and brand?owned apps, as consumers increasingly prefer the convenience of having food delivered to their homes or workplaces, with many chains optimizing menus and packaging specifically for off?premise and delivery occasions.
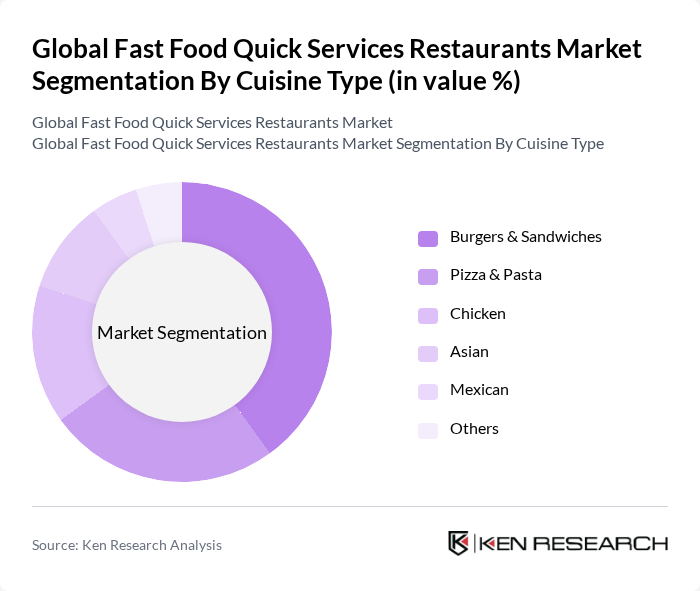
By Cuisine Type:The cuisine type segmentation encompasses various food offerings available in the fast food sector. Key subsegments include Burgers & Sandwiches, Pizza & Pasta, Chicken, Asian, Mexican, and Others. The Burgers & Sandwiches segment remains the dominant category globally, accounting for the largest revenue share among fast food products, supported by strong global brands, standardized formats, and high-frequency consumption occasions. This segment benefits from strong brand loyalty, continuous menu innovation (including plant?based and premium burger offerings), and extensive marketing investments by major chains. The Pizza & Pasta segment is also a major contributor and continues to grow, particularly with the rise of delivery and takeaway?focused models, appealing to families and younger consumers who favor shareable, customizable, and digitally ordered meals.
Global Fast Food Quick Services Restaurants Market Competitive Landscape
The Global Fast Food Quick Services Restaurants Market is characterized by a dynamic mix of regional and international players. Leading participants such as McDonald's, Burger King, KFC, Subway, Domino's Pizza, Wendy's, Taco Bell, Dunkin', Chipotle Mexican Grill, Panera Bread, Papa Johns, Five Guys, Shake Shack, Jimmy John's, Wingstop contribute to innovation, geographic expansion, menu diversification (including healthier and plant?forward options), and enhancements in digital ordering, loyalty ecosystems, and delivery partnerships.
Global Fast Food Quick Services Restaurants Market Industry Analysis
Growth Drivers
- Increasing Urbanization:Urbanization is a significant driver for the fast food quick service restaurant sector, with the United Nations projecting that by future, 56.5% of the global population will reside in urban areas. This shift leads to higher foot traffic and demand for quick meal options. In cities, the convenience of fast food aligns with the busy lifestyles of urban dwellers, contributing to an estimated increase in fast food consumption by 3.6 million meals per day in metropolitan areas.
- Rising Disposable Incomes:As disposable incomes rise, particularly in developing regions, consumers are more willing to spend on dining out. According to the World Bank, global GDP per capita is expected to reach $13,000 in future, facilitating increased spending on fast food. This trend is particularly evident in Asia-Pacific, where a 10% increase in disposable income correlates with a 7.5% rise in fast food sales, indicating a strong link between income growth and fast food consumption.
- Demand for Convenience:The fast-paced lifestyle of modern consumers drives the demand for convenient meal options. A report from the International Food Information Council indicates that 75% of consumers prioritize convenience when choosing meals. In future, the number of fast food outlets is projected to increase by 6% globally, reflecting the growing preference for quick service dining. This trend is particularly strong among millennials and Gen Z, who favor on-the-go meal solutions.
Market Challenges
- Intense Competition:The fast food quick service restaurant market is characterized by fierce competition, with over 210,000 establishments globally. Major players like McDonald's and Burger King dominate, but new entrants and local chains are rapidly emerging. This saturation leads to price wars and reduced profit margins. In future, it is estimated that the average profit margin for fast food restaurants will decline to 5.3%, down from 6.2% in the previous year, highlighting the competitive pressures in the industry.
- Health Regulations:Increasing health regulations pose significant challenges for fast food operators. Governments worldwide are implementing stricter food safety standards and nutritional labeling requirements. For instance, the U.S. FDA's new regulations mandate calorie counts on menus by future, impacting menu design and operational costs. Compliance with these regulations can increase operational expenses by up to 12%, forcing many restaurants to adapt their offerings and marketing strategies to meet consumer health expectations.
Global Fast Food Quick Services Restaurants Market Future Outlook
The future of the fast food quick service restaurant market appears promising, driven by evolving consumer preferences and technological advancements. As health-conscious dining becomes more prevalent, restaurants are likely to innovate their menus to include healthier options. Additionally, the integration of technology, such as mobile ordering and AI-driven customer service, will enhance operational efficiency and customer experience. These trends suggest a dynamic market landscape that will continue to adapt to consumer demands and technological innovations in the coming years.
Market Opportunities
- Expansion into Emerging Markets:Emerging markets present significant growth opportunities for fast food chains. Countries like India and Brazil are experiencing rapid urbanization and rising disposable incomes, with a projected increase in fast food consumption by 22% by future. This expansion can lead to increased market share and revenue for established brands willing to invest in these regions.
- Digital Ordering and Delivery Services:The rise of digital ordering and delivery services is transforming the fast food landscape. By future, it is estimated that online orders will account for 32% of total fast food sales. Investing in robust digital platforms can enhance customer engagement and streamline operations, providing a competitive edge in a rapidly evolving market.
Scope of the Report
| Segment | Sub-Segments |
|---|---|
| By Service Type | Dine-In Takeaway Drive-Thru Delivery Others |
| By Cuisine Type | Burgers & Sandwiches Pizza & Pasta Chicken Asian Mexican Others |
| By Ownership / Restaurant Type | Independent QSRs Chain QSRs |
| By Distribution Channel | Dine-In Takeaway Drive-Thru Online Delivery Platforms Mobile Apps & Direct Digital Channels |
| By Consumer Segment | Millennials & Gen Z Families Working Professionals Others |
| By Pricing Positioning | Value / Budget Mid-Range Premium |
| By Region | North America Europe Asia-Pacific Latin America Middle East & Africa |
Key Target Audience
Investors and Venture Capitalist Firms
Government and Regulatory Bodies (e.g., Food and Drug Administration, Department of Agriculture)
Manufacturers and Producers
Distributors and Retailers
Franchise Owners and Operators
Supply Chain Management Companies
Food Safety and Quality Assurance Organizations
Market Analysts and Industry Experts
Players Mentioned in the Report:
McDonald's
Burger King
KFC
Subway
Domino's Pizza
Wendy's
Taco Bell
Dunkin'
Chipotle Mexican Grill
Panera Bread
Papa Johns
Five Guys
Shake Shack
Jimmy John's
Wingstop
Table of Contents
Market Assessment Phase
1. Executive Summary and Approach
2. Global Fast Food Quick Services Restaurants Market Overview
2.1 Key Insights and Strategic Recommendations
2.2 Global Fast Food Quick Services Restaurants Market Overview
2.3 Definition and Scope
2.4 Evolution of Market Ecosystem
2.5 Timeline of Key Regulatory Milestones
2.6 Value Chain & Stakeholder Mapping
2.7 Business Cycle Analysis
2.8 Policy & Incentive Landscape
3. Global Fast Food Quick Services Restaurants Market Analysis
3.1 Growth Drivers
3.1.1 Increasing Urbanization
3.1.2 Rising Disposable Incomes
3.1.3 Demand for Convenience
3.1.4 Health-Conscious Menu Options
3.2 Market Challenges
3.2.1 Intense Competition
3.2.2 Health Regulations
3.2.3 Supply Chain Disruptions
3.2.4 Changing Consumer Preferences
3.3 Market Opportunities
3.3.1 Expansion into Emerging Markets
3.3.2 Digital Ordering and Delivery Services
3.3.3 Sustainable Practices
3.3.4 Menu Innovation
3.4 Market Trends
3.4.1 Plant-Based Menu Items
3.4.2 Technology Integration
3.4.3 Focus on Sustainability
3.4.4 Health and Wellness Trends
3.5 Government Regulation
3.5.1 Food Safety Standards
3.5.2 Nutritional Labeling Requirements
3.5.3 Labor Laws
3.5.4 Environmental Regulations
4. SWOT Analysis
5. Stakeholder Analysis
6. Porter's Five Forces Analysis
7. Global Fast Food Quick Services Restaurants Market Market Size, 2019-2024
7.1 By Value
7.2 By Volume
7.3 By Average Selling Price
8. Global Fast Food Quick Services Restaurants Market Segmentation
8.1 By Service Type
8.1.1 Dine-In
8.1.2 Takeaway
8.1.3 Drive-Thru
8.1.4 Delivery
8.1.5 Others
8.2 By Cuisine Type
8.2.1 Burgers & Sandwiches
8.2.2 Pizza & Pasta
8.2.3 Chicken
8.2.4 Asian
8.2.5 Mexican
8.2.6 Others
8.3 By Ownership / Restaurant Type
8.3.1 Independent QSRs
8.3.2 Chain QSRs
8.4 By Distribution Channel
8.4.1 Dine-In
8.4.2 Takeaway
8.4.3 Drive-Thru
8.4.4 Online Delivery Platforms
8.4.5 Mobile Apps & Direct Digital Channels
8.5 By Consumer Segment
8.5.1 Millennials & Gen Z
8.5.2 Families
8.5.3 Working Professionals
8.5.4 Others
8.6 By Pricing Positioning
8.6.1 Value / Budget
8.6.2 Mid-Range
8.6.3 Premium
8.7 By Region
8.7.1 North America
8.7.2 Europe
8.7.3 Asia-Pacific
8.7.4 Latin America
8.7.5 Middle East & Africa
9. Global Fast Food Quick Services Restaurants Market Competitive Analysis
9.1 Market Share of Key Players
9.2 Cross Comparison of Key Players
9.2.1 Company Name
9.2.2 Scale (Global, Regional, or Local Player)
9.2.3 Systemwide Sales (Latest FY, USD Million)
9.2.4 Number of Outlets / Restaurants
9.2.5 Average Revenue per Outlet
9.2.6 Same-Store Sales Growth (Like-for-Like %)
9.2.7 EBITDA Margin (%)
9.2.8 Average Ticket Size / Spend per Visit
9.2.9 Digital Order Mix (% of Sales from Digital & Delivery)
9.2.10 Market Share in Key Regions (%)
9.2.11 Franchise vs Company-Owned Mix (%)
9.2.12 Store Expansion Rate (Net New Units per Year)
9.3 SWOT Analysis of Top Players
9.4 Pricing Analysis
9.5 Detailed Profile of Major Companies
9.5.1 McDonald's
9.5.2 Burger King
9.5.3 KFC
9.5.4 Subway
9.5.5 Domino's Pizza
9.5.6 Wendy's
9.5.7 Taco Bell
9.5.8 Dunkin'
9.5.9 Chipotle Mexican Grill
9.5.10 Panera Bread
9.5.11 Papa Johns
9.5.12 Five Guys
9.5.13 Shake Shack
9.5.14 Jimmy John's
9.5.15 Wingstop
10. Global Fast Food Quick Services Restaurants Market End-User Analysis
10.1 Procurement Behavior of Key Ministries
10.1.1 Government Contracts
10.1.2 Bulk Purchasing Trends
10.1.3 Compliance with Health Standards
10.1.4 Others
10.2 Corporate Spend on Infrastructure & Energy
10.2.1 Investment in Technology
10.2.2 Energy Efficiency Initiatives
10.2.3 Infrastructure Development
10.2.4 Others
10.3 Pain Point Analysis by End-User Category
10.3.1 Quality Control Issues
10.3.2 Supply Chain Disruptions
10.3.3 Customer Service Challenges
10.3.4 Others
10.4 User Readiness for Adoption
10.4.1 Technology Adoption Rates
10.4.2 Consumer Feedback Mechanisms
10.4.3 Training and Development Needs
10.4.4 Others
10.5 Post-Deployment ROI and Use Case Expansion
10.5.1 Performance Metrics
10.5.2 Customer Retention Rates
10.5.3 Revenue Growth Post-Implementation
10.5.4 Others
11. Global Fast Food Quick Services Restaurants Market Future Size, 2025-2030
11.1 By Value
11.2 By Volume
11.3 By Average Selling Price
Go-To-Market Strategy Phase
1. Whitespace Analysis + Business Model Canvas
1.1 Market Gaps Identification
1.2 Business Model Development
2. Marketing and Positioning Recommendations
2.1 Branding Strategies
2.2 Product USPs
3. Distribution Plan
3.1 Urban Retail vs Rural NGO Tie-Ups
4. Channel & Pricing Gaps
4.1 Underserved Routes
4.2 Pricing Bands
5. Unmet Demand & Latent Needs
5.1 Category Gaps
5.2 Consumer Segments
6. Customer Relationship
6.1 Loyalty Programs
6.2 After-Sales Service
7. Value Proposition
7.1 Sustainability
7.2 Integrated Supply Chains
8. Key Activities
8.1 Regulatory Compliance
8.2 Branding
8.3 Distribution Setup
9. Entry Strategy Evaluation
9.1 Domestic Market Entry Strategy
9.1.1 Product Mix
9.1.2 Pricing Band
9.1.3 Packaging
9.2 Export Entry Strategy
9.2.1 Target Countries
9.2.2 Compliance Roadmap
10. Entry Mode Assessment
10.1 JV
10.2 Greenfield
10.3 M&A
10.4 Distributor Model
11. Capital and Timeline Estimation
11.1 Capital Requirements
11.2 Timelines
12. Control vs Risk Trade-Off
12.1 Ownership vs Partnerships
13. Profitability Outlook
13.1 Breakeven Analysis
13.2 Long-Term Sustainability
14. Potential Partner List
14.1 Distributors
14.2 JVs
14.3 Acquisition Targets
15. Execution Roadmap
15.1 Phased Plan for Market Entry
15.1.1 Market Setup
15.1.2 Market Entry
15.1.3 Growth Acceleration
15.1.4 Scale & Stabilize
15.2 Key Activities and Milestones
15.2.1 Milestone Tracking
15.2.2 Activity Scheduling
Research Methodology
Phase 1: Approach1
Desk Research
- Analysis of industry reports from global food service associations and market research firms
- Review of financial statements and annual reports from leading fast food chains
- Examination of consumer behavior studies and market trends published in food industry journals
Primary Research
- Interviews with franchise owners and managers of quick service restaurants (QSRs)
- Surveys conducted with consumers to gauge preferences and spending habits in fast food
- Focus groups with industry experts and food service consultants to discuss market dynamics
Validation & Triangulation
- Cross-validation of data through multiple sources including sales data and consumer surveys
- Triangulation of findings from desk research and primary interviews to ensure consistency
- Sanity checks performed by a panel of industry experts to validate market assumptions
Phase 2: Market Size Estimation1
Top-down Assessment
- Estimation of market size based on overall food service industry revenue and growth rates
- Segmentation of the market by geographic regions and consumer demographics
- Incorporation of macroeconomic factors influencing consumer spending in the fast food sector
Bottom-up Modeling
- Collection of sales data from a representative sample of QSRs across various regions
- Estimation of average transaction values and customer footfall in fast food outlets
- Calculation of market size based on aggregate data from individual restaurant performance
Forecasting & Scenario Analysis
- Utilization of time series analysis to project future market trends based on historical data
- Scenario modeling based on potential impacts of economic shifts and health trends on fast food consumption
- Development of best-case, worst-case, and most-likely scenarios through 2030
Phase 3: CATI Sample Composition1
| Scope Item/Segment | Sample Size | Target Respondent Profiles |
|---|---|---|
| Consumer Preferences in Fast Food | 150 | Regular Fast Food Consumers, Age 18-45 |
| Franchise Operations Insights | 120 | Franchise Owners, Restaurant Managers |
| Market Trends and Innovations | 80 | Food Industry Analysts, Trend Forecasters |
| Health and Nutrition Perspectives | 70 | Nutritionists, Health-Conscious Consumers |
| Impact of Technology on QSRs | 90 | IT Managers, Digital Marketing Specialists |
Frequently Asked Questions
What is the current value of the Global Fast Food Quick Services Restaurants Market?
The Global Fast Food Quick Services Restaurants Market is valued at approximately USD 1.0 trillion, reflecting significant growth driven by urbanization, convenience demands, and changing consumer lifestyles, particularly among younger populations.
Which countries dominate the Global Fast Food Quick Services Restaurants Market?
What are the primary service types in the fast food quick service restaurant market?
How has urbanization impacted the fast food quick service restaurant market?
Other Regional/Country Reports
Indonesia Fast Food Quick Services Restaurants Market
Malaysia Fast Food Quick Services Restaurants Market
KSA Fast Food Quick Services Restaurants Market
APAC Fast Food Quick Services Restaurants Market
SEA Fast Food Quick Services Restaurants Market
Vietnam Fast Food Quick Services Restaurants Market
Other Adjacent Reports
Vietnam Fast Casual Restaurants Market
South Korea Food Delivery Services Market
South Korea Digital Ordering Platforms Market
KSA Plant-Based Food Market
Germany Convenience Food Market
Vietnam Snack Food MarketBeverage CAN MarketKSA food packaging market size, share, growth drivers, trends, opportunities & forecast 2025–2030Kuwait Restaurant Technology Market
APAC cloud kitchen market size, share, growth drivers, trends, opportunities & forecast 2025–2030Why Buy From Us?

What makes us stand out is that our consultants follow Robust, Refine and Result (RRR) methodology. Robust for clear definitions, approaches and sanity checking, Refine for differentiating respondents' facts and opinions, and Result for presenting data with story.

We have set a benchmark in the industry by offering our clients with syndicated and customized market research reports featuring coverage of entire market as well as meticulous research and analyst insights.

While we don't replace traditional research, we flip the method upside down. Our dual approach of Top Bottom & Bottom Top ensures quality deliverable by not just verifying company fundamentals but also looking at the sector and macroeconomic factors.

With one step in the future, our research team constantly tries to show you the bigger picture. We help with some of the tough questions you may encounter along the way: How is the industry positioned? Best marketing channel? KPI's of competitors? By aligning every element, we help maximize success.

Our report gives you instant access to the answers and sources that other companies might choose to hide. We elaborate each steps of research methodology we have used and showcase you the sample size to earn your trust.

If you need any support, we are here! We pride ourselves on universe strength, data quality, and quick, friendly, and professional service.