About the Report
Base Year 2024Indonesia Chemical Protective Clothing Market Overview
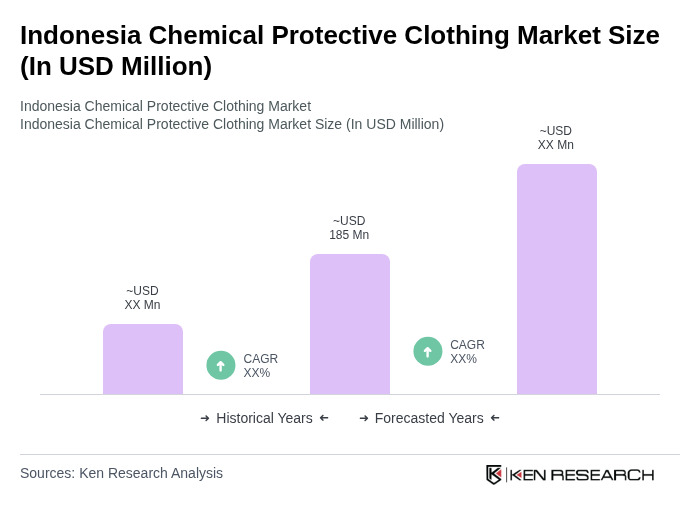
- The Indonesia Chemical Protective Clothing Market is valued at approximately USD 185 million, driven by the increasing awareness of workplace safety and stringent regulations regarding employee protection in hazardous environments. The growth is further supported by the rising industrial activities, particularly in sectors such as oil and gas, manufacturing, and healthcare, which necessitate the use of protective clothing to mitigate risks associated with chemical exposure.
- Key regions dominating the market include Java, Sumatra, and Kalimantan. Java, being the economic hub, has a high concentration of industries that require chemical protective clothing. Sumatra and Kalimantan are significant due to their oil and gas exploration activities, which demand specialized protective gear to ensure worker safety in hazardous conditions.
- Indonesia enforces the Occupational Safety and Health (OSH) Act issued by the Ministry of Manpower, which mandates that all industries adhere to strict safety standards, including the provision of appropriate chemical protective clothing for workers. This regulation establishes compliance requirements for hazardous work environments, requiring employers to conduct risk assessments and provide suitable protective equipment based on identified chemical hazards. The framework aims to enhance workplace safety and reduce incidents related to chemical exposure, thereby driving the demand for protective clothing in various sectors.
Indonesia Chemical Protective Clothing Market Segmentation
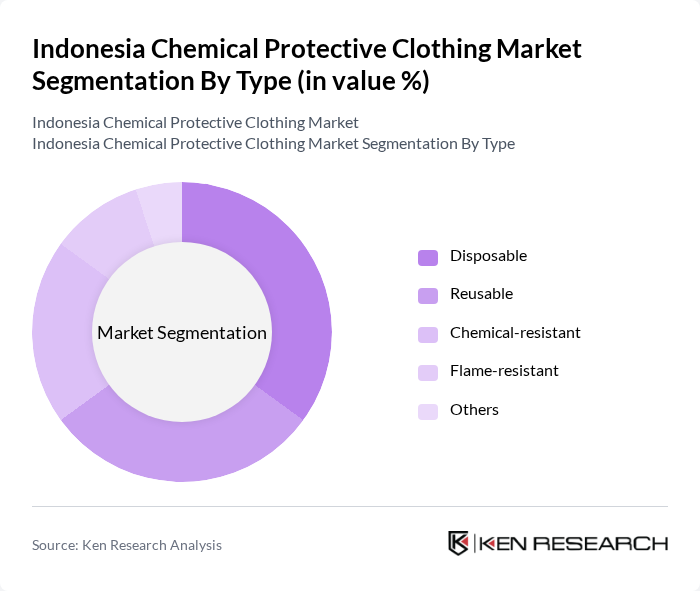
By Type:The market is segmented into various types of chemical protective clothing, including disposable, reusable, chemical-resistant, flame-resistant, and others. Among these, disposable protective clothing is gaining traction due to its convenience and cost-effectiveness, especially in industries where contamination is a significant concern. Reusable clothing is also popular, particularly in sectors that prioritize sustainability and long-term cost savings. The demand for chemical-resistant and flame-resistant clothing is driven by stringent safety regulations and the need for specialized protection in hazardous environments.
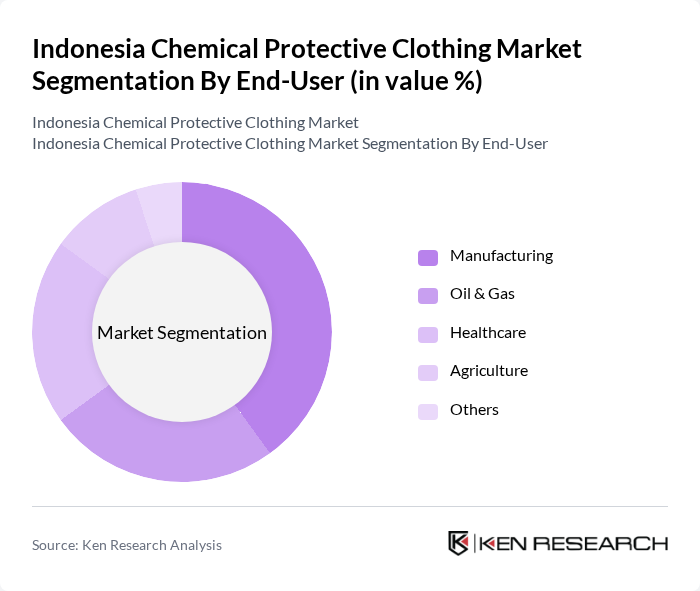
By End-User:The end-user segmentation includes manufacturing, oil & gas, healthcare, agriculture, and others. The manufacturing sector is the largest consumer of chemical protective clothing, driven by the need for safety in environments where workers are exposed to hazardous materials. The oil & gas industry follows closely, requiring specialized protective gear due to the high-risk nature of its operations. The healthcare sector also contributes significantly, especially in the context of infection control and safety during medical procedures.
Indonesia Chemical Protective Clothing Market Competitive Landscape
The Indonesia Chemical Protective Clothing Market is characterized by a dynamic mix of regional and international players. Leading participants such as DuPont de Nemours, Inc., 3M Company, Honeywell International Inc., Ansell Limited, Lakeland Industries, Inc., MCR Safety, Protective Industrial Products, Inc., R.S. Hughes Company, Inc., Kimberly-Clark Corporation, Delta Plus Group, Sioen Industries, Cintas Corporation, Medline Industries, Inc., Uvex Safety Group, Ballyclare Limited contribute to innovation, geographic expansion, and service delivery in this space.
Indonesia Chemical Protective Clothing Market Industry Analysis
Growth Drivers
- Increasing Industrial Safety Regulations:The Indonesian government has implemented stringent industrial safety regulations, mandating the use of protective clothing in various sectors. In future, the Ministry of Manpower reported that over 60% of industries are now compliant with safety standards, leading to a significant increase in demand for chemical protective clothing. This regulatory push is expected to drive the market, as companies prioritize employee safety to avoid penalties and enhance operational efficiency.
- Rising Awareness of Workplace Safety:There has been a notable increase in awareness regarding workplace safety among Indonesian businesses. According to a future survey by the Indonesian Safety Council, 75% of companies have initiated safety training programs, resulting in a 40% rise in the adoption of protective clothing. This cultural shift towards prioritizing employee well-being is expected to further fuel the demand for chemical protective clothing across various industries, including manufacturing and construction.
- Growth in the Chemical Manufacturing Sector:The chemical manufacturing sector in Indonesia is projected to grow at a rate of 5.5% annually, driven by increased domestic and international demand. In future, the sector is expected to contribute approximately IDR 200 trillion to the national economy. This growth necessitates enhanced safety measures, including the use of chemical protective clothing, thereby creating a robust market for manufacturers and suppliers in the industry.
Market Challenges
- High Cost of Advanced Materials:The use of advanced materials in chemical protective clothing often comes with a high price tag, which can deter small and medium-sized enterprises (SMEs) from investing in quality safety gear. In future, the average cost of high-performance protective clothing is estimated to be around IDR 1.5 million per unit, making it a significant investment for many businesses. This financial barrier limits market penetration and adoption rates among SMEs, which constitute a large portion of the workforce.
- Regulatory Compliance Complexities:Navigating the regulatory landscape in Indonesia can be challenging for companies, particularly those unfamiliar with local laws. In future, over 50% of businesses reported difficulties in understanding and complying with safety regulations related to protective clothing. This complexity can lead to non-compliance, resulting in fines and increased liability, which may discourage companies from investing in necessary protective gear, thereby hindering market growth.
Indonesia Chemical Protective Clothing Market Future Outlook
The future of the Indonesia chemical protective clothing market appears promising, driven by ongoing industrial growth and heightened safety awareness. As companies increasingly adopt eco-friendly materials and smart technologies, the market is likely to witness innovative product developments. Additionally, government initiatives aimed at enhancing workplace safety standards will further bolster demand. The focus on ergonomic designs will also cater to the evolving needs of workers, ensuring that protective clothing is not only safe but also comfortable and functional.
Market Opportunities
- Technological Advancements in Fabric Production:Innovations in fabric technology, such as the development of lightweight, breathable, and durable materials, present significant opportunities for manufacturers. In future, the introduction of smart textiles that monitor environmental conditions is expected to enhance the functionality of protective clothing, attracting more businesses to invest in advanced safety gear.
- Expansion into Emerging Markets:As Indonesia's economy continues to grow, there is a substantial opportunity for chemical protective clothing manufacturers to expand into emerging markets within Southeast Asia. With a projected GDP growth rate of 5.2% in future, neighboring countries are increasingly investing in industrial safety, creating a demand for high-quality protective clothing solutions that Indonesian manufacturers can fulfill.
Scope of the Report
| Segment | Sub-Segments |
|---|---|
| By Type | Disposable Reusable Chemical-resistant Flame-resistant Others |
| By End-User | Manufacturing Oil & Gas Healthcare Agriculture Others |
| By Material | Polyethylene Polyvinyl Chloride (PVC) Nomex Kevlar Others |
| By Distribution Channel | Online Retail Offline Retail Direct Sales Distributors Others |
| By Region | Java Sumatra Kalimantan Sulawesi Others |
| By Application | Chemical Handling Hazardous Waste Management Emergency Response Industrial Cleaning Others |
| By Policy Support | Subsidies for local manufacturers Tax incentives for safety equipment Grants for research and development Others |
Key Target Audience
Investors and Venture Capitalist Firms
Government and Regulatory Bodies (e.g., Ministry of Industry, National Agency for Drug and Food Control)
Manufacturers and Producers
Distributors and Retailers
Industrial Safety Equipment Suppliers
Health and Safety Regulatory Agencies (e.g., Occupational Safety and Health Administration)
Industry Associations (e.g., Indonesian Chemical Industry Association)
Financial Institutions
Players Mentioned in the Report:
DuPont de Nemours, Inc.
3M Company
Honeywell International Inc.
Ansell Limited
Lakeland Industries, Inc.
MCR Safety
Protective Industrial Products, Inc.
R.S. Hughes Company, Inc.
Kimberly-Clark Corporation
Delta Plus Group
Sioen Industries
Cintas Corporation
Medline Industries, Inc.
Uvex Safety Group
Ballyclare Limited
Table of Contents
Market Assessment Phase
1. Executive Summary and Approach
2. Indonesia Chemical Protective Clothing Market Overview
2.1 Key Insights and Strategic Recommendations
2.2 Indonesia Chemical Protective Clothing Market Overview
2.3 Definition and Scope
2.4 Evolution of Market Ecosystem
2.5 Timeline of Key Regulatory Milestones
2.6 Value Chain & Stakeholder Mapping
2.7 Business Cycle Analysis
2.8 Policy & Incentive Landscape
3. Indonesia Chemical Protective Clothing Market Analysis
3.1 Growth Drivers
3.1.1 Increasing industrial safety regulations
3.1.2 Rising awareness of workplace safety
3.1.3 Growth in the chemical manufacturing sector
3.1.4 Expansion of the oil and gas industry
3.2 Market Challenges
3.2.1 High cost of advanced materials
3.2.2 Limited awareness among small enterprises
3.2.3 Regulatory compliance complexities
3.2.4 Competition from low-cost alternatives
3.3 Market Opportunities
3.3.1 Technological advancements in fabric production
3.3.2 Growing demand for customized solutions
3.3.3 Expansion into emerging markets
3.3.4 Increased government spending on safety equipment
3.4 Market Trends
3.4.1 Shift towards eco-friendly materials
3.4.2 Integration of smart technology in protective clothing
3.4.3 Rise in online sales channels
3.4.4 Focus on ergonomic designs
3.5 Government Regulation
3.5.1 Implementation of safety standards (SNI)
3.5.2 Regulations on chemical exposure limits
3.5.3 Mandatory training for safety equipment usage
3.5.4 Incentives for local manufacturing
4. SWOT Analysis
5. Stakeholder Analysis
6. Porter's Five Forces Analysis
7. Indonesia Chemical Protective Clothing Market Market Size, 2019-2024
7.1 By Value
7.2 By Volume
7.3 By Average Selling Price
8. Indonesia Chemical Protective Clothing Market Segmentation
8.1 By Type
8.1.1 Disposable
8.1.2 Reusable
8.1.3 Chemical-resistant
8.1.4 Flame-resistant
8.1.5 Others
8.2 By End-User
8.2.1 Manufacturing
8.2.2 Oil & Gas
8.2.3 Healthcare
8.2.4 Agriculture
8.2.5 Others
8.3 By Material
8.3.1 Polyethylene
8.3.2 Polyvinyl Chloride (PVC)
8.3.3 Nomex
8.3.4 Kevlar
8.3.5 Others
8.4 By Distribution Channel
8.4.1 Online Retail
8.4.2 Offline Retail
8.4.3 Direct Sales
8.4.4 Distributors
8.4.5 Others
8.5 By Region
8.5.1 Java
8.5.2 Sumatra
8.5.3 Kalimantan
8.5.4 Sulawesi
8.5.5 Others
8.6 By Application
8.6.1 Chemical Handling
8.6.2 Hazardous Waste Management
8.6.3 Emergency Response
8.6.4 Industrial Cleaning
8.6.5 Others
8.7 By Policy Support
8.7.1 Subsidies for local manufacturers
8.7.2 Tax incentives for safety equipment
8.7.3 Grants for research and development
8.7.4 Others
9. Indonesia Chemical Protective Clothing Market Competitive Analysis
9.1 Market Share of Key Players
9.2 Cross Comparison of Key Players
9.2.1 Company Name
9.2.2 Group Size (Large, Medium, or Small as per industry convention)
9.2.3 Revenue Growth Rate
9.2.4 Market Penetration Rate
9.2.5 Customer Retention Rate
9.2.6 Product Diversification Index
9.2.7 Pricing Strategy
9.2.8 Brand Recognition Score
9.2.9 Supply Chain Efficiency
9.2.10 Customer Satisfaction Index
9.3 SWOT Analysis of Top Players
9.4 Pricing Analysis
9.5 Detailed Profile of Major Companies
9.5.1 DuPont de Nemours, Inc.
9.5.2 3M Company
9.5.3 Honeywell International Inc.
9.5.4 Ansell Limited
9.5.5 Lakeland Industries, Inc.
9.5.6 MCR Safety
9.5.7 Protective Industrial Products, Inc.
9.5.8 R.S. Hughes Company, Inc.
9.5.9 Kimberly-Clark Corporation
9.5.10 Delta Plus Group
9.5.11 Sioen Industries
9.5.12 Cintas Corporation
9.5.13 Medline Industries, Inc.
9.5.14 Uvex Safety Group
9.5.15 Ballyclare Limited
10. Indonesia Chemical Protective Clothing Market End-User Analysis
10.1 Procurement Behavior of Key Ministries
10.1.1 Ministry of Manpower
10.1.2 Ministry of Health
10.1.3 Ministry of Industry
10.1.4 Ministry of Environment and Forestry
10.2 Corporate Spend on Infrastructure & Energy
10.2.1 Investment in safety equipment
10.2.2 Budget allocation for training
10.2.3 Expenditure on compliance measures
10.2.4 Funding for R&D in protective gear
10.3 Pain Point Analysis by End-User Category
10.3.1 Manufacturing sector challenges
10.3.2 Healthcare sector needs
10.3.3 Oil & Gas industry requirements
10.3.4 Agricultural sector issues
10.4 User Readiness for Adoption
10.4.1 Awareness levels
10.4.2 Training availability
10.4.3 Budget constraints
10.4.4 Regulatory compliance readiness
10.5 Post-Deployment ROI and Use Case Expansion
10.5.1 Measurement of safety improvements
10.5.2 Cost savings analysis
10.5.3 Expansion into new applications
10.5.4 Long-term sustainability assessments
11. Indonesia Chemical Protective Clothing Market Future Size, 2025-2030
11.1 By Value
11.2 By Volume
11.3 By Average Selling Price
Go-To-Market Strategy Phase
1. Whitespace Analysis + Business Model Canvas
1.1 Market gaps identification
1.2 Business model development
2. Marketing and Positioning Recommendations
2.1 Branding strategies
2.2 Product USPs
3. Distribution Plan
3.1 Urban retail vs rural NGO tie-ups
4. Channel & Pricing Gaps
4.1 Underserved routes
4.2 Pricing bands
5. Unmet Demand & Latent Needs
5.1 Category gaps
5.2 Consumer segments
6. Customer Relationship
6.1 Loyalty programs
6.2 After-sales service
7. Value Proposition
7.1 Sustainability
7.2 Integrated supply chains
8. Key Activities
8.1 Regulatory compliance
8.2 Branding
8.3 Distribution setup
9. Entry Strategy Evaluation
9.1 Domestic Market Entry Strategy
9.1.1 Product mix
9.1.2 Pricing band
9.1.3 Packaging
9.2 Export Entry Strategy
9.2.1 Target countries
9.2.2 Compliance roadmap
10. Entry Mode Assessment
10.1 JV
10.2 Greenfield
10.3 M&A
10.4 Distributor Model
11. Capital and Timeline Estimation
11.1 Capital requirements
11.2 Timelines
12. Control vs Risk Trade-Off
12.1 Ownership vs Partnerships
13. Profitability Outlook
13.1 Breakeven analysis
13.2 Long-term sustainability
14. Potential Partner List
14.1 Distributors
14.2 JVs
14.3 Acquisition targets
15. Execution Roadmap
15.1 Phased Plan for Market Entry
15.1.1 Market Setup
15.1.2 Market Entry
15.1.3 Growth Acceleration
15.1.4 Scale & Stabilize
15.2 Key Activities and Milestones
15.2.1 Activity timelines
15.2.2 Milestone tracking
Research Methodology
Phase 1: Approach1
Desk Research
- Analysis of industry reports from Indonesian government agencies and trade associations
- Review of academic journals and publications focusing on chemical safety and protective clothing
- Examination of market trends and forecasts from global chemical industry databases
Primary Research
- Interviews with safety officers in manufacturing and construction sectors
- Surveys targeting procurement managers in chemical and pharmaceutical companies
- Field interviews with end-users of chemical protective clothing in various industries
Validation & Triangulation
- Cross-validation of findings through multiple data sources including trade publications and expert opinions
- Triangulation of market data with insights from industry conferences and seminars
- Sanity checks conducted through expert panel reviews comprising industry veterans
Phase 2: Market Size Estimation1
Top-down Assessment
- Estimation of market size based on national safety regulations and compliance requirements
- Segmentation of the market by end-user industries such as oil & gas, manufacturing, and healthcare
- Incorporation of growth rates from related sectors influencing demand for protective clothing
Bottom-up Modeling
- Collection of sales data from leading manufacturers of chemical protective clothing
- Estimation of market penetration rates based on industry-specific safety standards
- Volume and pricing analysis based on product categories and material types
Forecasting & Scenario Analysis
- Multi-variable forecasting using economic indicators and industry growth trends
- Scenario analysis based on potential regulatory changes and market disruptions
- Development of baseline, optimistic, and pessimistic market projections through 2030
Phase 3: CATI Sample Composition1
| Scope Item/Segment | Sample Size | Target Respondent Profiles |
|---|---|---|
| Manufacturing Sector | 100 | Safety Managers, Production Supervisors |
| Construction Industry | 80 | Site Safety Officers, Project Managers |
| Oil & Gas Sector | 70 | HSE Managers, Operations Directors |
| Healthcare Facilities | 60 | Infection Control Officers, Procurement Specialists |
| Research Laboratories | 50 | Lab Managers, Safety Compliance Officers |
Frequently Asked Questions
What is the current value of the Indonesia Chemical Protective Clothing Market?
The Indonesia Chemical Protective Clothing Market is valued at approximately USD 185 million, driven by increasing workplace safety awareness and stringent regulations regarding employee protection in hazardous environments.
Which regions dominate the Indonesia Chemical Protective Clothing Market?
What are the main types of chemical protective clothing available in Indonesia?
What industries are the largest consumers of chemical protective clothing in Indonesia?
Other Regional/Country Reports
Other Adjacent Reports
South Africa Industrial Safety Gear Market
Egypt Oil and Gas Safety Equipment Market
Germany Manufacturing Protective Apparel Market
Philippines Healthcare Protective Clothing Market
Malaysia Agricultural Safety Wear Market
Japan Flame-Resistant Clothing Market
Malaysia Disposable Protective Gear Market
Singapore Chemical-Resistant Materials Market
Bahrain Workplace Safety Solutions Market
Why Buy From Us?

What makes us stand out is that our consultants follow Robust, Refine and Result (RRR) methodology. Robust for clear definitions, approaches and sanity checking, Refine for differentiating respondents' facts and opinions, and Result for presenting data with story.

We have set a benchmark in the industry by offering our clients with syndicated and customized market research reports featuring coverage of entire market as well as meticulous research and analyst insights.

While we don't replace traditional research, we flip the method upside down. Our dual approach of Top Bottom & Bottom Top ensures quality deliverable by not just verifying company fundamentals but also looking at the sector and macroeconomic factors.

With one step in the future, our research team constantly tries to show you the bigger picture. We help with some of the tough questions you may encounter along the way: How is the industry positioned? Best marketing channel? KPI's of competitors? By aligning every element, we help maximize success.

Our report gives you instant access to the answers and sources that other companies might choose to hide. We elaborate each steps of research methodology we have used and showcase you the sample size to earn your trust.

If you need any support, we are here! We pride ourselves on universe strength, data quality, and quick, friendly, and professional service.