
APAC Syngas Market Outlook to 2030
Region:Afganistan
Author(s):Shubham Kashyap
Product Code:KROD8568
Region:Afganistan
Author(s):Shubham Kashyap
Product Code:KROD8568
December 2024
98
The APAC syngas market is highly competitive, with both multinational and regional players striving for market share through technological innovation, strategic partnerships, and sustainable production practices. Major players are strengthening their positions by enhancing feedstock efficiency and reducing operational costs.
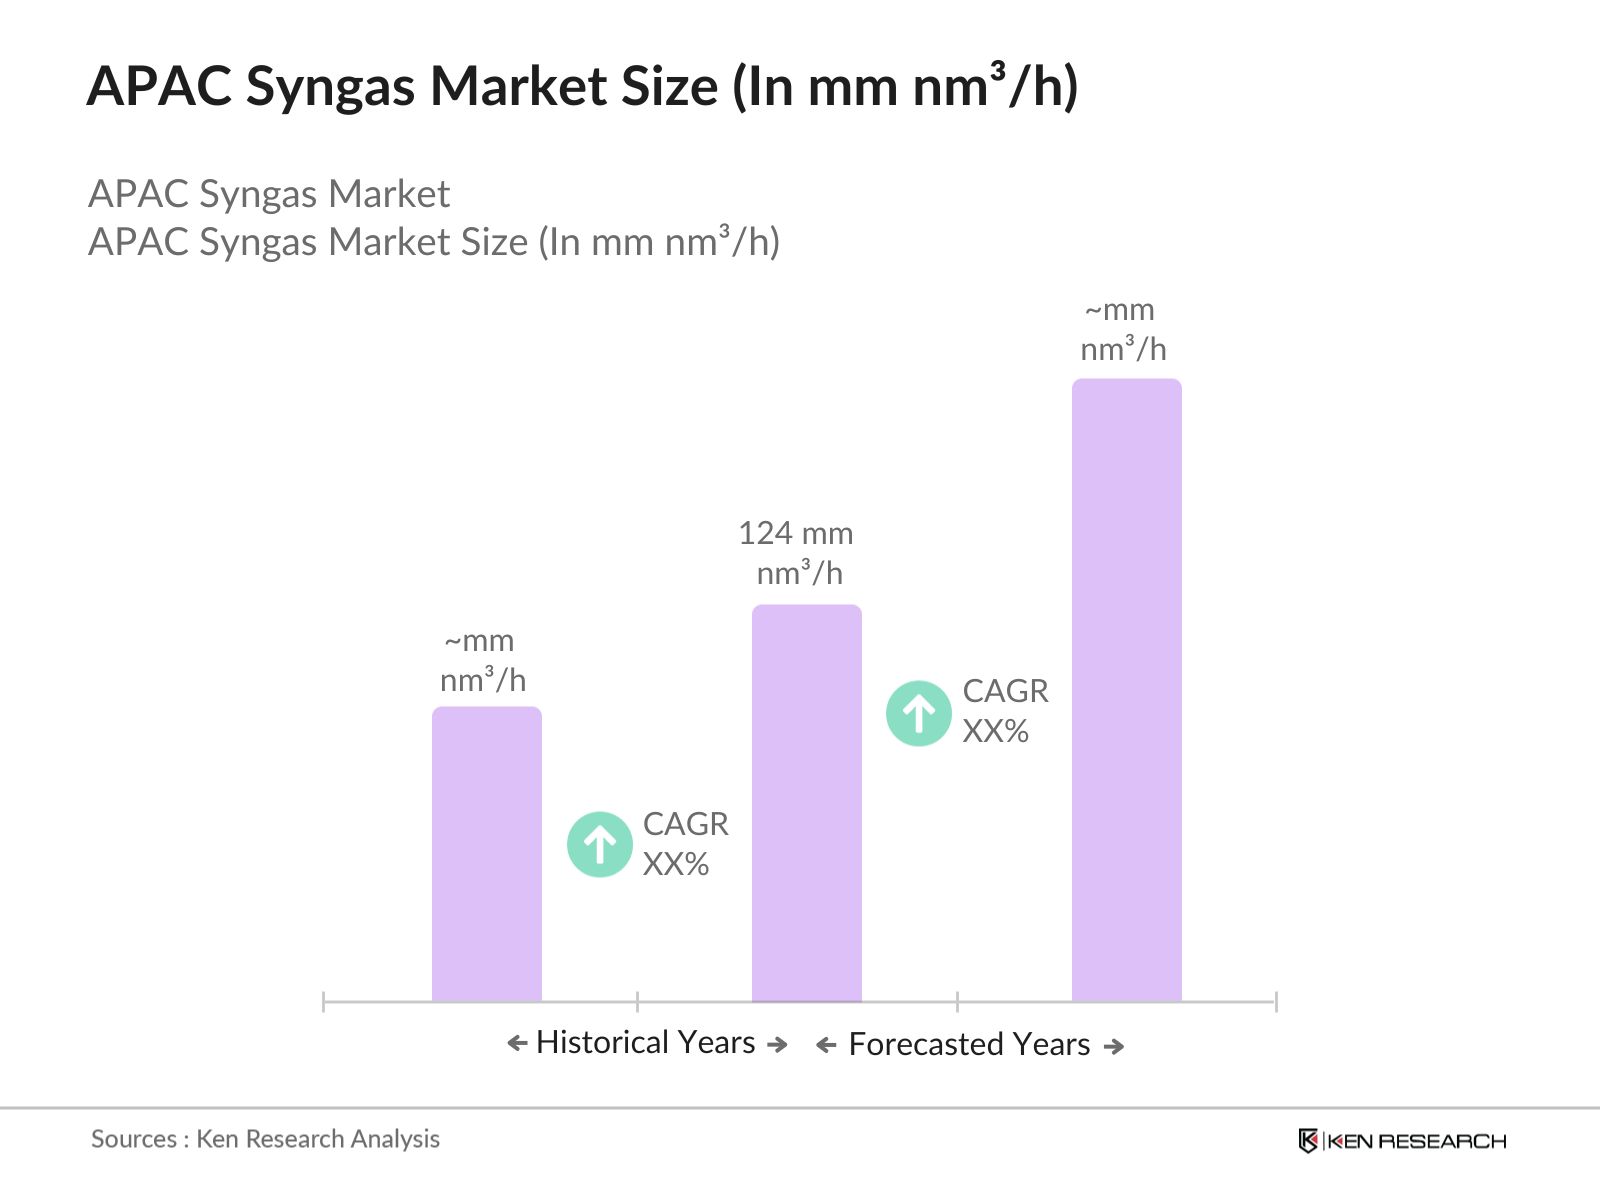
The APAC syngas market is expected to grow steadily, driven by rising investments in clean energy and gasification technologies. Government initiatives and private investments targeting sustainable syngas production will play a pivotal role in the region's transition to alternative fuels. The market is set to witness advancements in gasification processes, increased use of biomass as a feedstock, and the development of integrated syngas facilities for varied industrial applications.
|
By Feedstock |
Coal Natural Gas Biomass Municipal Waste |
|
By Application |
Chemicals (Ammonia, Methanol) Liquid Fuels Power Generation Gaseous Fuels |
|
By Technology |
Steam Reforming Partial Oxidation Autothermal Reforming Biomass Gasification |
|
By End-Use Industry |
Power Chemicals Refining Transportation |
|
By Region |
China India Japan South Korea Rest of the APAC |
1.1 Definition and Scope
1.2 Market Taxonomy
1.3 Syngas Production and Utilization Pathways
1.4 Market Segmentation Overview
2.1 Historical Market Size
2.2 Year-On-Year Growth Analysis
2.3 Key Market Developments and Technological Milestones
3.1 Growth Drivers
3.1.1 Energy Transition and Decarbonization
3.1.2 Demand from Chemicals Industry
3.1.3 Government Investments in Gasification Projects
3.2 Market Challenges
3.2.1 High Capital and Operational Costs
3.2.2 Feedstock Volatility
3.2.3 Regulatory Restrictions
3.3 Opportunities
3.3.1 Green and Blue Hydrogen Production
3.3.2 Carbon Capture and Utilization Integration
3.3.3 Expansion in Renewable Feedstocks
3.4 Trends
3.4.1 Biomass Gasification
3.4.2 Waste-to-Energy Solutions
3.4.3 Increase in Small-Scale Syngas Plants
3.5 Government Regulation
3.5.1 Emission Standards Compliance
3.5.2 Policy Support for Clean Energy Projects
3.5.3 Feedstock Licensing and Permits
3.6 SWOT Analysis
3.7 Value Chain and Stakeholder Ecosystem
3.8 Porters Five Forces
3.9 Competition Ecosystem
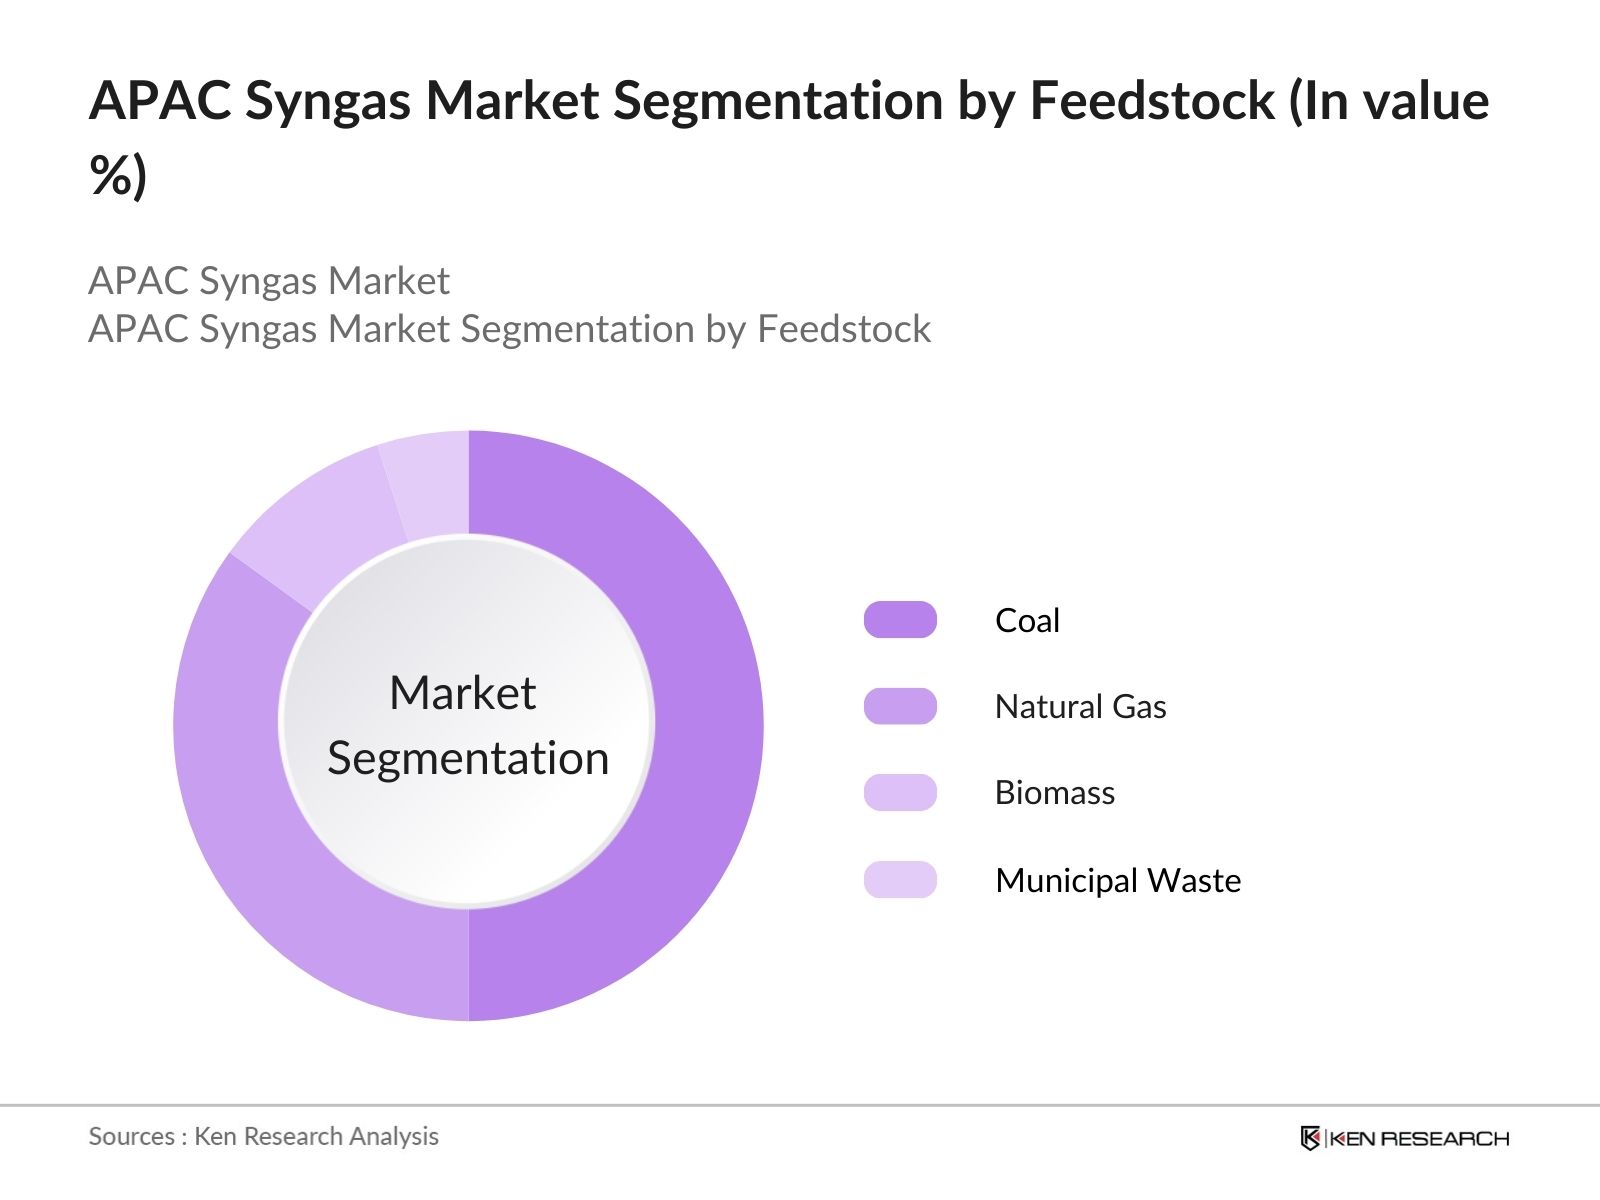
4.1 By Feedstock (In Value %)
4.1.1 Coal
4.1.2 Natural Gas
4.1.3 Biomass
4.1.4 Municipal Waste
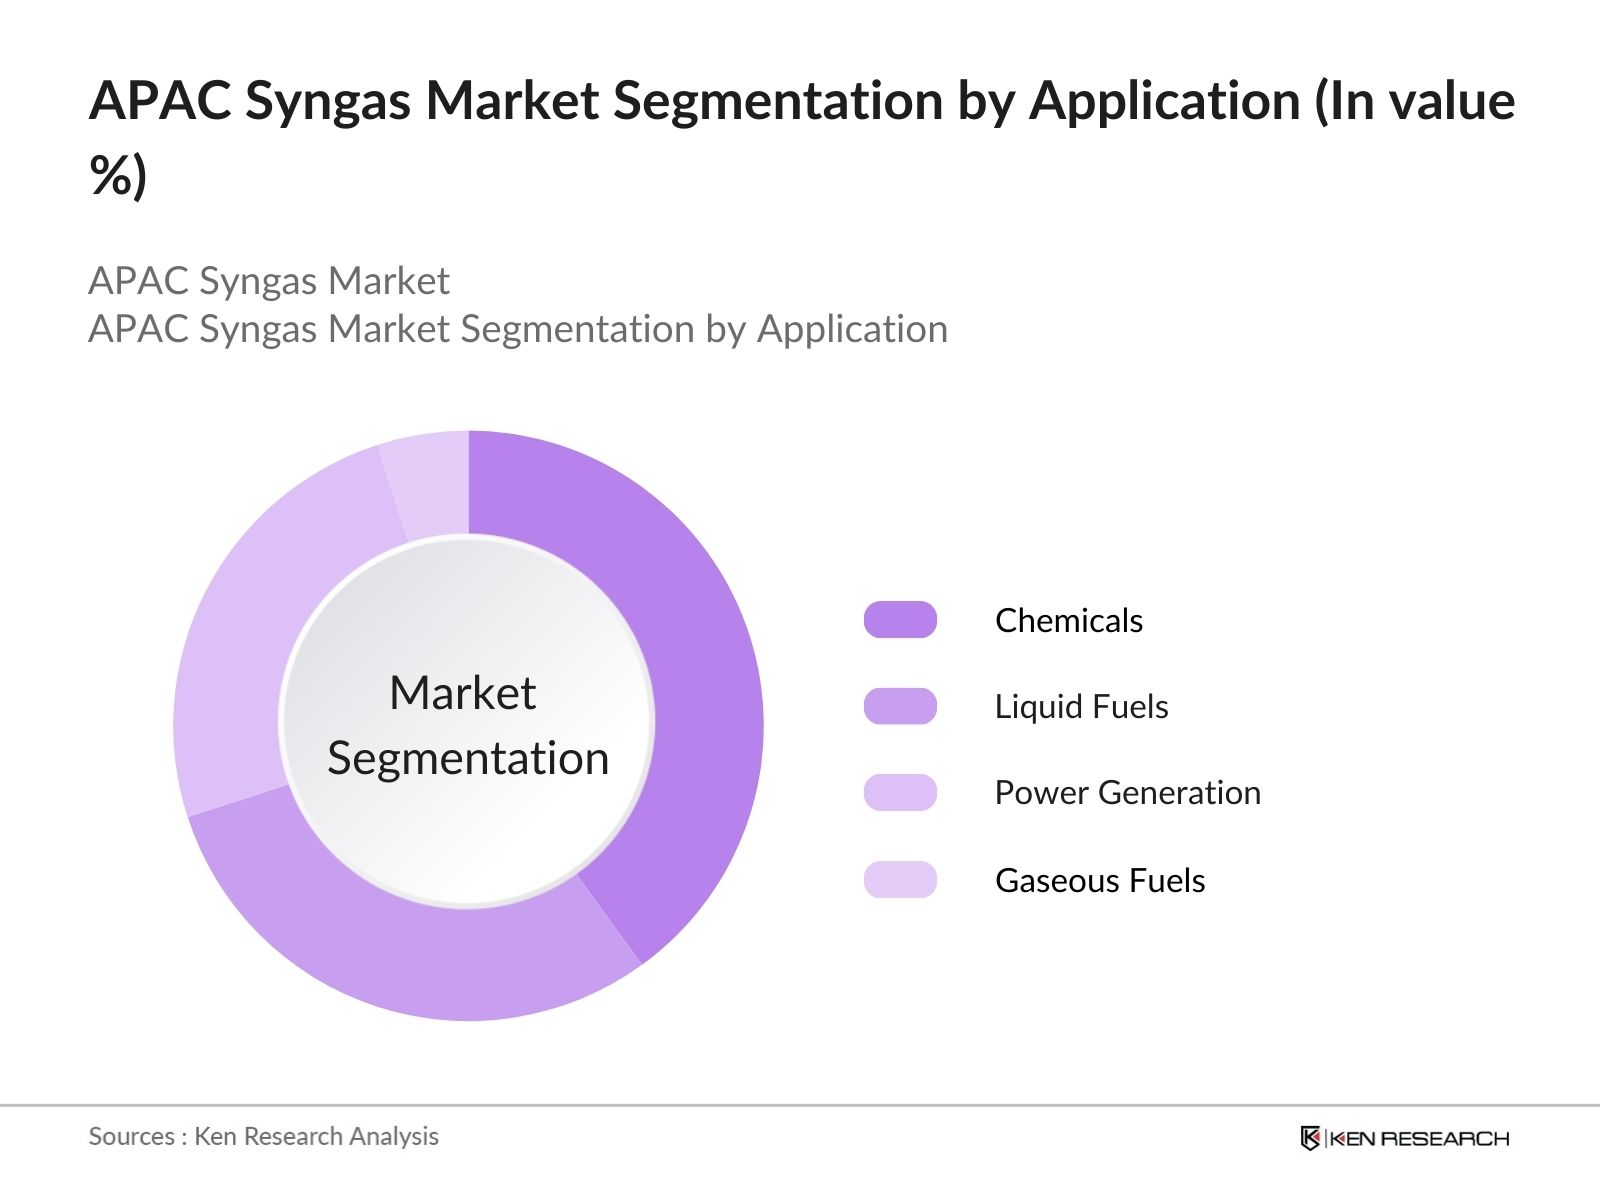
4.2 By Application (In Value %)
4.2.1 Chemicals (Ammonia, Methanol)
4.2.2 Liquid Fuels
4.2.3 Power Generation
4.2.4 Gaseous Fuels
4.3 By Production Technology (In Value %)
4.3.1 Steam Reforming
4.3.2 Partial Oxidation
4.3.3 Autothermal Reforming
4.3.4 Biomass Gasification
4.4 By End-Use Industry (In Value %)
4.4.1 Power
4.4.2 Chemicals
4.4.3 Refining
4.4.4 Transportation
4.5 By Region (In Value %)
4.5.1 China
4.5.2 India
4.5.3 Japan
4.5.4 South Korea
4.5.5 ASEAN Countries
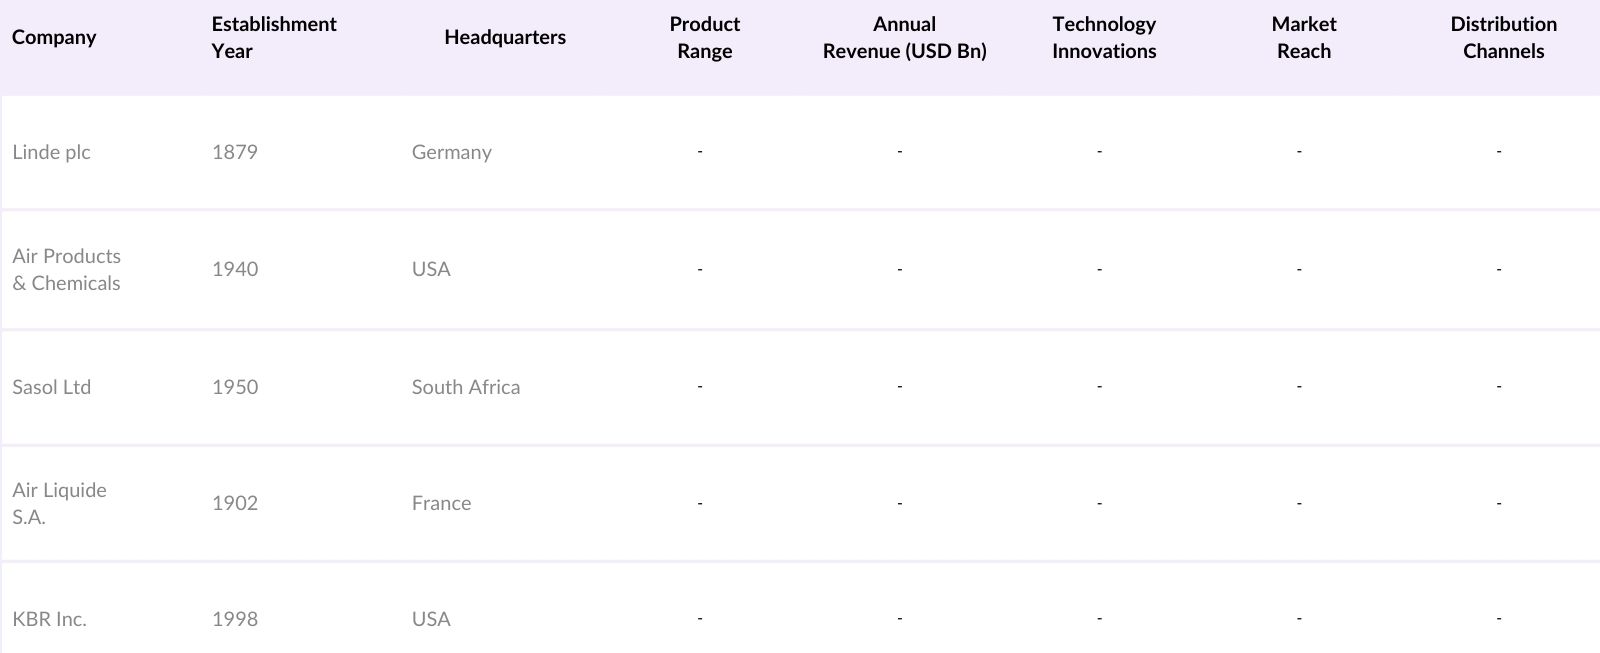
5.1 Detailed Profiles of Major Companies
5.1.1 Linde plc
5.1.2 Air Products and Chemicals, Inc.
5.1.3 Sasol Ltd
5.1.4 Air Liquide S.A.
5.1.5 KBR Inc.
5.1.6 Shell Gas & Power Development B.V.
5.1.7 Mitsubishi Heavy Industries, Ltd.
5.1.8 Reliance Industries Ltd.
5.1.9 John Wood Group PLC
5.1.10 Haldor Topsoe A/S
5.1.11 ThyssenKrupp AG
5.1.12 Siemens AG
5.1.13 GE Power
5.1.14 Synthesis Energy Systems Inc.
5.1.15 Babcock & Wilcox Enterprises, Inc.
5.2 Cross Comparison Parameters (Revenue, Production Capacity, Regional Presence, Technological Advancements, Feedstock Sourcing, Gasification Technology Used, Product Portfolio, Research and Development Investment)
5.3 Market Share Analysis
5.4 Strategic Initiatives
5.5 Mergers and Acquisitions
5.6 Investment Analysis
6.1 Environmental Standards and Compliance
6.2 Feedstock Regulatory Policies
6.3 Carbon Emission Regulations
6.4 Certification and Quality Standards
7.1 Future Market Size Projections
7.2 Key Factors Driving Future Market Growth
8.1 By Feedstock (In Value %)
8.2 By Application (In Value %)
8.3 By Production Technology (In Value %)
8.4 By End-Use Industry (In Value %)
8.5 By Region (In Value %)
8.1 TAM/SAM/SOM Analysis
8.2 Market Expansion Opportunities
8.3 Syngas Integration Strategies
8.4 White Space Opportunity Analysis
Disclaimer Contact Us
Key stakeholders across the APAC Syngas Market are identified, encompassing producers, distributors, and end-users. Initial research focuses on understanding the markets supply-demand dynamics, and relevant variables are defined through in-depth desk research using proprietary and publicly available databases.
Historical data analysis of the APAC Syngas Market includes assessments of production capacity, regional consumption, and technological adoption rates, ensuring data accuracy and reliability for subsequent projections.
Hypotheses on market trends and projections are validated through interviews with industry experts and stakeholders, providing insights into operational, regulatory, and technological factors that influence market behavior.
The final analysis consolidates data from primary and secondary sources, with detailed insights on production methods, market drivers, and consumer preferences. This comprehensive approach ensures that the report provides validated, data-backed conclusions.
The APAC Syngas Market is valued at 124 million metric normal cubic meters per hour (mm nm/h), driven by rising energy demand and government support for alternative fuels.
Key challenges in the APAC Syngas Market include high production costs, feedstock price volatility, and stringent environmental regulations that impact operational flexibility.
Leading players in the APAC Syngas Market include Linde plc, Air Products and Chemicals, Sasol Ltd, Air Liquide S.A., and KBR Inc., each contributing through advanced gasification technologies.
Market growth in the APAC Syngas Market is driven by factors such as government incentives for clean energy, advancements in gasification technologies, and increasing industrial demand for syngas-based chemicals.
 Framework")
What makes us stand out is that our consultants follows Robust, Refine and Result (RRR) methodology. i.e. Robust for clear definitions, approaches and sanity checking, Refine for differentiating respondents facts and opinions and Result for presenting data with story

We have set a benchmark in the industry by offering our clients with syndicated and customized market research reports featuring coverage of entire market as well as meticulous research and analyst insights.

While we don't replace traditional research, we flip the method upside down. Our dual approach of Top Bottom & Bottom Top ensures quality deliverable by not just verifying company fundamentals but also looking at the sector and macroeconomic factors.

With one step in the future, our research team constantly tries to show you the bigger picture. We help with some of the tough questions you may encounter along the way: How is the industry positioned? Best marketing channel? KPI's of competitors? By aligning every element, we help maximize success.

Our report gives you instant access to the answers and sources that other companies might choose to hide. We elaborate each steps of research methodology we have used and showcase you the sample size to earn your trust.

If you need any support, we are here! We pride ourselves on universe strength, data quality, and quick, friendly, and professional service.