
Asia Pacific Amusement Park Market Outlook to 2030
Region:India
Author(s):Shreya
Product Code:KROD10422
Region:India
Author(s):Shreya
Product Code:KROD10422
October 2024
93
The Asia Pacific amusement park market, valued at USD 19.2 billion based on a five-year historical analysis, has experienced robust growth driven by a burgeoning middle class, rising disposable incomes, and the region's rapid urbanization. With increasing interest in recreational activities and family entertainment, theme parks, water parks, and adventure parks have become popular attractions, particularly in countries like China and Japan. The market is further supported by investments in infrastructure, government support for tourism, and significant spending on modern technology for rides and attractions. 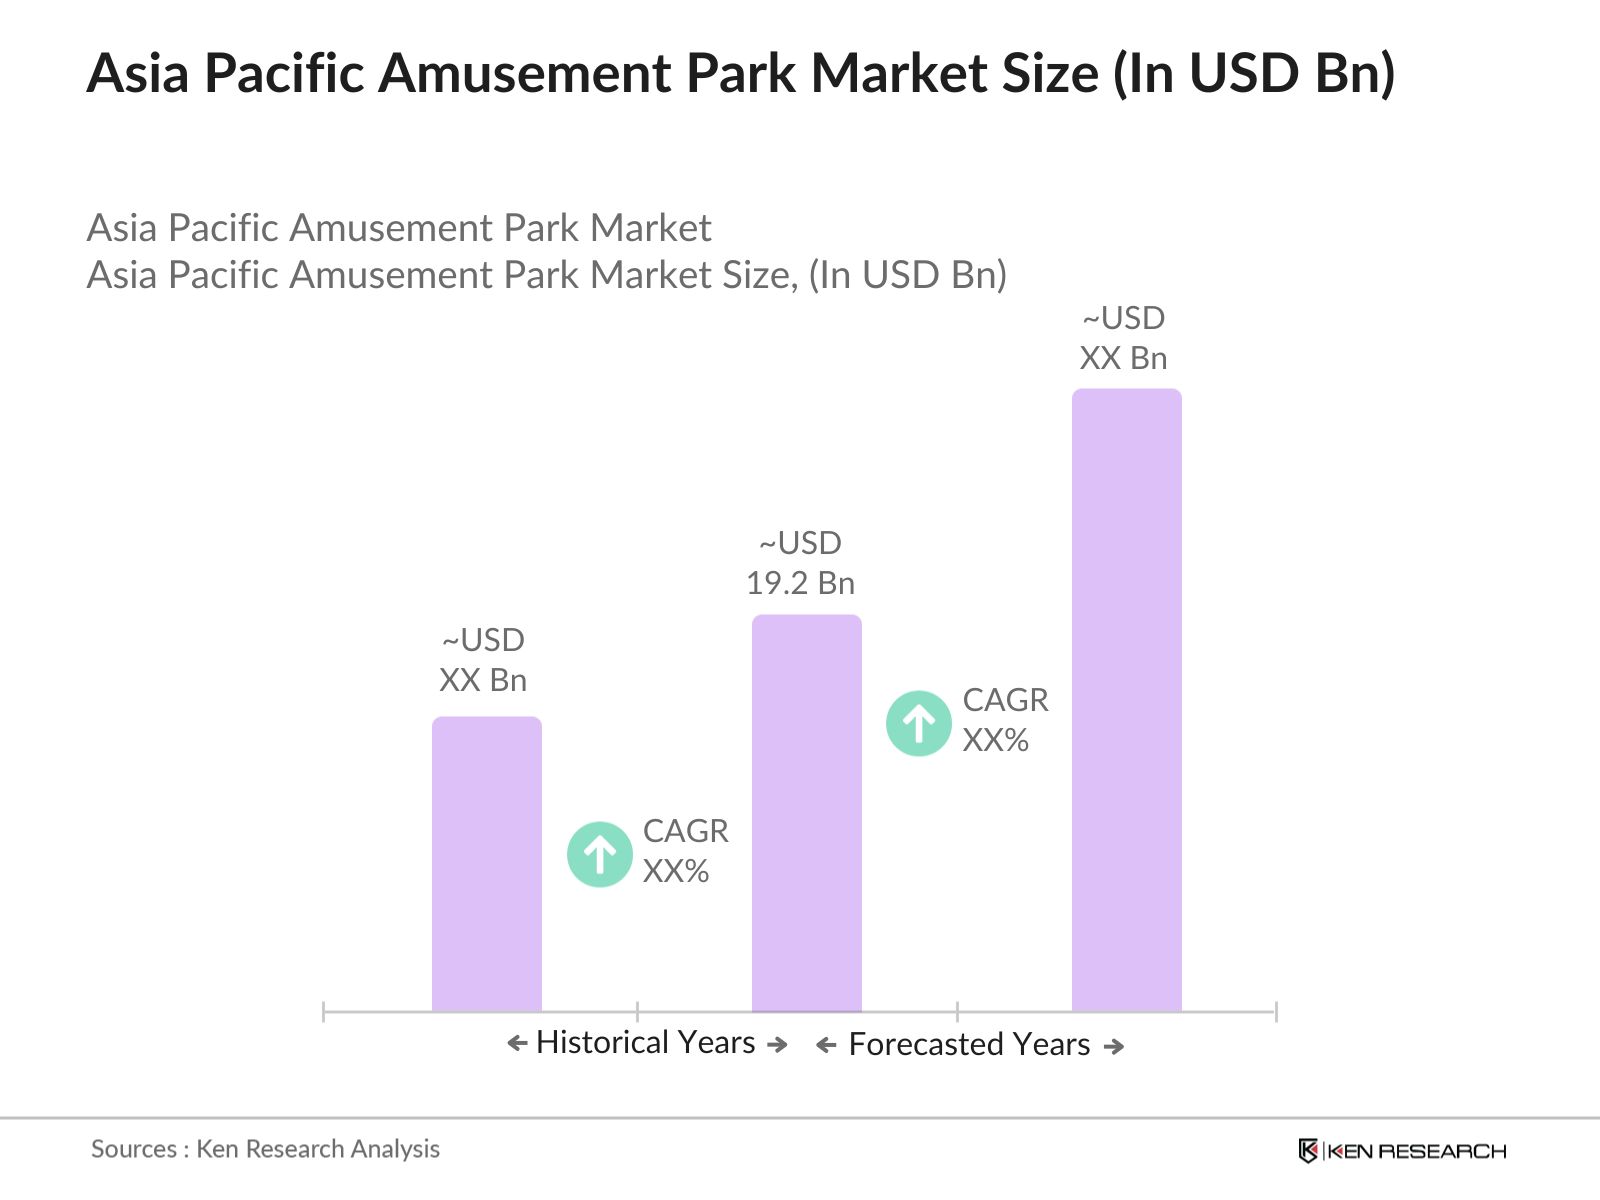
China and Japan dominate the amusement park market within the region due to their large populations, advanced infrastructure, and developed tourism sectors. In China, cities such as Shanghai and Beijing are home to major theme parks like Disneyland and Universal Studios, which draw millions of visitors annually. Japan, with its established parks such as Tokyo Disneyland and Universal Studios Japan, has long been a leader in the market. These countries' strong economies and investment in the tourism and leisure sector give them an edge in attracting both domestic and international visitors.
Safety regulations for amusement parks are stringent across the Asia Pacific region. In 2024, countries like Australia and South Korea implemented new safety laws requiring parks to undergo annual inspections and certification. These measures ensure visitor safety but also increase operational costs for park owners. Compliance with local safety standards is critical for maintaining park licenses and avoiding penalties, making it a key area of focus for operators.
Asia Pacific Amusement Park Market Segmentation
By Park Type: The market is segmented by park type into theme parks, water parks, adventure parks, indoor amusement parks, and pop-up amusement parks. Theme parks dominate the market share within this segmentation due to their large-scale attractions, family-friendly environments, and strong brand affiliations with popular media franchises. Parks like Disneyland and Universal Studios draw millions of visitors every year with their immersive experiences, contributing significantly to overall market revenue. 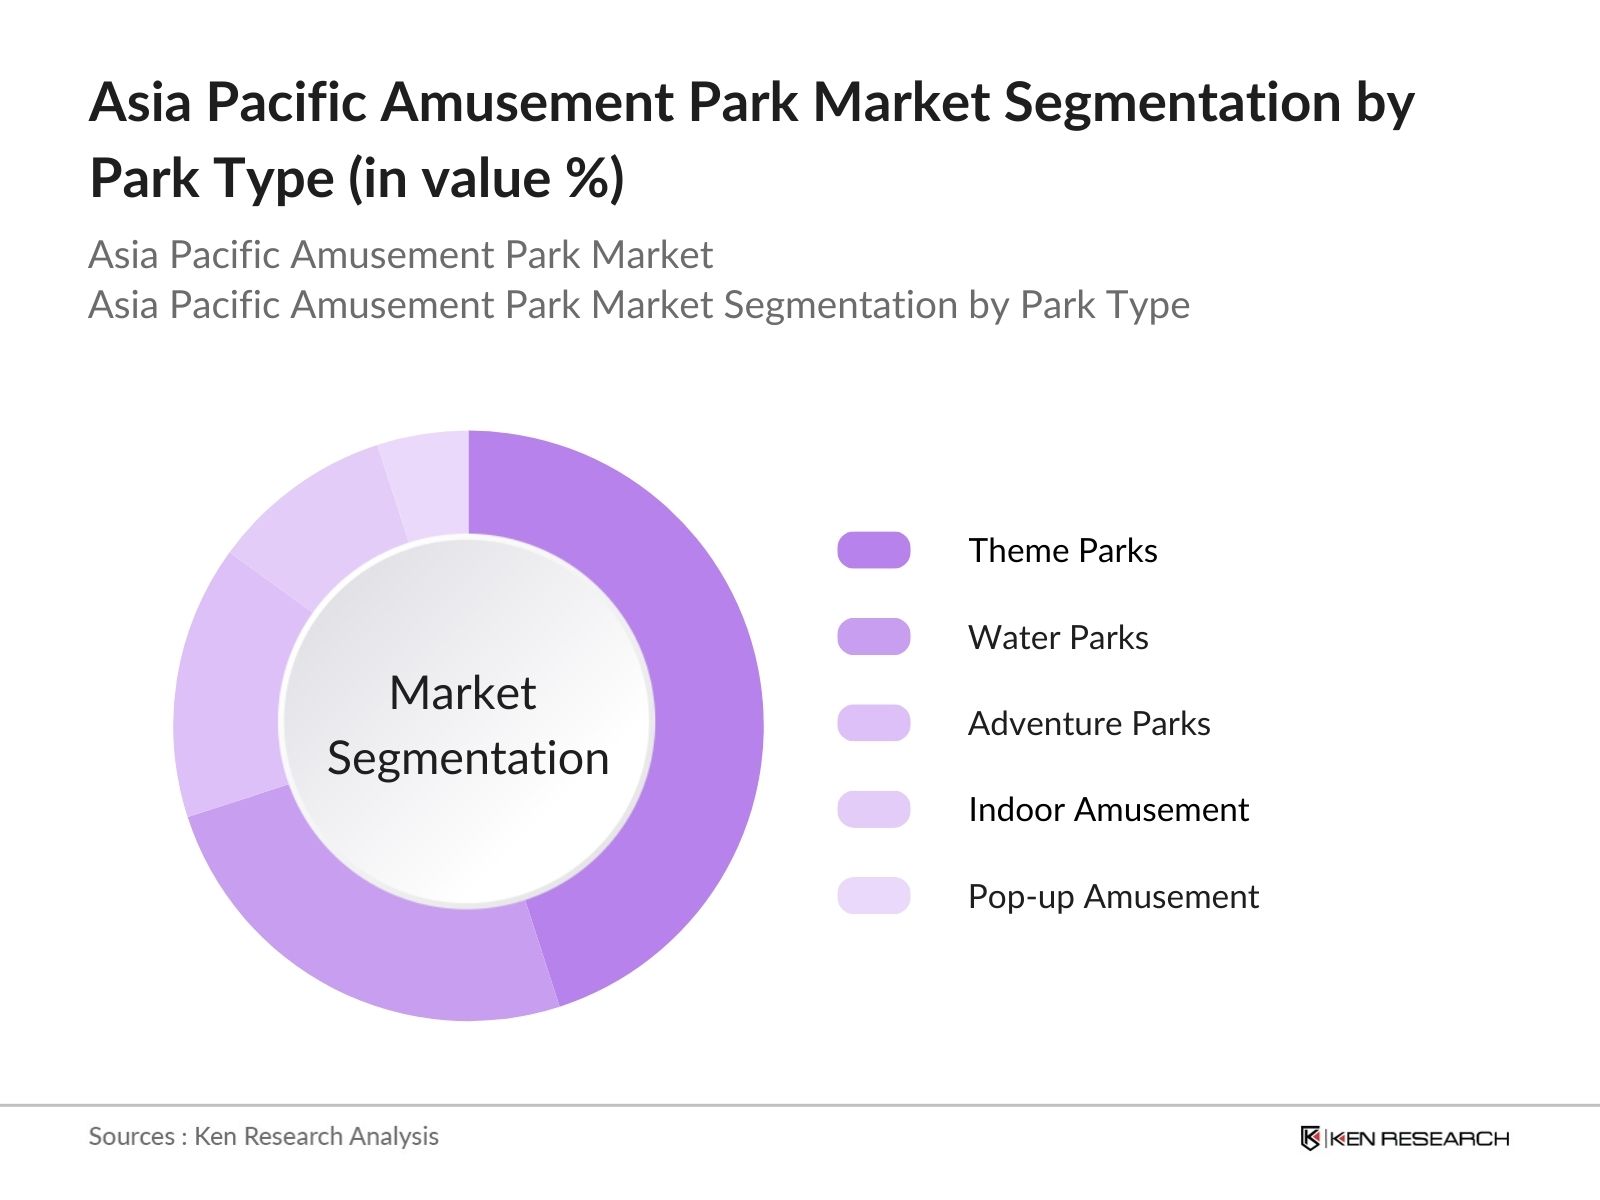
By Visitor Demographics: Visitor demographics play a significant role in this market. The market is divided into families with children, teenagers and young adults, corporate groups, and school excursions. Families with children hold the dominant market share due to the appeal of family-friendly attractions and the growing trend of multigenerational vacations. Theme parks, in particular, have extensive offerings for young children and family-oriented rides and attractions. 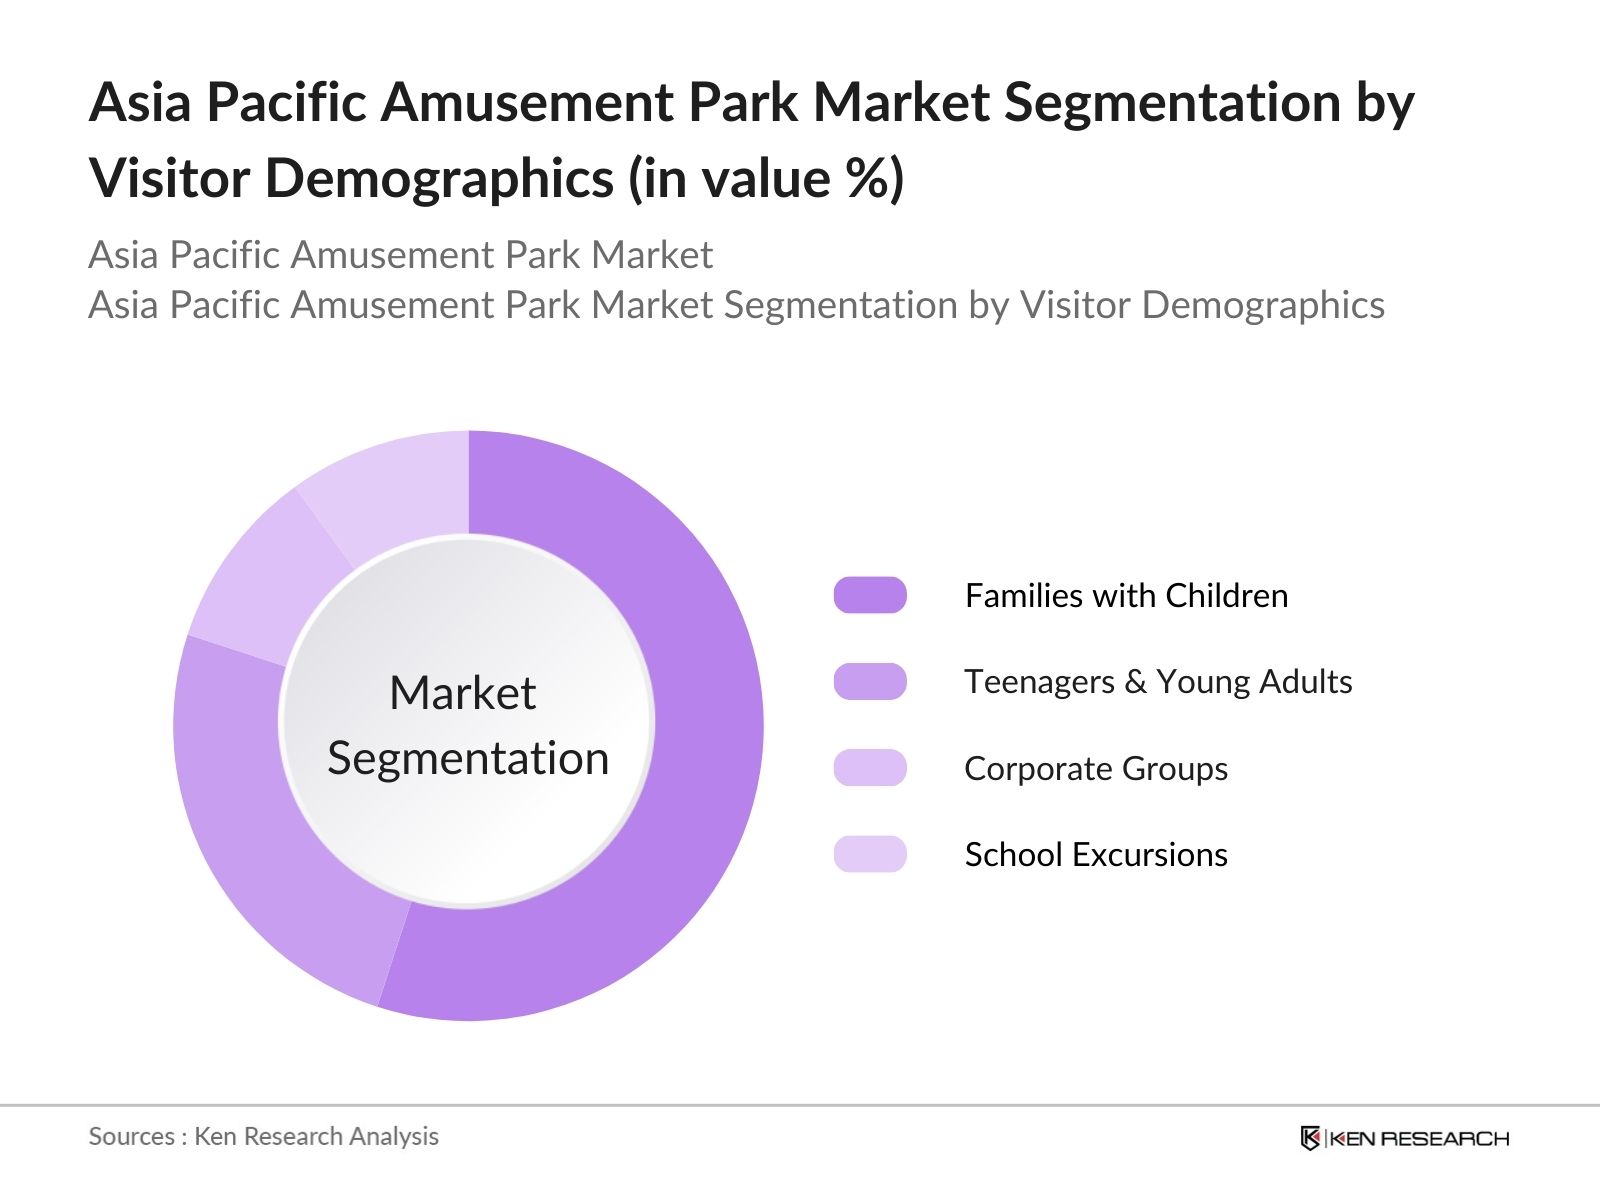
Asia Pacific Amusement Park Market Competitive Landscape
The Asia Pacific amusement park market is dominated by a mix of global and regional players. These companies leverage strong brand associations, large-scale investments, and advanced technological integration to attract millions of visitors annually. The competitive landscape includes both global entertainment giants and local park operators that have developed a niche in their respective markets. The markets competitive dynamics show a high concentration of resources within large, branded theme parks that can afford extensive technological investments and continue expanding their offerings through new attractions and IP-based entertainment.
|
Company |
Establishment Year |
Headquarters |
No. of Parks |
Brand Affiliation |
Revenue (USD) |
Market Presence |
Visitor Footfall (2023) |
Digital Integration |
Sustainability Initiatives |
|
Walt Disney Parks and Resorts |
1955 |
Burbank, California, USA |
|||||||
|
Universal Parks & Resorts |
1964 |
Orlando, Florida, USA |
|||||||
|
Merlin Entertainments |
1999 |
Poole, UK |
|||||||
|
OCT Parks China |
1989 |
Shenzhen, China |
|||||||
|
Haichang Ocean Park Holdings |
2001 |
Shanghai, China |
Asia Pacific Amusement Park Market Analysis
Growth Drivers
Rising Disposable Income: In 2024, the Asia Pacific region has seen significant growth in disposable income, particularly in China, India, and Southeast Asia. For example, the World Bank reports that the GDP per capita in China rose from $12,556 in 2022 to $13,716 in 2024. This increase allows more families to spend on recreational activities, including amusement parks. In India, disposable income grew with a corresponding rise in middle-class spending on leisure, further contributing to amusement park attendance across Tier 1 and Tier 2 cities. This trend is a key driver for the amusement park market.
Increasing Urbanization: Urbanization is expanding rapidly in the Asia Pacific region, with China and India leading in urban growth. As of 2024, Chinas urban population reached 899 million, and India saw a sharp rise to over 500 million people living in urban areas. These urban centers, especially Tier 1 and Tier 2 cities, contribute significantly to the visitor volumes in amusement parks. The migration from rural to urban areas increases the customer base for parks located near major cities such as Shanghai, Delhi, and Bangkok, providing a steady influx of visitors.
Expansion of Tourism Infrastructure: Tourism infrastructure in the Asia Pacific is undergoing substantial upgrades, facilitating easier access to amusement parks. In 2024, the number of international tourist arrivals in the region is projected to hit 320 million, according to the United Nations World Tourism Organization. Major investments in airport expansions, such as the new terminal in Kuala Lumpur and the rapid rail system connecting key tourist areas in Vietnam, have improved connectivity to amusement parks. These infrastructure developments are expected to further support the growth of the amusement park sector.
Market Challenges
High Initial Setup and Operational Costs: The high costs associated with setting up and operating amusement parks remain a significant barrier. In 2024, land prices in prime urban locations across Asia Pacific cities like Tokyo, Seoul, and Singapore average $10,000 per square meter, making it expensive for park developers. Equipment costs, such as state-of-the-art rides, can easily run into tens of millions of dollars, while annual maintenance expenses for large-scale parks average $5 million, further adding to operational burdens.
Seasonal Dependency: Amusement parks in Asia Pacific are highly dependent on seasonal tourist flows, causing revenue fluctuations. For instance, parks in tropical regions like Thailand and Malaysia experience peak attendance during the dry season (November to February), but a significant drop-off occurs during the monsoon season, with some parks reporting a 40% decline in ticket sales during off-peak months. This seasonality presents a challenge for revenue consistency and operational sustainability.
Asia Pacific Amusement Park Market Future Outlook
The Asia Pacific amusement park market is expected to see significant expansion driven by continuous government support for tourism, rising disposable incomes, and an increasing demand for family-oriented entertainment. The introduction of new technologies such as virtual reality rides and mobile-enabled park services will further enhance visitor experiences, allowing parks to cater to the digital-first generation. With increased urbanization in countries like China and India, there will be a growing demand for indoor amusement parks and smaller, mobile-based attractions in densely populated urban centers.
Future Market Opportunities
Growing Popularity of Theme-Based Parks: Theme-based amusement parks are gaining immense popularity in the Asia Pacific region, particularly in China and South Korea. In 2024, theme parks like Universal Studios Beijing saw visitor numbers exceed 10 million annually, driven by attractions based on popular films and characters. With increasing interest in specialized experiences, operators have an opportunity to capture niche markets, particularly among younger demographics who seek immersive, themed entertainment options.
UNWTO Tourism Statistics
Digitalization and Tech Integration: Amusement parks across Asia Pacific are embracing digitalization to enhance visitor experiences and streamline operations. In 2024, smart ticketing solutions have become standard in parks like Hong Kong Disneyland, reducing wait times and improving crowd management. Virtual reality (VR) rides and AI-powered operations are also being implemented, offering more immersive and personalized visitor experiences. This trend is expected to boost park attendance and improve operational efficiency across the region.
|
Segment |
Sub-segment |
|
Park Type |
Theme Parks Water Parks Adventure Parks Indoor Amusement Parks Others |
|
Visitor Demographics |
Families with Children Teenagers and Young Adults Corporate Events School Excursions |
|
Revenue Channel |
Ticket Sales Food & Beverage Merchandise Sales Special Events & Sponsorships |
|
Ride Type |
Roller Coasters Water Rides Interactive Rides Virtual Reality Rides |
|
Region |
East Asia Southeast Asia Oceania South Asia |
Walt Disney Parks and Resorts
1.1. Definition and Scope
1.2. Market Taxonomy
1.3. Market Growth Rate (Average Annual Park Visitors, Revenue per Capita)
1.4. Market Segmentation Overview
2.1. Historical Market Size
2.2. Year-On-Year Growth Analysis
2.3. Key Market Developments and Milestones (Opening of New Parks, Visitor Milestones, Regulatory Updates)
3.1. Growth Drivers
3.1.1. Rising Disposable Income
3.1.2. Increasing Urbanization (Visitor Volume from Tier 1 & Tier 2 Cities)
3.1.3. Expansion of Tourism Infrastructure (Hotels, Connectivity)
3.1.4. Government Initiatives to Boost Tourism
3.2. Market Challenges
3.2.1. High Initial Setup and Operational Costs (Average Cost of Land, Equipment, Maintenance)
3.2.2. Seasonal Dependency (Peak and Off-Season Revenue Variability)
3.2.3. Regulatory and Safety Standards Compliance (Local Government Regulations, Licensing Costs)
3.2.4. Impact of Natural Disasters (Rainy Season, Typhoons)
3.3. Opportunities
3.3.1. Growing Popularity of Theme-Based Parks
3.3.2. Digitalization and Tech Integration (Smart Ticketing, VR Rides, AI-Powered Operations)
3.3.3. Regional Expansion Opportunities (Untapped Regions)
3.3.4. International Collaborations and Joint Ventures
3.4. Trends
3.4.1. Introduction of Eco-Friendly and Sustainable Parks
3.4.2. Rise of Mobile and Pop-Up Amusement Parks
3.4.3. Development of Indoor Amusement Parks in Urban Centers
3.4.4. Incorporation of IP-based Attractions (Movies, Cartoons, Brands)
3.5. Regulatory Framework
3.5.1. Amusement Park Safety Regulations
3.5.2. Environmental Compliance for New Projects
3.5.3. Tourism and Leisure Development Grants
3.5.4. Public-Private Partnerships for Infrastructure Development
3.6. SWOT Analysis
3.7. Stakeholder Ecosystem
3.8. Porters Five Forces Analysis
3.9. Competition Ecosystem (Local vs. International Park Operators)
4.1. By Park Type (In Value %)
4.1.1. Theme Parks
4.1.2. Water Parks
4.1.3. Adventure Parks
4.1.4. Indoor Amusement Parks
4.1.5. Others (Pop-up Amusement Parks, Virtual Amusement Spaces)
4.2. By Visitor Demographics (In Value %)
4.2.1. Families with Children
4.2.2. Teenagers and Young Adults
4.2.3. Corporate and Group Events
4.2.4. School Excursions
4.3. By Revenue Channel (In Value %)
4.3.1. Ticket Sales
4.3.2. Food & Beverage
4.3.3. Merchandise Sales
4.3.4. Special Events and Sponsorships
4.4. By Ride Type (In Value %)
4.4.1. Roller Coasters
4.4.2. Water Rides
4.4.3. Interactive Rides
4.4.4. Virtual Reality Rides
4.5. By Region (In Value %)
4.5.1. East Asia
4.5.2. Southeast Asia
4.5.3. Oceania
4.5.4. South Asia
5.1. Detailed Profiles of Major Companies
5.1.1. Walt Disney Parks and Resorts
5.1.2. Universal Parks & Resorts
5.1.3. Merlin Entertainments
5.1.4. OCT Parks China
5.1.5. Haichang Ocean Park Holdings
5.1.6. Fantawild Holdings Inc.
5.1.7. Parques Reunidos
5.1.8. Tokyo Disneyland
5.1.9. Resorts World Genting
5.1.10. Legoland Malaysia
5.1.11. Sanrio Puroland
5.1.12. Chimelong Group
5.1.13. Dreamworld
5.1.14. Adventure World Japan
5.1.15. Siam Park City
5.2. Cross Comparison Parameters (Visitor Footfall, Revenue, Park Area, Ride Count, Average Ticket Price, Strategic Partnerships, Sustainability Initiatives, Digital Innovation)
5.3. Market Share Analysis
5.4. Strategic Initiatives
5.5. Mergers and Acquisitions
5.6. Investment Analysis
5.7. Venture Capital Funding
5.8. Government Grants
5.9. Private Equity Investments
6.1. Park Construction and Expansion Laws
6.2. Safety and Operational Compliance
6.3. Environmental Sustainability Mandates
6.4. Certification and Licensing Procedures
7.1. Future Market Size Projections
7.2. Key Factors Driving Future Market Growth
8.1. By Park Type (In Value %)
8.2. By Visitor Demographics (In Value %)
8.3. By Revenue Channel (In Value %)
8.4. By Ride Type (In Value %)
8.5. By Region (In Value %)
9.1. TAM/SAM/SOM Analysis
9.2. Customer Cohort Analysis
9.3. Marketing Initiatives
9.4. White Space Opportunity Analysis
The initial phase involves mapping out the key stakeholders in the Asia Pacific amusement park market. This phase is conducted through secondary research and proprietary databases to identify major players, growth drivers, and other variables that impact market performance.
In this step, we analyze historical market data related to amusement park footfall, visitor demographics, and revenue generation across different park types. Data from credible sources such as tourism boards and amusement park operators are cross-referenced to estimate market size accurately.
We validate our findings through direct interviews and consultations with industry experts, including park operators and tourism authorities. This step ensures that our market assumptions are grounded in real-world insights.
The final phase involves synthesizing primary data from amusement park operators with bottom-up analysis techniques. This ensures that our market estimates are robust and reliable, providing comprehensive insights for stakeholders.
The Asia Pacific amusement park market is valued at USD 19.2 billion, driven by increasing urbanization, rising disposable incomes, and the expansion of major theme parks in the region.
The Asia Pacific amusement park market faces challenges such as high operational costs, seasonal fluctuations in visitor numbers, and stringent safety regulations that parks must comply with to operate.
Key players in the Asia Pacific amusement park market include Walt Disney Parks and Resorts, Universal Parks & Resorts, Merlin Entertainments, OCT Parks China, and Haichang Ocean Park Holdings, each with significant visitor footfall and strong brand presence.
Growth in the Asia Pacific amusement park market is driven by rising disposable incomes, increased interest in recreational activities, government support for tourism infrastructure, and technological advancements in ride experiences.
Technology plays a crucial role in enhancing visitor experiences through virtual reality rides, mobile app integrations for park services, and AI-powered operations that streamline park management in the Asia Pacific amusement park market.
 Framework")
What makes us stand out is that our consultants follows Robust, Refine and Result (RRR) methodology. i.e. Robust for clear definitions, approaches and sanity checking, Refine for differentiating respondents facts and opinions and Result for presenting data with story

We have set a benchmark in the industry by offering our clients with syndicated and customized market research reports featuring coverage of entire market as well as meticulous research and analyst insights.

While we don't replace traditional research, we flip the method upside down. Our dual approach of Top Bottom & Bottom Top ensures quality deliverable by not just verifying company fundamentals but also looking at the sector and macroeconomic factors.

With one step in the future, our research team constantly tries to show you the bigger picture. We help with some of the tough questions you may encounter along the way: How is the industry positioned? Best marketing channel? KPI's of competitors? By aligning every element, we help maximize success.

Our report gives you instant access to the answers and sources that other companies might choose to hide. We elaborate each steps of research methodology we have used and showcase you the sample size to earn your trust.

If you need any support, we are here! We pride ourselves on universe strength, data quality, and quick, friendly, and professional service.