
Asia Pacific Aviation Fuel Market Outlook to 2030
Region:Asia
Author(s):Naman Rohilla
Product Code:KROD9536
December 2024
82
About the Report
Asia Pacific Aviation Fuel Market Overview
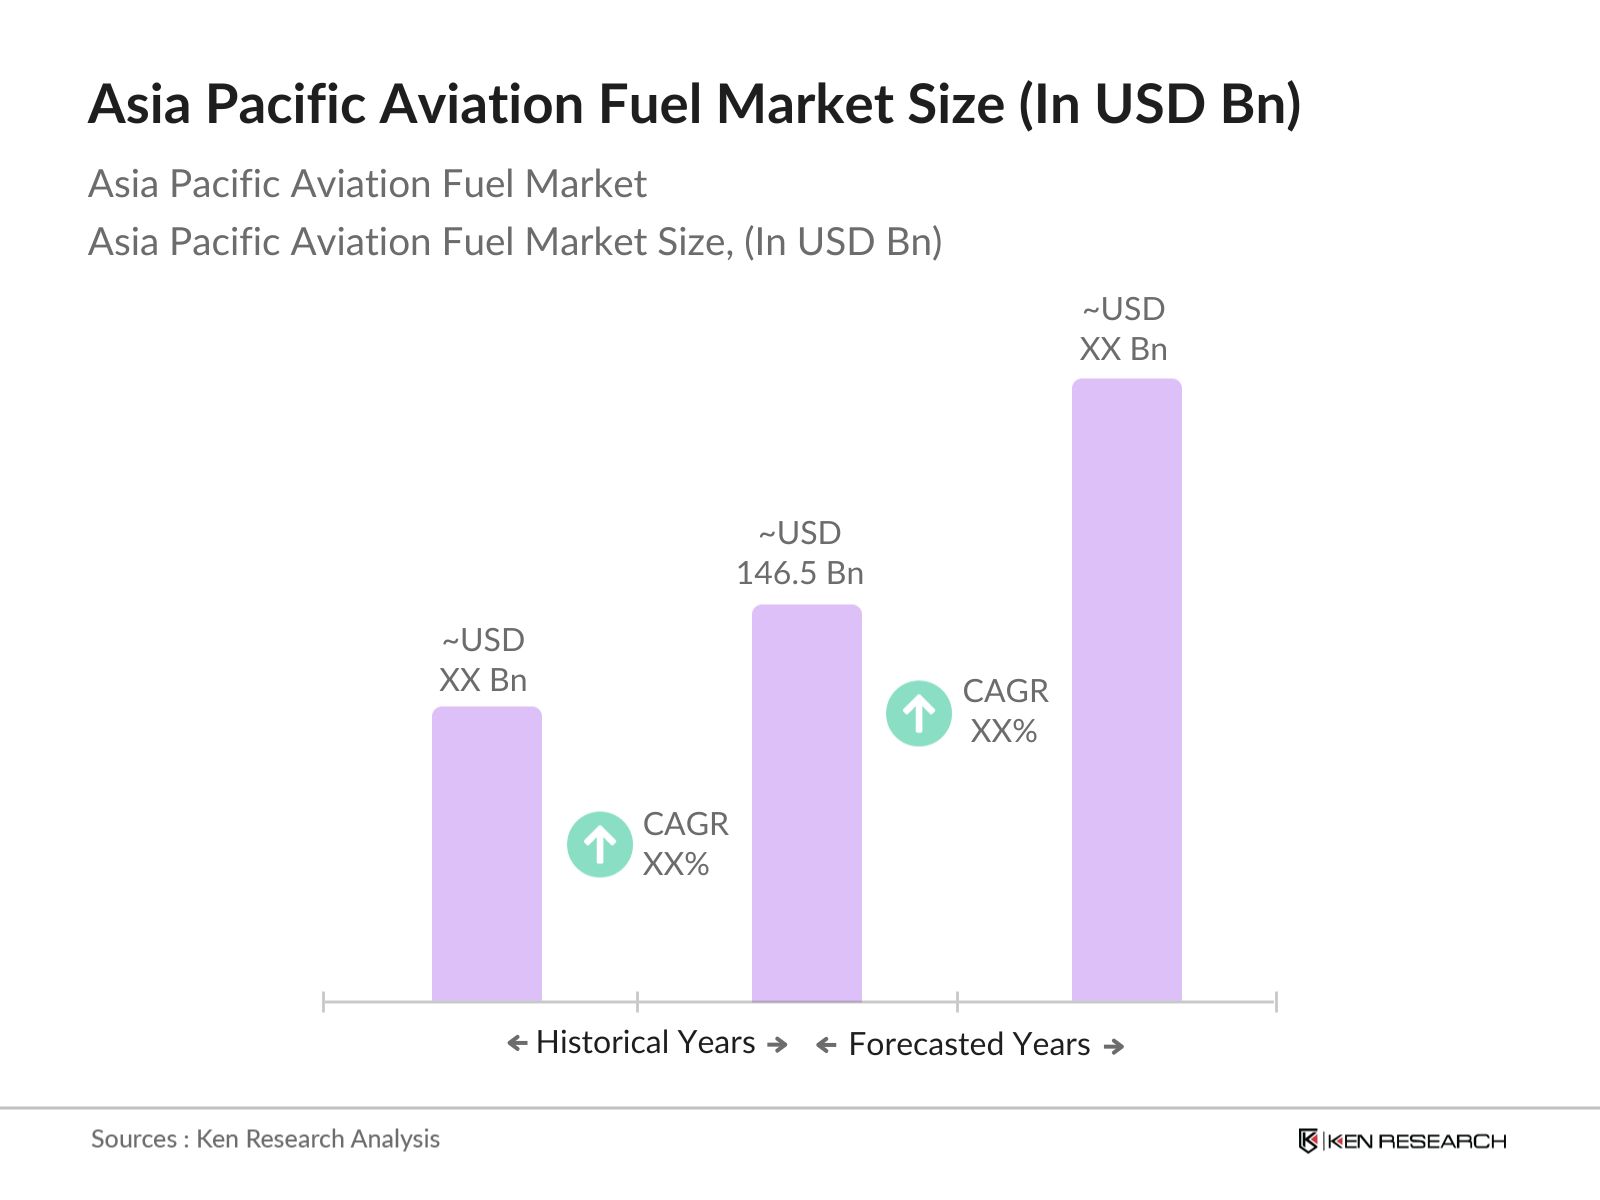
- The Asia Pacific Aviation Fuel Market is valued at USD 146.5 billion, driven by a significant rise in air travel demand and the expansion of both commercial and general aviation across major hubs. Large-scale operators like Singapore Airlines and Air India contribute substantially to fuel demand, supported by government incentives that promote sustainable aviation fuel (SAF) adoption. This drive towards cleaner fuels aligns with increasing regulatory pressure to reduce carbon emissions, positioning the Asia Pacific as a high-growth market for aviation fuel.
- China, Japan, and Singapore lead the Asia Pacific aviation fuel market. Chinas investments in SAF and biofuels align with its ambitious emissions reduction targets, while Singapore's role as a strategic refueling hub supports a significant portion of Asia-bound air traffic. Japan is advancing its hydrogen fuel initiatives, aligning with government mandates and technological investments aimed at lowering emissions, giving it a competitive edge in cleaner aviation fuel innovations.
- Asia-Pacific governments are imposing stricter carbon emission standards on the aviation industry. In 2023, Japan and Australia introduced new limits on aviation-related emissions, mandating a reduction of at least 10% in total emissions from 2022 levels. These regulations are driving airlines to adopt SAF and invest in fuel-efficient technologies to remain compliant.
Asia Pacific Aviation Fuel Market Segmentation
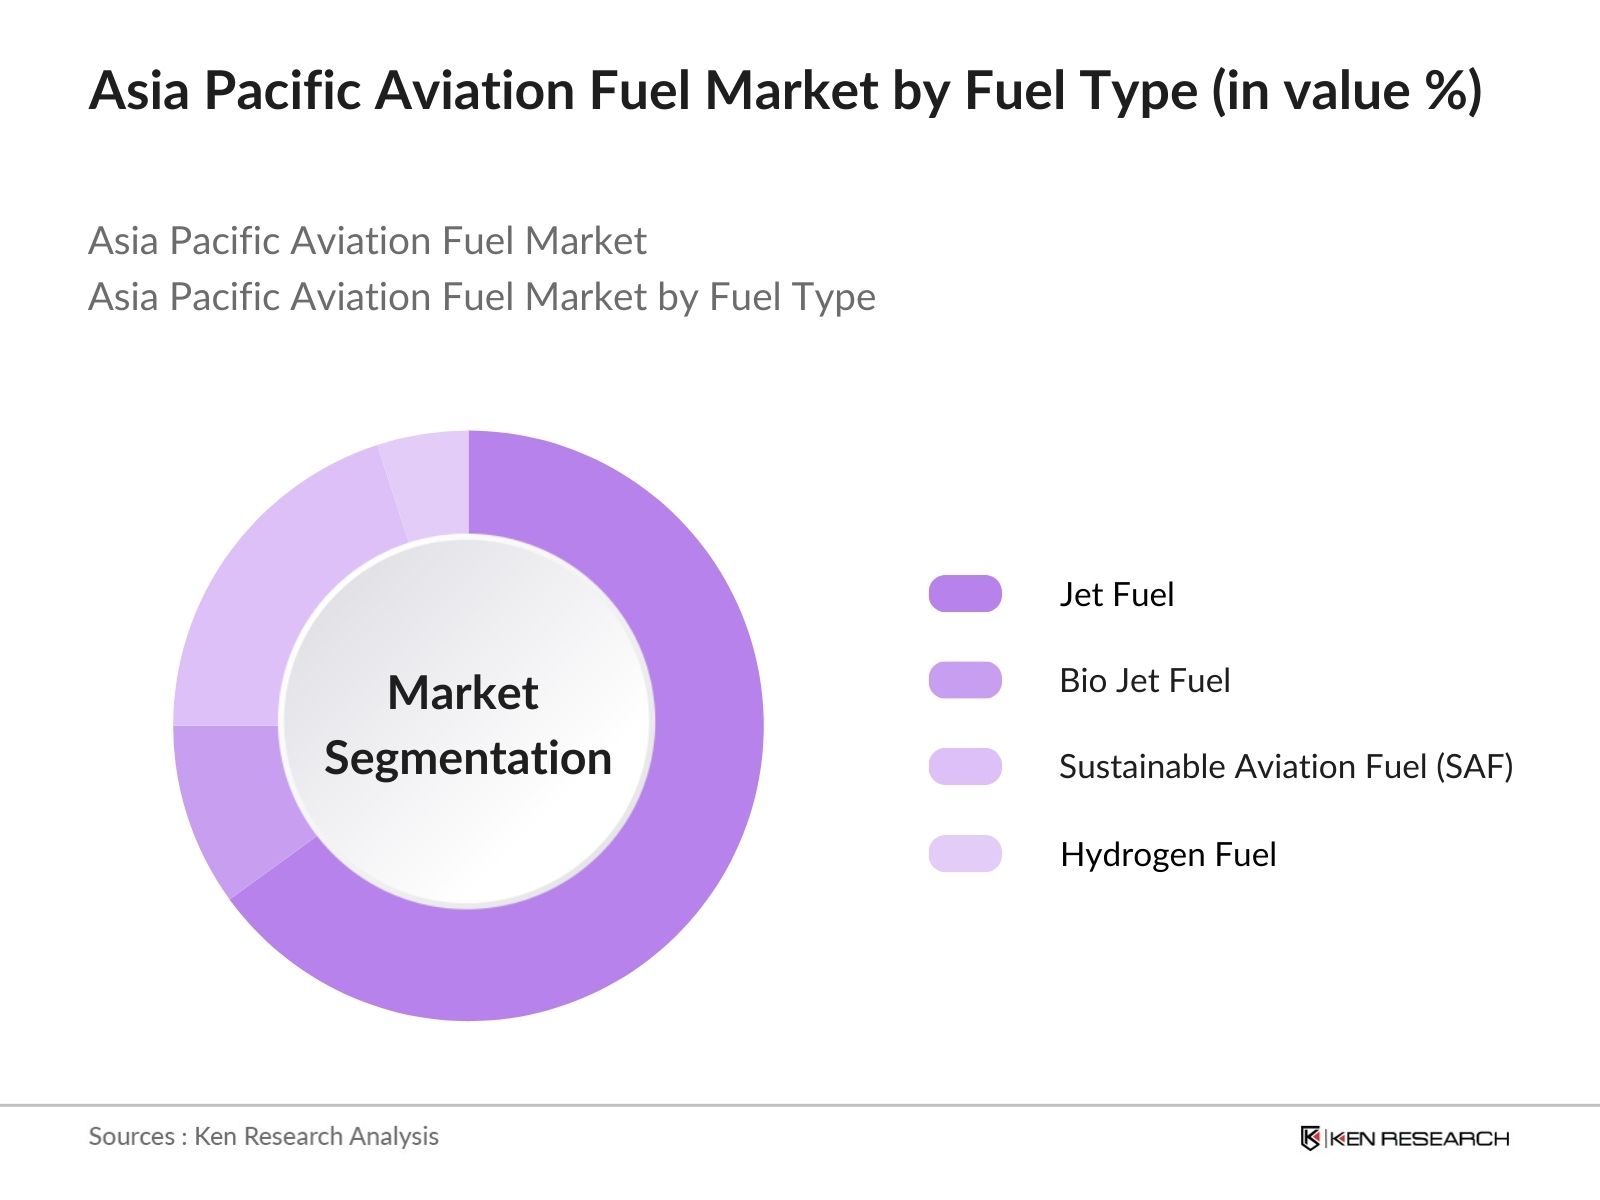
- By Fuel Type: The market is segmented by fuel type into Jet Fuel, Bio Jet Fuel, Sustainable Aviation Fuel (SAF), and Hydrogen Fuel. Jet Fuel holds the largest market share, given the widespread infrastructure and supply chain supporting its use in commercial airlines across the region.
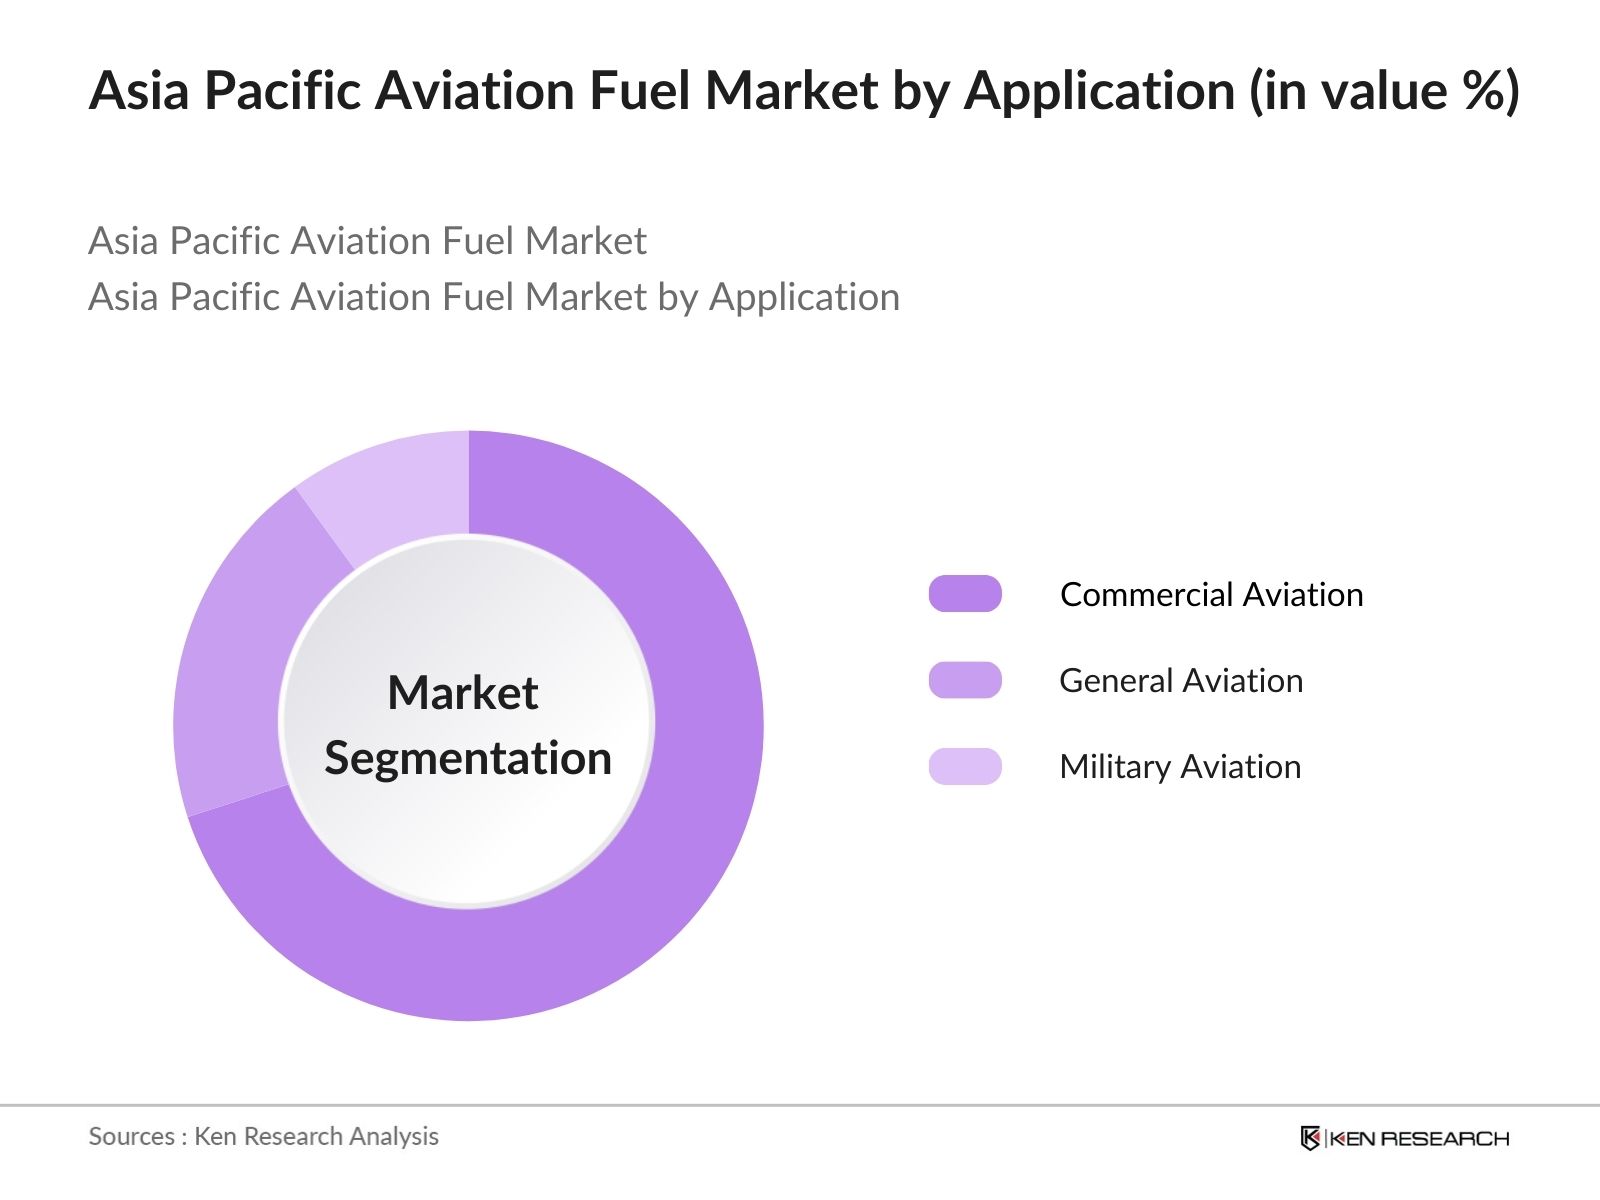
- By Application: The application segmentation includes Commercial Aviation, General Aviation, and Military Aviation. Commercial Aviation dominates the market due to the high demand from passenger airlines and cargo carriers in major hubs across Tokyo, Sydney, and Beijing.
Asia Pacific Aviation Fuel Market Competitive Landscape
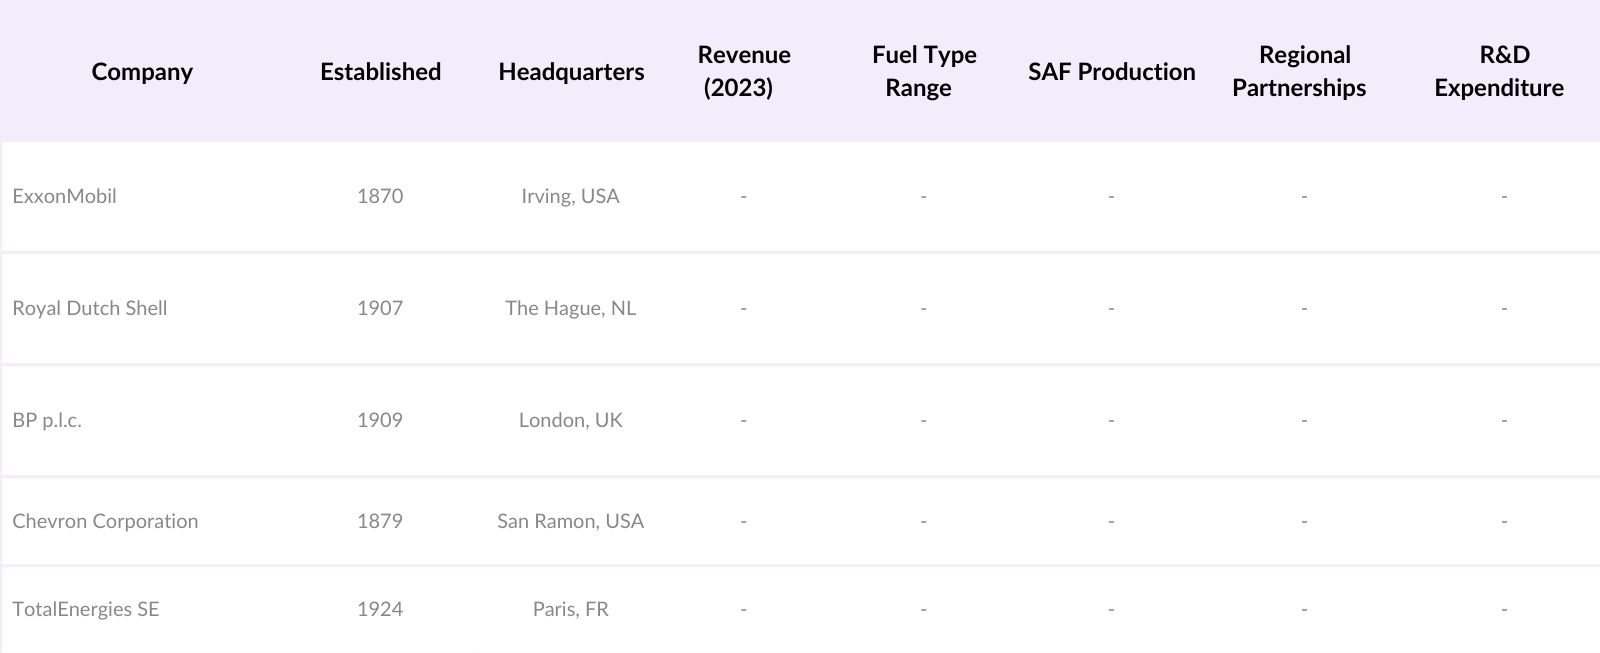
The Asia Pacific aviation fuel market is consolidated, with key players such as ExxonMobil, Royal Dutch Shell, and BP holding substantial influence. These companies leverage extensive distribution networks and are at the forefront of sustainable fuel research, further solidifying their market position. Partnerships with regional players and investments in SAF production also contribute to their dominance.
Asia Pacific Aviation Fuel Market Analysis
Market Growth Drivers
- Rising Passenger Traffic: Passenger traffic across the Asia-Pacific region is increasing, driven by economic growth in countries such as China, India, and Indonesia. In 2023, China alone saw about 900 million domestic flights, with the Civil Aviation Administration of China projecting further growth for the sector. India also saw a rise in air travel, with over 150 million domestic passengers in 2023 according to Indias Ministry of Civil Aviation. This surge in air travel demand increases the requirement for aviation fuel, directly impacting fuel consumption across the region.
- Increasing Demand from Commercial Airlines: Asia-Pacifics growing middle class fuels demand for air travel, leading airlines to expand operations. With fleet sizes increasing, commercial airline demand for aviation fuel is on the rise. The Association of Asia Pacific Airlines reported that over 5,000 new aircraft orders were placed between 2022-2024. The surge in new airline services directly increases fuel demand to support expanded operational capacity and regional routes.
- Technological Advancements in Fuel Efficiency: Asia-Pacific's aviation sector is investing in fuel-efficient technologies, with airlines adopting new-generation aircraft to lower fuel consumption per passenger mile. The 2023 data from Airbus reports that around 25% of Asia-Pacific airlines' fleets are equipped with advanced engines that improve fuel efficiency by 15-20%. The adaptation of such technologies reduces fuel expenditure and aligns with governmental emissions targets, fueling growth in the aviation fuel sector.
Market Challenges
- Volatile Fuel Prices: Fuel price volatility, influenced by global economic shifts, remains a significant challenge for the aviation sector in Asia-Pacific. In 2023, Asias average aviation fuel price fluctuated by 20% due to shifts in global crude oil prices, affecting the operational costs for regional airlines. Such fluctuations impact the profitability and cost strategies of airlines, complicating long-term fuel procurement.
- Environmental Concerns: The aviation sector in Asia-Pacific faces regulatory and public pressure to reduce carbon emissions, as the regions carbon footprint grows with increased air travel. Data from the World Resources Institute in 2023 showed that the region's aviation emissions constitute nearly 30% of the global aviation carbon footprint. Environmental regulations call for costly transitions to SAF and other low-carbon alternatives, challenging the sector to balance growth with sustainability.
Asia Pacific Aviation Fuel Market Future Outlook
The Asia Pacific aviation fuel market is set to grow, driven by increased demand for sustainable aviation options, especially with SAF and biofuels. Government support for eco-friendly fuels, expanding regional airline routes, and continued investments in fuel efficiency technologies will be pivotal in shaping the market's trajectory over the next few years.
Market Opportunities
- Growing Adoption of Sustainable Aviation Fuels (SAF): The Asia-Pacific aviation fuel market sees significant opportunities in SAF adoption as countries enforce low-carbon fuel standards. Japan and Singapores 2023 initiatives to establish SAF refineries demonstrate robust government support, with Singapores SAF facility projected to produce 500 million liters annually by 2025. This shift to SAF will cater to rising demands for cleaner fuel alternatives in the sector.
- Expansion of Airline Fleets: Airlines across Asia-Pacific are expanding their fleets, driven by passenger demand and government support. By 2024, the regions airlines are expected to receive over 600 new aircraft from major manufacturers, according to data from Boeing. This fleet expansion directly boosts fuel demand, with each new aircraft adding an estimated 30,000 liters of fuel consumption per long-haul trip.
Scope of the Report
|
Fuel Type |
Jet Fuel |
|
Bio Jet Fuel |
|
|
Sustainable Aviation Fuel |
|
|
Hydrogen Fuel |
|
|
Application |
Commercial Aviation |
|
General Aviation |
|
|
Military Aviation |
|
|
Distribution Channel |
Direct Supply |
|
Third-Party Distributors |
|
|
End User |
Passenger Airlines |
|
Cargo Airlines |
|
|
Government/Military |
|
|
Country |
China |
|
India |
|
|
Japan |
|
|
South Korea |
|
|
Australia |
Products
Key Target Audience
Investor and Venture Capitalist Firms
Government and Regulatory Bodies (e.g., Civil Aviation Authority of Singapore, Ministry of Petroleum and Natural Gas, India)
Fuel Suppliers and Distributors
Banks and Financial Institutions
Aircraft Manufacturers
Commercial Airline Operators
Environmental Agencies (e.g., Environmental Protection Department, Hong Kong)
Refinery and Fuel Production Facilities
Trade and Industry Bodies (e.g., International Air Transport Association)
Companies
Players Mentioned in the Report
ExxonMobil Corporation
Royal Dutch Shell
BP p.l.c.
Chevron Corporation
TotalEnergies SE
Sinopec
Indian Oil Corporation
Bharat Petroleum
Reliance Industries
Petronas
Table of Contents
1. Asia Pacific Aviation Fuel Market Overview
1.1. Definition and Scope
1.2. Market Taxonomy
1.3. Key Market Growth Indicators
1.4. Market Segmentation Overview
2. Asia Pacific Aviation Fuel Market Size (in USD Bn)
2.1. Historical Market Size
2.2. Year-On-Year Growth Analysis
2.3. Key Market Developments and Milestones
3. Asia Pacific Aviation Fuel Market Analysis
3.1. Growth Drivers
3.1.1. Rising Passenger Traffic
3.1.2. Increasing Demand from Commercial Airlines
3.1.3. Government Initiatives for Cleaner Aviation Fuels
3.1.4. Technological Advancements in Fuel Efficiency
3.2. Market Challenges
3.2.1. Volatile Fuel Prices
3.2.2. Environmental Concerns
3.2.3. Regulatory Compliance Costs
3.3. Opportunities
3.3.1. Growing Adoption of Sustainable Aviation Fuels (SAF)
3.3.2. Expansion of Airline Fleets
3.3.3. Regional Infrastructure Development
3.4. Trends
3.4.1. Increase in Biofuel Usage
3.4.2. Development of Hydrogen-Based Aviation Fuel
3.4.3. Expansion of Low-Emission Fuel Production Facilities
3.5. Government Regulation
3.5.1. Carbon Emission Standards
3.5.2. Fuel Quality Control Policies
3.5.3. Regional Incentives for SAF Production
3.5.4. Emission Trading Schemes (ETS)
3.6. SWOT Analysis
3.7. Value Chain Analysis (Refining to Distribution)
3.8. Porters Five Forces Analysis
3.9. Market Dynamics Ecosystem (Airlines, Fuel Suppliers, Distributors)
4. Asia Pacific Aviation Fuel Market Segmentation
4.1. By Fuel Type (In Value %)
4.1.1. Jet Fuel
4.1.2. Bio Jet Fuel
4.1.3. Sustainable Aviation Fuel (SAF)
4.1.4. Hydrogen Fuel
4.2. By Application (In Value %)
4.2.1. Commercial Aviation
4.2.2. General Aviation
4.2.3. Military Aviation
4.3. By Distribution Channel (In Value %)
4.3.1. Direct Supply
4.3.2. Third-Party Distributors
4.4. By End User (In Value %)
4.4.1. Passenger Airlines
4.4.2. Cargo Airlines
4.4.3. Government/Military
4.5. By Country (In Value %)
4.5.1. China
4.5.2. India
4.5.3. Japan
4.5.4. South Korea
4.5.5. Australia
5. Asia Pacific Aviation Fuel Market Competitive Analysis
5.1 Detailed Profiles of Major Companies
5.1.1. ExxonMobil Corporation
5.1.2. Chevron Corporation
5.1.3. BP p.l.c.
5.1.4. Royal Dutch Shell
5.1.5. TotalEnergies SE
5.1.6. Neste Oyj
5.1.7. Honeywell UOP
5.1.8. LanzaTech
5.1.9. Gevo, Inc.
5.1.10. Sinopec
5.1.11. Indian Oil Corporation
5.1.12. Bharat Petroleum
5.1.13. Reliance Industries
5.1.14. Petronas
5.1.15. JXTG Nippon Oil & Energy Corporation
5.2 Cross Comparison Parameters (Market Presence, Revenue, Fuel Production Capacity, Partnerships, Environmental Initiatives, Technological Innovations, SAF Production Volume, Distribution Network)
5.3. Market Share Analysis
5.4. Strategic Alliances
5.5. Mergers & Acquisitions
5.6. Regional Investment Patterns
5.7. Public-Private Partnerships
5.8. Research & Development Expenditure
6. Asia Pacific Aviation Fuel Market Regulatory Framework
6.1. Emission Standards and Carbon Footprint Limits
6.2. Certification Requirements for SAF
6.3. Import and Export Tariff Policies
6.4. Environmental Impact Regulations
6.5. Incentive Programs for Sustainable Fuel Adoption
7. Asia Pacific Aviation Fuel Market Future Size (in USD Bn)
7.1. Projected Market Growth Drivers
7.2. Key Factors Influencing Future Demand
8. Asia Pacific Aviation Fuel Market Future Segmentation
8.1. By Fuel Type (In Value %)
8.2. By Application (In Value %)
8.3. By Distribution Channel (In Value %)
8.4. By End User (In Value %)
8.5. By Country (In Value %)
9. Asia Pacific Aviation Fuel Market Analysts Recommendations
9.1. TAM/SAM/SOM Analysis
9.2. Industry Consortium Collaborations
9.3. Sustainability Initiative Recommendations
9.4. White Space and Niche Market Opportunities
Disclaimer Contact UsResearch Methodology
Step 1: Identification of Key Variables
Develop an ecosystem map that includes all relevant stakeholders in the Asia Pacific aviation fuel market. Utilize desk research and proprietary databases to identify key variables impacting market trends.
Step 2: Market Analysis and Construction
Compile and analyze historical data on market penetration, fuel demand, and revenue generation, while evaluating service quality statistics for accurate estimations.
Step 3: Hypothesis Validation and Expert Consultation
Conduct CATI interviews with industry experts to validate key market hypotheses, gathering direct insights that enhance data reliability.
Step 4: Research Synthesis and Final Output
Engage with aviation companies to capture detailed insights into fuel preferences, sales, and operational statistics, ensuring an accurate market analysis.
Frequently Asked Questions
1. How big is the Asia Pacific Aviation Fuel Market?
The Asia Pacific aviation fuel market is valued at USD 146.5 billion, driven by increasing air travel demand and sustainable fuel incentives.
2. What challenges does the Asia Pacific Aviation Fuel Market face?
Key challenges include fluctuating fuel prices, stringent emissions regulations, and high costs associated with sustainable aviation fuels.
3. Who are the major players in the Asia Pacific Aviation Fuel Market?
Leading players include ExxonMobil, Royal Dutch Shell, BP, Chevron, and TotalEnergies, all of whom leverage extensive networks and SAF advancements.
4. What are the growth drivers of the Asia Pacific Aviation Fuel Market?
Growth is driven by the adoption of biofuels, rising air travel, and government support for eco-friendly aviation fuels.
Why Buy From Us?
 Framework")
What makes us stand out is that our consultants follows Robust, Refine and Result (RRR) methodology. i.e. Robust for clear definitions, approaches and sanity checking, Refine for differentiating respondents facts and opinions and Result for presenting data with story

We have set a benchmark in the industry by offering our clients with syndicated and customized market research reports featuring coverage of entire market as well as meticulous research and analyst insights.

While we don't replace traditional research, we flip the method upside down. Our dual approach of Top Bottom & Bottom Top ensures quality deliverable by not just verifying company fundamentals but also looking at the sector and macroeconomic factors.

With one step in the future, our research team constantly tries to show you the bigger picture. We help with some of the tough questions you may encounter along the way: How is the industry positioned? Best marketing channel? KPI's of competitors? By aligning every element, we help maximize success.

Our report gives you instant access to the answers and sources that other companies might choose to hide. We elaborate each steps of research methodology we have used and showcase you the sample size to earn your trust.

If you need any support, we are here! We pride ourselves on universe strength, data quality, and quick, friendly, and professional service.