
Asia-Pacific CAR T-Cell Therapy Market Outlook to 2030
Region:Asia
Author(s):Naman Rohilla
Product Code:KROD3527
November 2024
81
About the Report
Asia-Pacific CAR T-Cell Therapy Market Overview
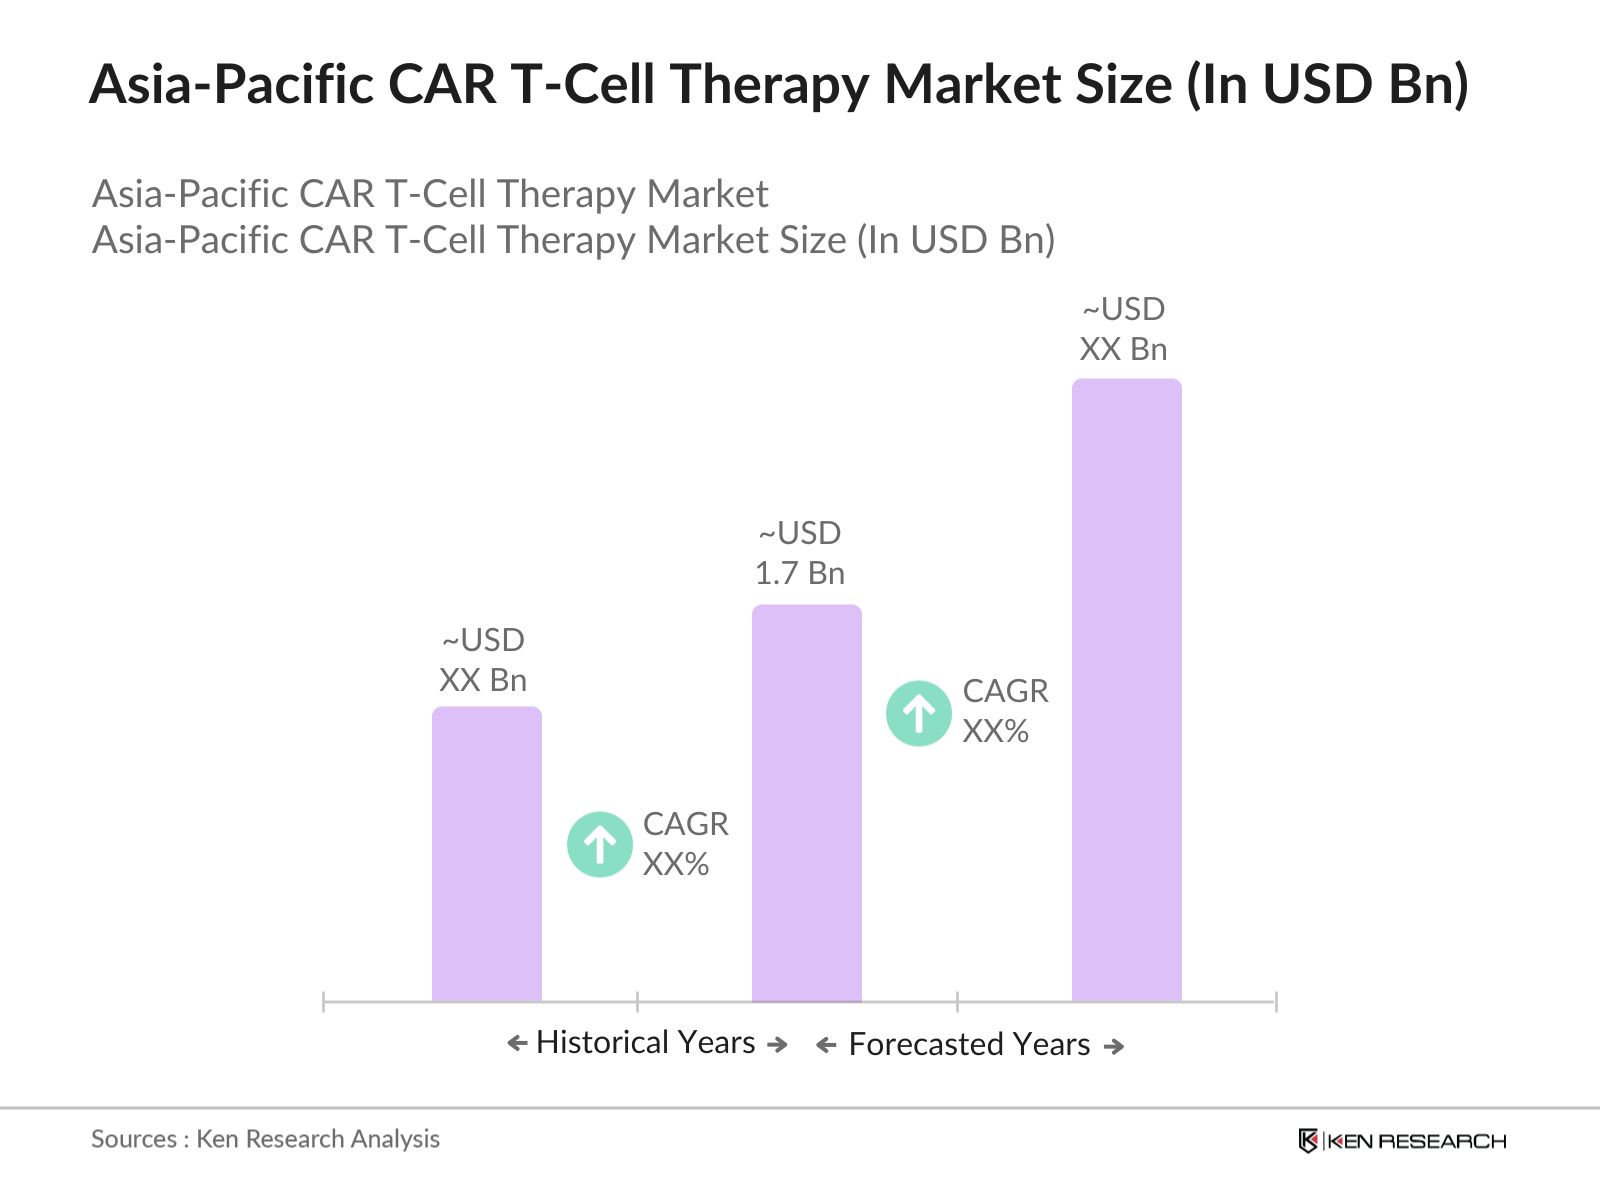
- The Asia-Pacific CAR T-Cell Therapy market is valued at USD 1.7 billion based on a comprehensive five-year historical analysis. The market is driven by increasing advancements in gene editing technologies, which are enhancing the precision and efficiency of CAR-T cell production. Growing approval rates for CAR T-Cell therapies and strong investments in biotechnology are further boosting the demand. Additionally, financial support from governments and private investors for cutting-edge cancer treatments has been a critical factor in driving the market forward.
- China, Japan, and South Korea are the dominant regions in the Asia-Pacific CAR T-Cell Therapy market due to their advanced healthcare infrastructure and strong biotech research capabilities. These countries have established clinical trials and fast-track approval processes, enabling faster commercialization of CAR T-cell therapies. Furthermore, government policies supporting innovation in gene therapies and robust investment in cancer research programs further consolidate their dominance.
- The Asia-Pacific region is aligning its regulatory frameworks with international standards such as those from the FDA and EMA. By 2024, Japans PMDA and Chinas NMPA have adopted guidelines similar to the FDAs to ensure the safety and efficacy of CAR T-cell therapies. These guidelines emphasize stringent clinical trial requirements, ensuring that CAR T-cell products meet international safety standards. For example, Japan has harmonized its approval processes with EMAs guidelines, ensuring quicker international market entry for CAR T-cell therapies. The alignment with global regulatory standards is critical in promoting cross-border clinical trials and commercial adoption.
Asia-Pacific CAR T-Cell Therapy Market Segmentation
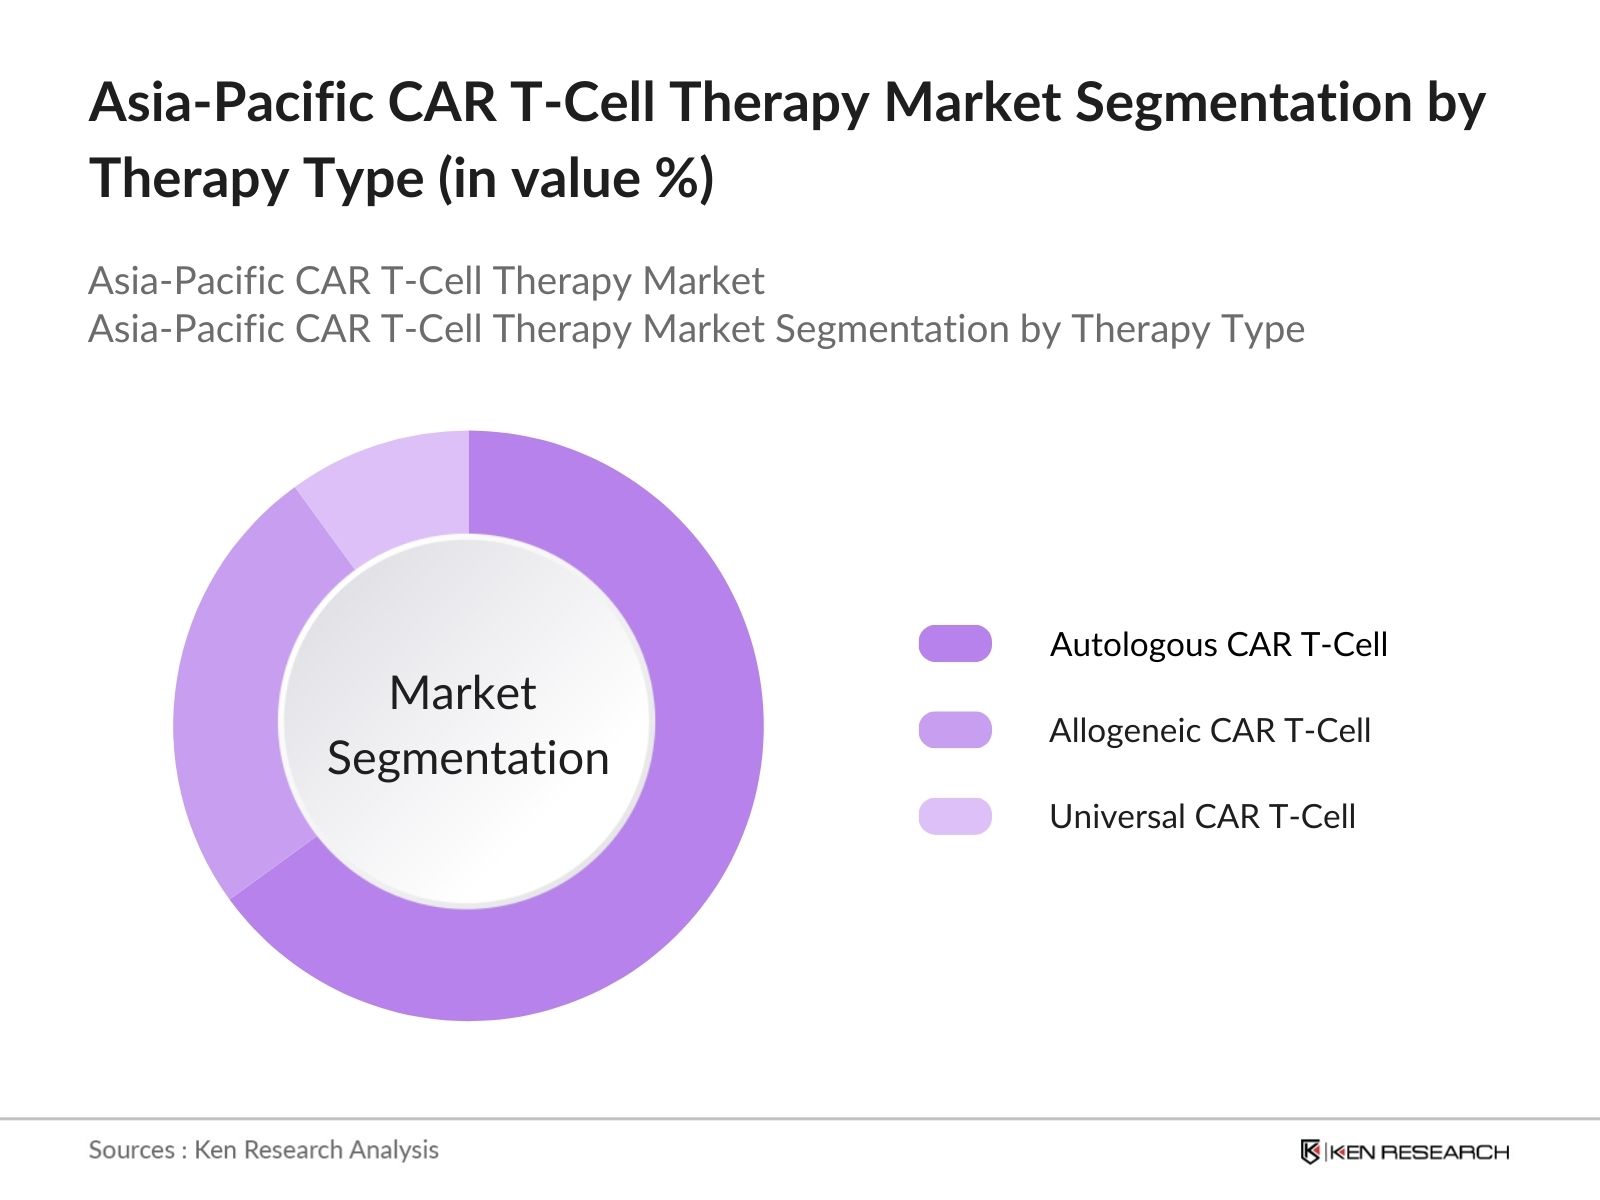
By Therapy Type: The Asia-Pacific CAR T-Cell Therapy market is segmented by therapy type into autologous CAR T-cell therapy, allogeneic CAR T-cell therapy, and universal CAR T-cell therapy. Autologous CAR T-cell therapy holds a dominant market share in this segmentation due to its high success rates in treating blood cancers like leukemia and lymphoma. The ability to tailor this therapy to individual patients by using their own cells has resulted in better efficacy and minimal immune rejection, making it the preferred choice in clinical applications.
By Target Antigen: The market is also segmented by target antigen into CD19, BCMA, CD22, and others. CD19-targeted CAR T-cell therapies hold the largest market share, largely due to their effectiveness in treating B-cell malignancies such as leukemia and lymphoma. This antigen has been widely studied and shows consistent success across multiple clinical trials, solidifying its position as the most widely used target for CAR T-cell therapy in the region.

Asia-Pacific CAR T-Cell Therapy Market Competitive Landscape
The Asia-Pacific CAR T-Cell Therapy market is dominated by major global and regional players who have established strong R&D pipelines and clinical partnerships with healthcare institutions. The competitive landscape highlights the importance of strategic collaborations, especially between biotech firms and academic research centers, for the development of next-generation CAR T-cell therapies.
|
Company |
Establishment Year |
Headquarters |
Revenue (2023, USD Bn) |
No. of Employees |
R&D Expenditure |
Product Portfolio |
Global Presence |
Key Clients |
Strategic Alliances |
|
ABB Ltd. |
1988 |
Zurich, Switzerland |
- |
- |
- |
- |
- |
- |
- |
|
Fanuc Corporation |
1972 |
Oshino, Japan |
- |
- |
- |
- |
- |
- |
- |
|
KUKA Robotics |
1995 |
Augsburg, Germany |
- |
- |
- |
- |
- |
- |
- |
|
Yaskawa Electric Corp |
1915 |
Kitakyushu, Japan |
- |
- |
- |
- |
- |
- |
- |
|
Bharat Fritz Werner Ltd. (BFW) |
1961 |
Bengaluru, India |
- |
- |
- |
- |
- |
- |
- |
Asia-Pacific CAR T-Cell Therapy Market Analysis
Asia-Pacific CAR T-Cell Therapy Market Growth Drivers
- Rise in Hematologic Cancer Cases: The Asia-Pacific region has witnessed an increase in hematologic cancer cases. In 2024, according to the World Health Organization (WHO), over 1 million new blood cancer cases were recorded globally, with a substantial share emerging from China, Japan, and India. Hematologic malignancies like leukemia and lymphoma are becoming more prevalent, driving the demand for innovative treatments like CAR T-cell therapy. The rise in cases correlates with an aging population and increased awareness of early detection in countries like South Korea, where cancer screening rates have risen by 30%. These factors create a growing market for CAR-T therapies to treat such conditions.
- Increasing Approval for CAR-T Therapies: In recent years, regulatory authorities like the FDA and EMA have accelerated the approval process for CAR T-cell therapies, with Asia-Pacific countries such as China and Japan following suit. In 2024, Japans Pharmaceuticals and Medical Devices Agency (PMDA) approved several CAR T-cell treatments, allowing them to become part of the standard cancer treatment protocol. This increase in approvals is backed by clinical evidence from trials showing enhanced patient survival rates, with trials in Japan reporting remission in 80% of patients with certain types of blood cancers. Government-backed approvals reflect strong institutional support for CAR T-cell therapies in Asia-Pacific.
- Advancements in Gene Editing Technologies: Technological advancements in gene editing, such as CRISPR-Cas9, are transforming the landscape of CAR T-cell therapy. By 2024, China and South Korea have invested over $5 billion in research and development for gene editing, which has been integral in producing CAR T-cells with enhanced efficacy and reduced side effects. Leading academic institutions and biotech firms have improved gene editing accuracy, making CAR T-cell therapy safer and more effective. This shift has been pivotal in expanding CAR T-cell applications for various blood cancers, solid tumors, and autoimmune diseases.
Asia-Pacific CAR T-Cell Therapy Market Challenges
- High Manufacturing Costs: Manufacturing CAR T-cell therapies remains an expensive process due to the complexity of individual cell modification and scalability challenges. By 2024, the cost of producing CAR T-cell therapies remains over $400,000 per patient in key markets like Japan and China, which limits widespread adoption. The lack of scalable production methods in developing nations in Southeast Asia further exacerbates the cost barrier. Governments and biotech firms continue to work on reducing these costs, but the high expense remains a substantial obstacle to the mass commercialization of these therapies in Asia-Pacific.
- Stringent Regulatory Approvals (FDA/EMA Guidelines): Regulatory pathways for CAR T-cell therapies remain stringent, particularly in Japan, South Korea, and China. By 2024, the median time for regulatory approvals of CAR T-cell therapies ranges between 3 to 4 years due to extensive safety and efficacy trials required by organizations like the PMDA in Japan and Chinas National Medical Products Administration (NMPA). These time-consuming approvals delay market entry, slowing down the availability of these therapies. Additionally, the ongoing need for alignment with international standards from the FDA and EMA creates bottlenecks for companies looking to launch CAR T-cell treatments in the Asia-Pacific region.
Asia-Pacific CAR T-Cell Therapy Market Future Outlook
Over the next five years, the Asia-Pacific CAR T-Cell Therapy market is expected to experience growth due to continuous advancements in genetic engineering, increased clinical adoption, and expanding indications beyond hematologic cancers. Governments across the region are providing funding and fast-track approval processes, which will accelerate market expansion. With the ongoing development of allogeneic and off-the-shelf CAR-T therapies, cost reduction and accessibility are likely to improve, making these treatments more widely available.
Asia-Pacific CAR T-Cell Therapy Market Opportunities
- Strategic Partnerships and Collaborations (Pharma-Biotech Alliances): Strategic collaborations between pharmaceutical and biotech companies are a key growth driver in the Asia-Pacific CAR T-cell therapy market. By 2024, major pharmaceutical firms in China, Japan, and South Korea have invested over $3 billion in joint ventures and licensing agreements with biotech companies specializing in CAR T-cell therapies. These collaborations aim to accelerate drug development, reduce costs, and expand market reach. Such alliances have led to faster clinical trial completion and more comprehensive therapy portfolios, thereby broadening the therapeutic applications of CAR T-cell treatments.
- Expansion of CAR T-Cell Applications (Solid Tumors and Autoimmune Diseases): CAR T-cell therapies, originally developed for blood cancers, are now expanding into treatments for solid tumors and autoimmune diseases. In 2024, clinical trials in Japan and China demonstrated promising results for using CAR T-cells to target pancreatic and ovarian cancers. There is also growing research into applying these therapies for autoimmune conditions like lupus and rheumatoid arthritis. The successful application of CAR T-cell therapy for non-hematologic cancers represents major opportunities for market growth as companies focus on diversifying their product pipelines.
Scope of the Report
|
By Type of Therapy |
Autologous CAR T-Cell Therapy Allogeneic CAR T-Cell Therapy Universal CAR T-Cell Therapy |
|
By Target Antigen |
CD19 BCMA CD22 Others |
|
By Therapeutic Area |
Hematologic Cancers (Leukemia, Lymphoma, Multiple Myeloma) Solid Tumors Autoimmune Diseases Others |
|
By End User |
Hospitals Cancer Research Centers Academic & Research Institutes |
|
By Region |
China Japan South Korea India Australia & New Zealand Rest of Asia-Pacific |
Products
Key Target Audience
Pharmaceutical Manufacturers
Biotechnology Companies
Cancer Research Centers
Oncology Hospitals and Clinics
Government and Regulatory Bodies (FDA, EMA, PMDA)
Healthcare Investors and Venture Capital Firms
Hospitals with Cell Therapy Programs
Private Equity Firms
Companies
Asia-Pacific CAR T-Cell Therapy Market Major Players
Novartis AG
Gilead Sciences Inc.
Bristol-Myers Squibb
Johnson & Johnson
Pfizer Inc.
Amgen Inc.
Celgene Corporation
Bluebird Bio Inc.
Celyad Oncology
Kite Pharma
Legend Biotech
Autolus Therapeutics
Fate Therapeutics
CARsgen Therapeutics
Gracell Biotechnologies
Table of Contents
1. Asia-Pacific CAR T-Cell Therapy Market Overview
1.1. Definition and Scope
1.2. Market Taxonomy
1.3. Market Growth Rate
1.4. Market Segmentation Overview
2. Asia-Pacific CAR T-Cell Therapy Market Size (In USD Bn)
2.1. Historical Market Size
2.2. Year-On-Year Growth Analysis
2.3. Key Market Developments and Milestones
3. Asia-Pacific CAR T-Cell Therapy Market Analysis
3.1. Growth Drivers
3.1.1. Rise in Hematologic Cancer Cases
3.1.2. Increasing Approval for CAR-T Therapies
3.1.3. Advancements in Gene Editing Technologies
3.1.4. Favorable Reimbursement Policies (Regulatory/Financial Incentives)
3.2. Market Challenges
3.2.1. High Manufacturing Costs
3.2.2. Stringent Regulatory Approvals (FDA/EMA Guidelines)
3.2.3. Limited Healthcare Infrastructure in Developing Nations
3.2.4. Supply Chain Disruptions in Cell Therapies
3.3. Opportunities
3.3.1. Strategic Partnerships and Collaborations (Pharma-Biotech Alliances)
3.3.2. Expansion of CAR T-Cell Applications (Solid Tumors and Autoimmune Diseases)
3.3.3. Technological Innovations in Cell Therapy Manufacturing
3.3.4. Clinical Trials and Product Launches in Emerging Markets
3.4. Trends
3.4.1. Development of Next-Generation CAR T-Cells (Allogeneic and Off-the-Shelf Therapies)
3.4.2. Integration of Artificial Intelligence in Therapy Design
3.4.3. Personalized and Precision Medicine Approach in Oncology
3.4.4. Use of Digital Health Platforms for Patient Monitoring and Follow-Up
3.5. Government Regulations and Policies
3.5.1. FDA and EMA CAR T-Cell Therapy Guidelines
3.5.2. National Oncology Programs and Initiatives
3.5.3. Financial Support and Incentives for Cancer Treatment
3.6. SWOT Analysis
3.7. Stake Ecosystem (Pharmaceutical Manufacturers, Biotech Startups, Hospitals, R&D Centers)
3.8. Porters Five Forces Analysis
3.9. Competitive Landscape Overview
4. Asia-Pacific CAR T-Cell Therapy Market Segmentation
4.1. By Type of Therapy (In Value %)
4.1.1. Autologous CAR T-Cell Therapy
4.1.2. Allogeneic CAR T-Cell Therapy
4.1.3. Universal CAR T-Cell Therapy
4.2. By Target Antigen (In Value %)
4.2.1. CD19
4.2.2. BCMA
4.2.3. CD22
4.2.4. Others
4.3. By Therapeutic Area (In Value %)
4.3.1. Hematologic Cancers (Leukemia, Lymphoma, Multiple Myeloma)
4.3.2. Solid Tumors
4.3.3. Autoimmune Diseases
4.3.4. Others
4.4. By End User (In Value %)
4.4.1. Hospitals
4.4.2. Cancer Research Centers
4.4.3. Academic & Research Institutes
4.5. By Region (In Value %)
4.5.1. China
4.5.2. Japan
4.5.3. South Korea
4.5.4. India
4.5.5. Australia & New Zealand
4.5.6. Rest of Asia-Pacific
5. Asia-Pacific CAR T-Cell Therapy Market Competitive Analysis
5.1. Detailed Profiles of Major Competitors
5.1.1. Novartis AG
5.1.2. Gilead Sciences Inc.
5.1.3. Bristol-Myers Squibb Company
5.1.4. Johnson & Johnson
5.1.5. Pfizer Inc.
5.1.6. Amgen Inc.
5.1.7. Celgene Corporation
5.1.8. Bluebird Bio Inc.
5.1.9. Celyad Oncology
5.1.10. Kite Pharma
5.1.11. Legend Biotech
5.1.12. Autolus Therapeutics
5.1.13. Fate Therapeutics
5.1.14. CARsgen Therapeutics
5.1.15. Gracell Biotechnologies
5.2. Cross Comparison Parameters
5.2.1. Number of Employees
5.2.2. Headquarters
5.2.3. Inception Year
5.2.4. Revenue
5.2.5. Number of Approved Therapies
5.2.6. Number of Ongoing Clinical Trials
5.2.7. Manufacturing Capabilities (Cell Processing Units)
5.2.8. Research and Development Investments
5.3. Market Share Analysis
5.4. Strategic Initiatives
5.5. Mergers and Acquisitions
5.6. Investment Analysis
5.7. Venture Capital Funding
5.8. Government Grants and Funding Programs
5.9. Private Equity Investments
6. Asia-Pacific CAR T-Cell Therapy Market Regulatory Framework
6.1. Regulatory Authorities (FDA, EMA, PMDA)
6.2. Compliance and Approval Processes
6.3. Clinical Trial Regulations
6.4. Manufacturing and Supply Chain Standards
6.5. Therapy Reimbursement Policies
7. Asia-Pacific CAR T-Cell Therapy Future Market Size (In USD Bn)
7.1. Future Market Size Projections
7.2. Key Factors Driving Future Market Growth
8. Asia-Pacific CAR T-Cell Therapy Future Market Segmentation
8.1. By Type of Therapy (In Value %)
8.2. By Target Antigen (In Value %)
8.3. By Therapeutic Area (In Value %)
8.4. By End User (In Value %)
8.5. By Region (In Value %)
9. Asia-Pacific CAR T-Cell Therapy Market Analysts Recommendations
9.1. TAM/SAM/SOM Analysis
9.2. Customer Cohort Analysis
9.3. Marketing Initiatives
9.4. White Space Opportunity Analysis
Research Methodology
Step 1: Identification of Key Variables
The initial phase involved mapping the key stakeholders in the Asia-Pacific CAR T-Cell Therapy Market, leveraging proprietary databases and secondary sources. This helped identify critical variables like market drivers, challenges, and segmentation dynamics.
Step 2: Market Analysis and Construction
This phase involved analyzing historical data for the CAR T-Cell Therapy market. The data included market penetration rates, therapy adoption statistics, and regional revenue figures, compiled through secondary research.
Step 3: Hypothesis Validation and Expert Consultation
Hypotheses about market trends and growth drivers were validated through consultations with CAR T-cell therapy experts. These consultations were conducted through CATIs with senior managers from pharmaceutical companies.
Step 4: Research Synthesis and Final Output
The final phase synthesized research insights from multiple stakeholders, including pharmaceutical companies and clinical trial investigators, to provide a complete market analysis.
Frequently Asked Questions
1. How big is the Asia-Pacific CAR T-Cell Therapy Market?
The Asia-Pacific CAR T-Cell Therapy market was valued at USD 1.7 billion, driven by advancements in gene editing technologies and growing investment in cancer research.
2. What are the challenges in the Asia-Pacific CAR T-Cell Therapy Market?
Challenges include high manufacturing costs, supply chain bottlenecks, and stringent regulatory approvals that delay product commercialization.
3. Who are the major players in the Asia-Pacific CAR T-Cell Therapy Market?
Key players in the market include Novartis AG, Gilead Sciences Inc., Bristol-Myers Squibb, Johnson & Johnson, and Pfizer Inc. These companies dominate due to their extensive clinical pipelines and strong R&D investments.
4. What are the growth drivers of the Asia-Pacific CAR T-Cell Therapy Market?
Growth is driven by increased approvals of CAR T-cell therapies, government funding for cancer treatments, and technological advancements in genetic engineering.
Why Buy From Us?
 Framework")
What makes us stand out is that our consultants follows Robust, Refine and Result (RRR) methodology. i.e. Robust for clear definitions, approaches and sanity checking, Refine for differentiating respondents facts and opinions and Result for presenting data with story

We have set a benchmark in the industry by offering our clients with syndicated and customized market research reports featuring coverage of entire market as well as meticulous research and analyst insights.

While we don't replace traditional research, we flip the method upside down. Our dual approach of Top Bottom & Bottom Top ensures quality deliverable by not just verifying company fundamentals but also looking at the sector and macroeconomic factors.

With one step in the future, our research team constantly tries to show you the bigger picture. We help with some of the tough questions you may encounter along the way: How is the industry positioned? Best marketing channel? KPI's of competitors? By aligning every element, we help maximize success.

Our report gives you instant access to the answers and sources that other companies might choose to hide. We elaborate each steps of research methodology we have used and showcase you the sample size to earn your trust.

If you need any support, we are here! We pride ourselves on universe strength, data quality, and quick, friendly, and professional service.