


Asia Pacific Carbon Footprint Management Market Outlook to 2030
Region:Asia
Author(s):Sanjna Verma
Product Code:KROD4971
October 2024
87
About the Report
Asia Pacific Carbon Footprint Management Market Overview
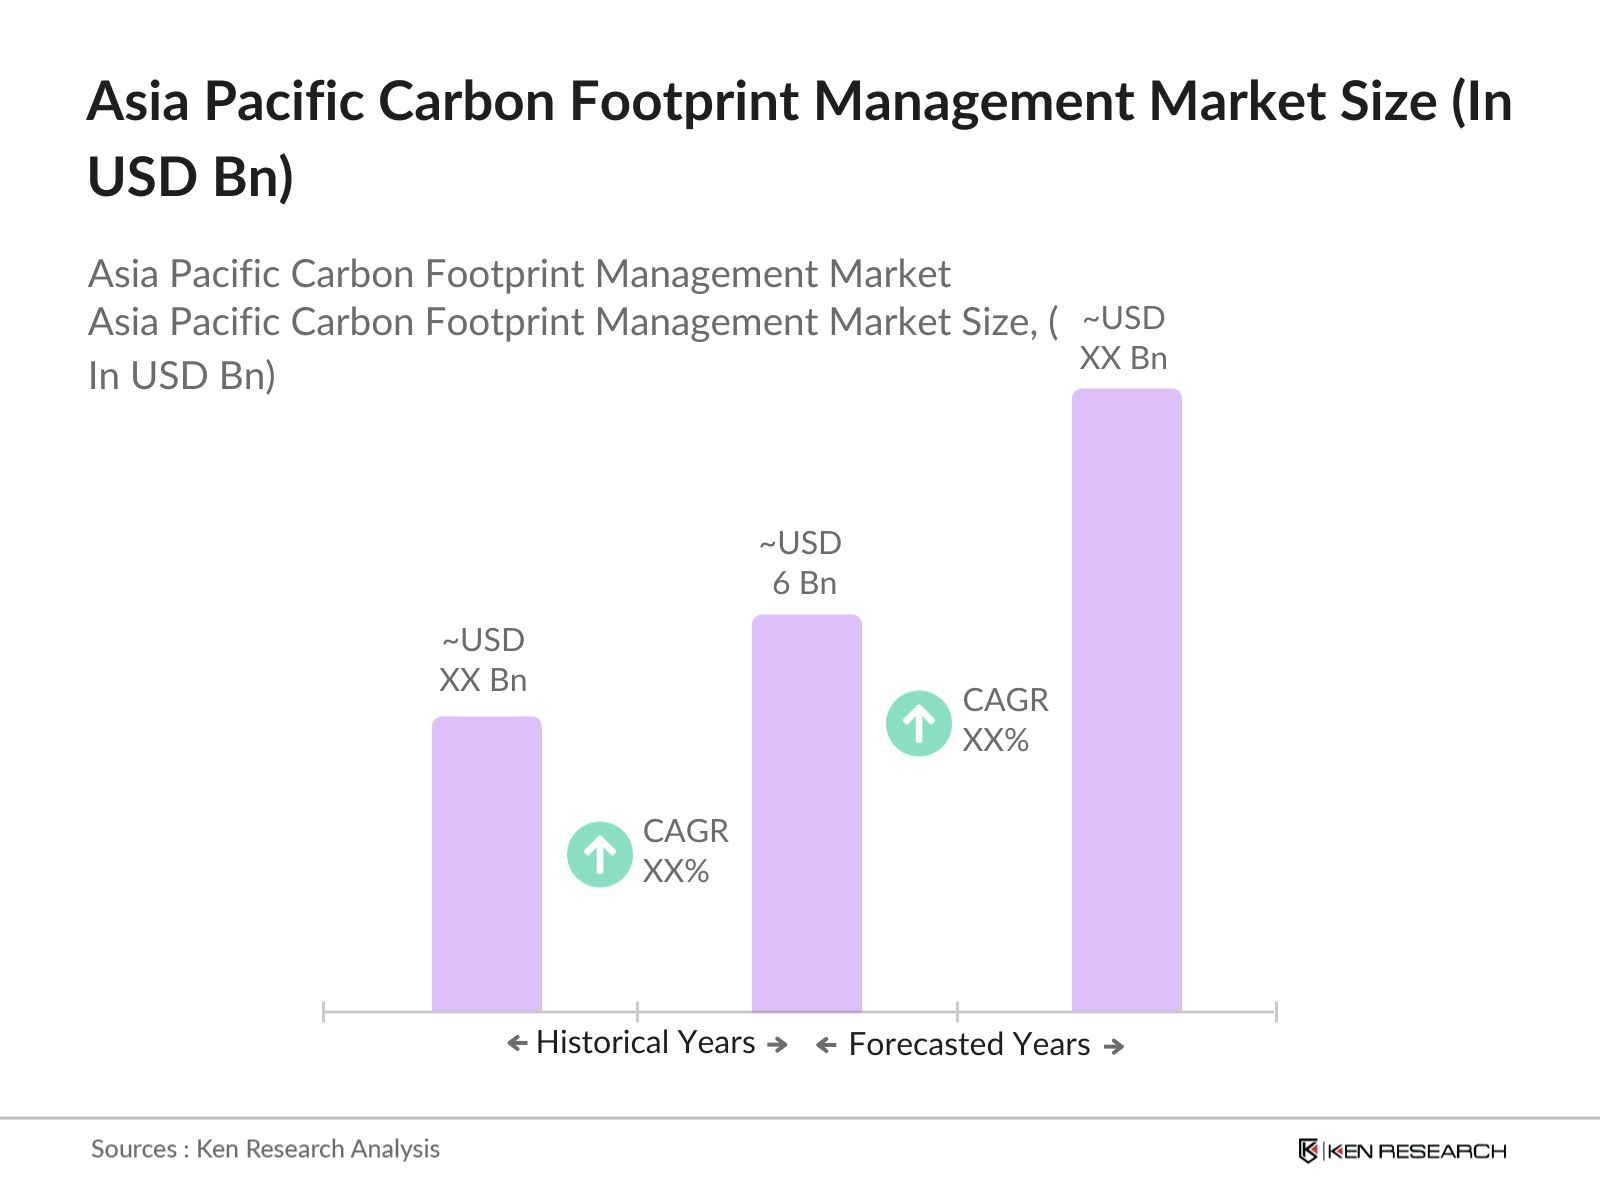
- The Asia Pacific Carbon Footprint Management market is valued at USD 6 billion based on a comprehensive analysis of the last five years, with consistent growth attributed to increasing regulatory pressures and corporate commitments to sustainability. The rising adoption of digital tools, such as AI-driven carbon management platforms and cloud-based solutions, has played a significant role in this market’s expansion. Additionally, government initiatives aimed at achieving carbon neutrality by implementing carbon pricing mechanisms, such as carbon taxes and emissions trading schemes, are key drivers of market growth.
- Key countries like China, India, and Japan dominate the Asia Pacific Carbon Footprint Management market. China's leadership stems from its large industrial base and high carbon emissions, driven by energy-intensive industries. India’s fast-paced industrialization and reliance on coal make it a critical market for carbon footprint solutions. Japan leads in technological advancements, focusing on energy efficiency and renewable energy adoption, supported by government regulations encouraging corporate compliance with emissions reduction targets.
- Several governments in Asia Pacific have established national carbon reduction programs aimed at achieving carbon neutrality in the coming decades. China’s ambitious "Dual Carbon" goal, set in 2023, outlines plan for reducing emissions by transitioning to cleaner energy sources, improving energy efficiency, and developing green infrastructure. These programs are driving the adoption of carbon management solutions, supported by substantial government funding and policy frameworks.
Asia Pacific Carbon Footprint Management Market Segmentation
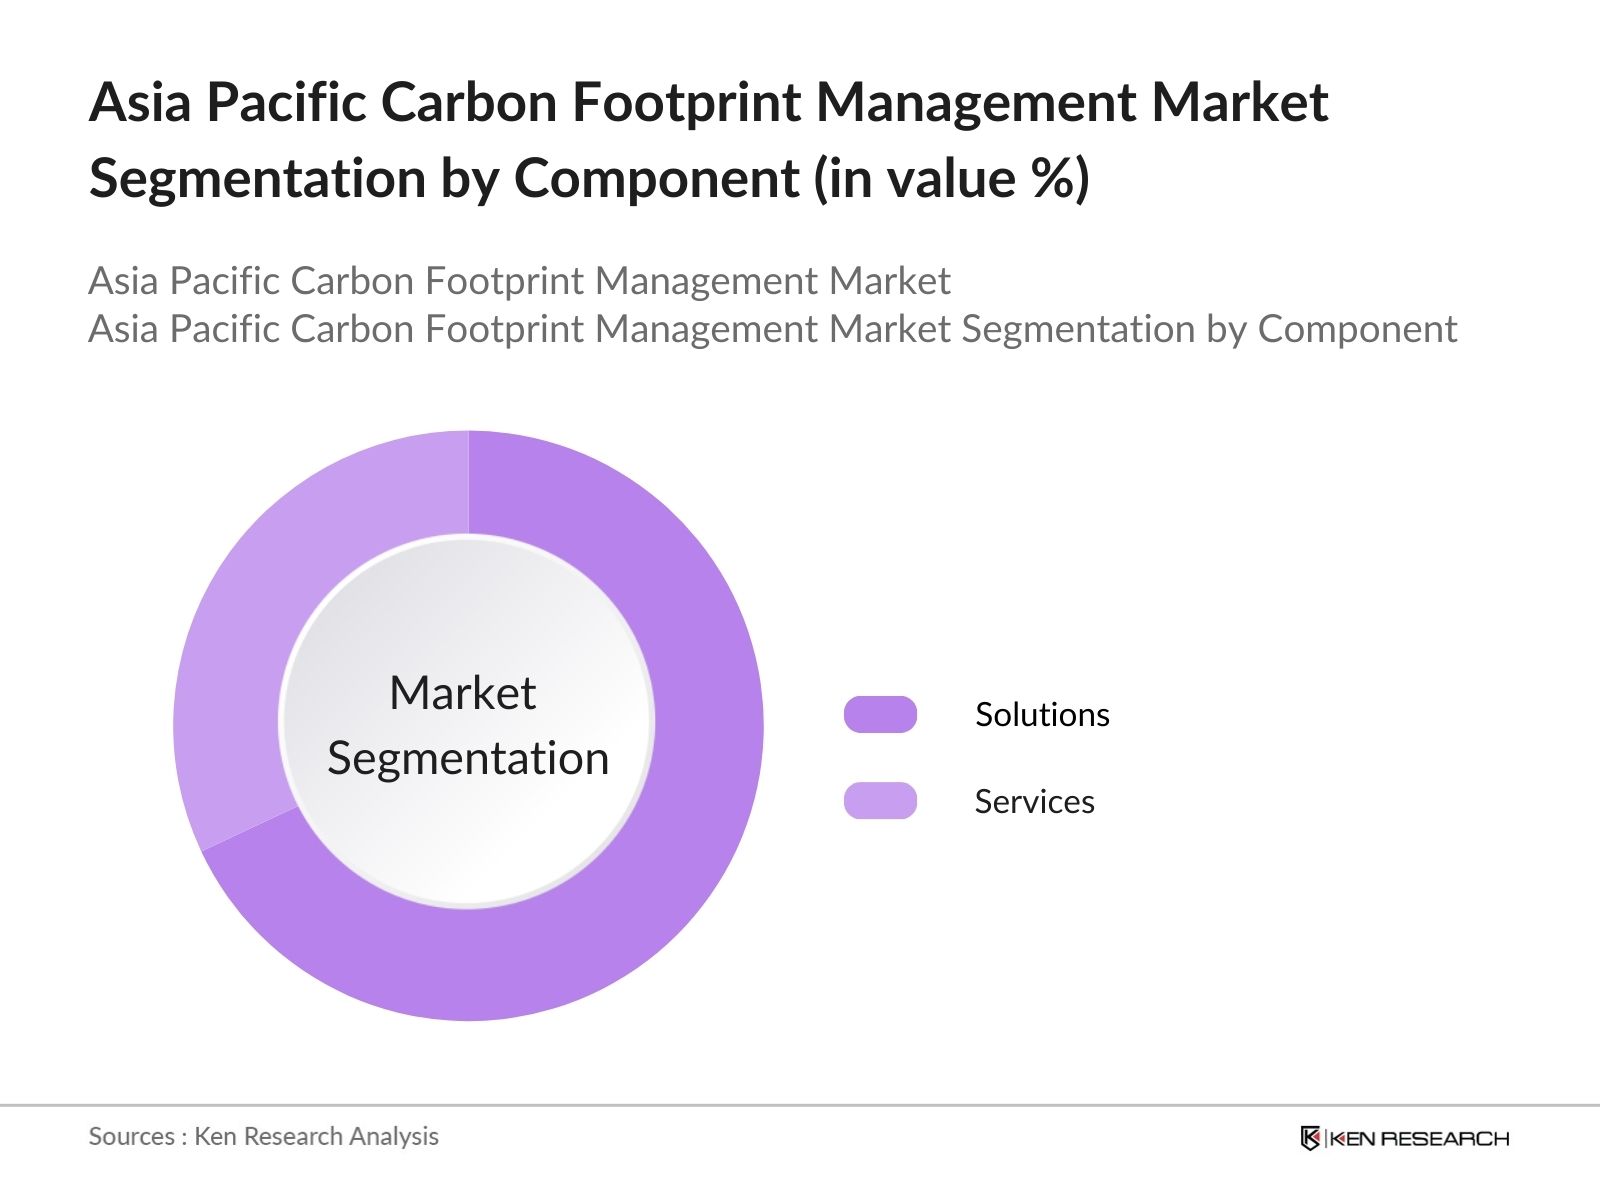
By Component: The Asia Pacific Carbon Footprint Management market is segmented by component into solutions and services. In 2023, solutions dominate the market, holding the largest share. The solutions segment includes various software platforms used by companies to track, monitor, and reduce their carbon emissions. The increasing need for organizations to comply with strict environmental regulations, coupled with the rise of cloud-based platforms, is driving the dominance of the solutions segment.
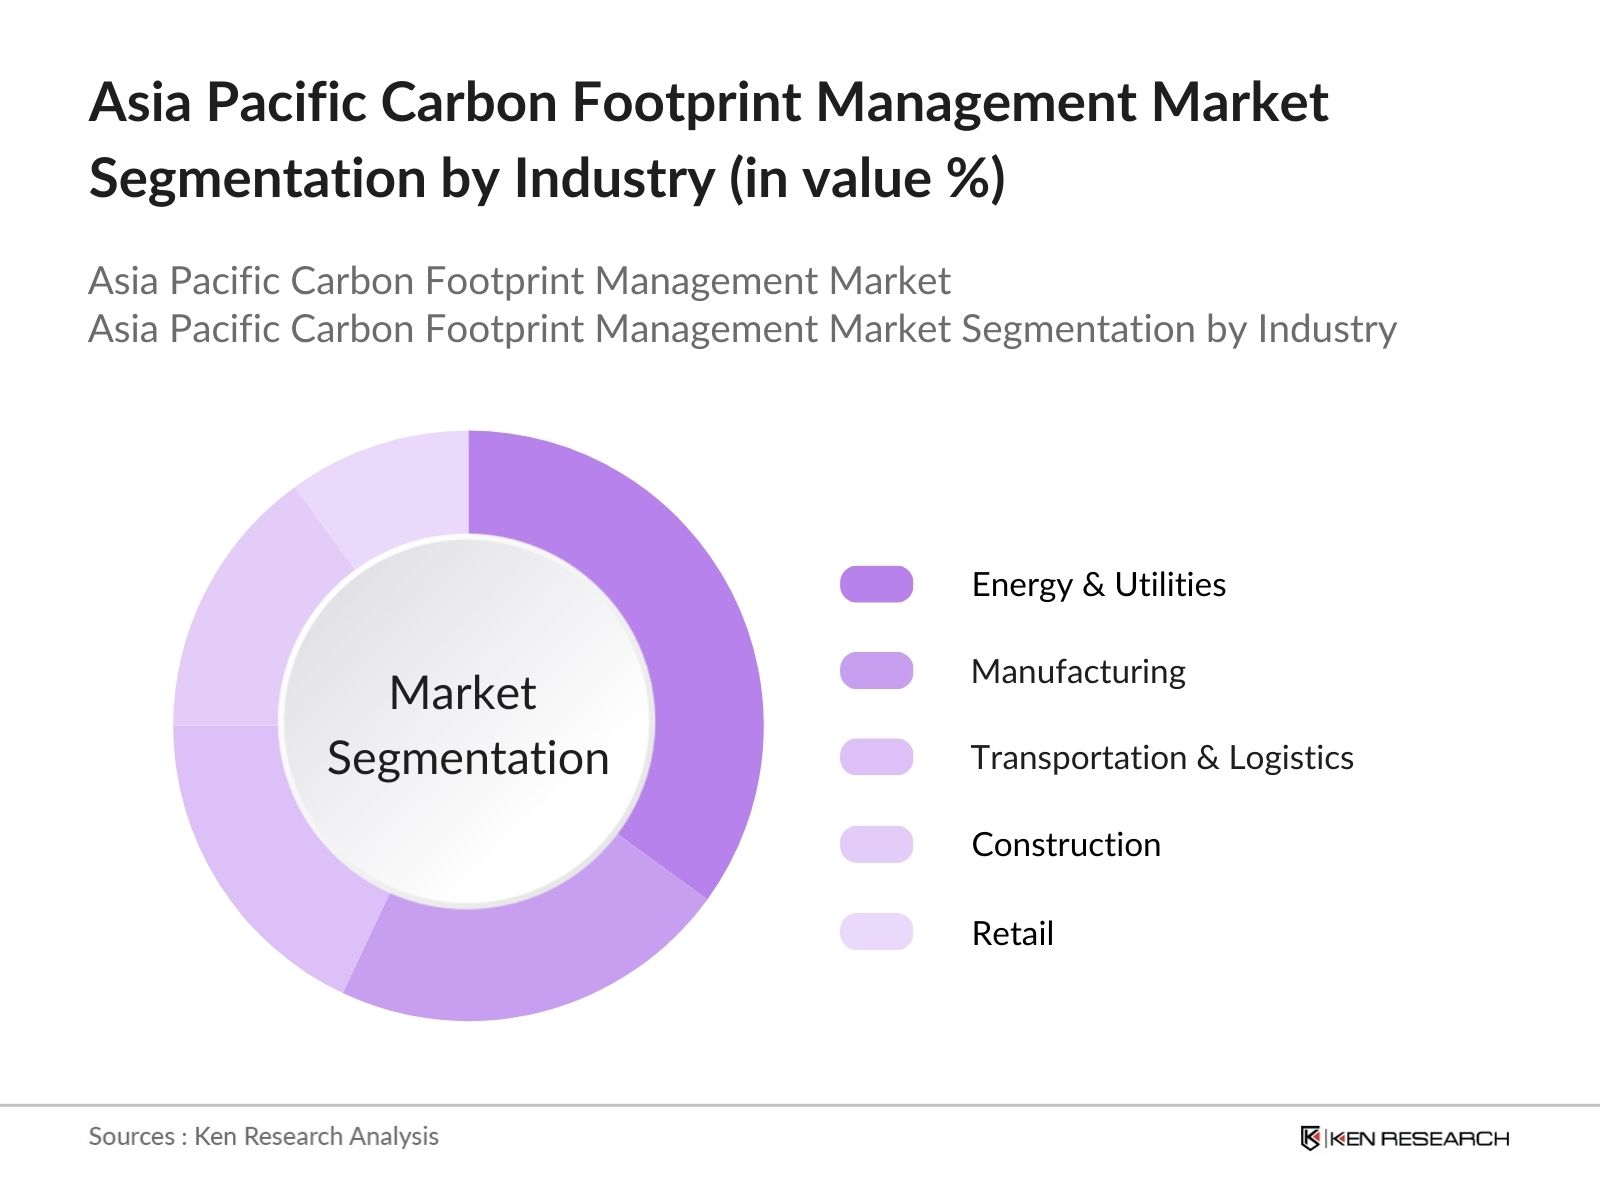
By Industry: The Asia Pacific Carbon Footprint Management market is segmented by industry into energy & utilities, manufacturing, transportation & logistics, construction, and retail. The energy & utilities sector holds the largest market share in 2023. This sector is one of the largest contributors to carbon emissions in the Asia Pacific region, driving the need for carbon management tools. Stringent environmental policies targeting emission reductions in power generation and utilities have pushed energy companies to adopt carbon footprint management solutions.
Asia Pacific Carbon Footprint Management Market Competitive Landscape
The Asia Pacific Carbon Footprint Management market is dominated by a few major players offering comprehensive solutions to tackle the region’s diverse emission challenges. Companies such as Schneider Electric, Enablon, and IBM provide cutting-edge platforms that integrate IoT, AI, and data analytics to help corporations manage their carbon footprint efficiently. The presence of regional players like Carbon Trust adds localized expertise, especially in regulatory compliance. This consolidation of large, established players reflects the market’s growing complexity, where innovation and adherence to environmental regulations play critical roles.
| Company Name | Establishment Year | Headquarters | Global Reach | No. of Employees | Key Focus Areas | Technological Capabilities | Sustainability Certifications | M&A Activity | Market Share |
|---|---|---|---|---|---|---|---|---|---|
| Schneider Electric | 1836 | Rueil-Malmaison, FR | - | - | - | - | - | - | - |
| Enablon | 2000 | Paris, FR | - | - | - | - | - | - | - |
| IBM Corporation | 1911 | New York, USA | - | - | - | - | - | - | - |
| SAP SE | 1972 | Walldorf, DE | - | - | - | - | - | - | - |
| Carbon Trust | 2001 | London, UK | - | - | - | - | - | - | - |
Asia Pacific Carbon Footprint Management Market Analysis
Growth Drivers
- Government Emission Reduction Targets: Governments across Asia Pacific have committed to reducing greenhouse gas emissions as part of international agreements like the Paris Agreement. For instance, China’s government has set a target to achieve peak carbon emissions by 2030 and carbon neutrality by 2060, which has led to significant policy shifts towards cleaner energy sources. In India, the government has pledged to reduce its carbon intensity by 33-35% from 2005 levels by 2030. This regulatory push is a major driver of carbon footprint management efforts across the region.
- Corporate Sustainability Goals: Corporate giants in Asia Pacific are increasingly integrating sustainability into their business models. In 2024, 60% of companies in the region reported implementing formal carbon reduction strategies to align with global sustainability standards. Japan’s leading corporations, like Toyota and Sony, have set ambitious carbon neutrality goals for 2050, driving demand for carbon management solutions.
- Rising Public Awareness of Environmental Impact: Public awareness of climate change and environmental impact has surged in Asia Pacific, prompting a shift in both consumer behavior and corporate responsibility. A 2023 survey by the World Economic Forum found that 65% of consumers in urban areas across China, India, and Japan actively seek products with lower carbon footprints. This rising demand for environmentally responsible products is influencing corporate sustainability initiatives and encouraging businesses to adopt carbon management practices.
Challenges
- High Implementation Costs: Carbon pricing is being implemented or considered in several Asian countries like Singapore, Japan, South Korea, China, Indonesia, etc. Singapore has a carbon tax starting at $3.70/tCO2e in 2019 which will increase to $37-60/tCO2e by 2030. Japan has a carbon tax of $2.40/tCO2e. These high upfront costs, coupled with ongoing operational expenses, act as barriers for widespread adoption.
- Complex Regulatory Framework: Countries like China and South Korea have robust emissions trading systems, while others, such as Vietnam, are still in the early stages of developing such frameworks. This lack of regulatory harmonization makes compliance difficult for multinational corporations operating across different jurisdictions. Furthermore, certification processes for carbon neutrality are time-consuming and costly, as highlighted by Singapore’s Green Plan, which identified certification delays as a key obstacle in 2023.
Asia Pacific Carbon Footprint Management Market Future Outlook
The Asia Pacific Carbon Footprint Management market is expected to experience significant growth over the next five years, driven by a combination of regulatory pressures, corporate sustainability goals, and technological innovations. Governments across the region are introducing stricter carbon emission policies, which are encouraging organizations to adopt carbon management solutions. Meanwhile, the increasing use of AI and IoT technologies in tracking and reducing carbon emissions will drive growth. Furthermore, as industries continue to transition to renewable energy sources, the demand for carbon footprint management solutions is projected to rise significantly.
Market Opportunities
- Integration of AI and IoT for Carbon Tracking and Monitoring: Artificial Intelligence (AI) and Internet of Things (IoT) technologies present significant opportunities for enhancing carbon tracking and monitoring capabilities in Asia Pacific. Singapore, a leading tech hub in Asia, has invested $10 billion in smart infrastructure projects, which include IoT-driven carbon management solutions. These technologies provide detailed insights into emission patterns and allow for more efficient regulatory compliance, paving the way for widespread adoption in other sectors, including logistics and energy.
- Growing Carbon Offset Markets: The carbon offset markets in Asia Pacific are gaining momentum, driven by both voluntary corporate initiatives and regulatory compliance requirements. In 2023, the total value of traded carbon credits in the region’s compliance markets exceeded $500 million, with China’s national carbon market accounting for a significant portion of this trade. Additionally, voluntary markets in countries like India and Japan have seen substantial growth, with an increasing number of corporations purchasing offsets to meet their carbon neutrality goals.
Scope of the Report
|
Segment |
Sub-segment |
|
Component |
Solutions Services |
|
Deployment Mode |
On-Premise Cloud-Based |
|
Industry |
Energy & Utilities Manufacturing Transportation & Logistics Construction Retail |
|
Carbon Type |
Direct Emissions (Scope 1) Indirect Emissions (Scope 2 & 3) |
|
Country |
China India Japan South Korea Australia |
Products
Key Target Audience
- Energy and Utility Companies
- Transportation and Logistics Firms
- Manufacturing & Industrial Companies
- Construction Companies
- Retail and Consumer Goods Firms
- Investors and Venture Capitalist Firms
- Government and Regulatory Bodies (e.g., Ministry of Environment, Forest, and Climate Change)
Companies
Major Players
- Schneider Electric
- Enablon
- IBM Corporation
- SAP SE
- Dakota Software
- Salesforce.com, Inc.
- Accenture
- ENGIE Impact
- Carbon Trust
- Carbon Analytics
- Verdafero Inc.
- Trinity Consultants
- FirstCarbon Solutions
- Ecometrica
- ClimatePartner GmbH
Table of Contents
1. Asia Pacific Carbon Footprint Management Market Overview
1.1. Definition and Scope
1.2. Market Taxonomy
1.3. Market Growth Rate
1.4. Market Segmentation Overview
2. Asia Pacific Carbon Footprint Management Market Size (In USD Bn)
2.1. Historical Market Size
2.2. Year-On-Year Growth Analysis
2.3. Key Market Developments and Milestones
3. Asia Pacific Carbon Footprint Management Market Analysis
3.1. Growth Drivers
3.1.1. Government Emission Reduction Targets
3.1.2. Corporate Sustainability Goals
3.1.3. Increasing Investments in Green Technologies
3.1.4. Rising Public Awareness of Environmental Impact
3.2. Market Challenges
3.2.1. High Implementation Costs (Initial Setup and Technology Adoption)
3.2.2. Lack of Skilled Professionals (Technical Knowledge in Carbon Management)
3.2.3. Complex Regulatory Framework (Compliance and Certification Challenges)
3.3. Opportunities
3.3.1. Integration of AI and IoT for Carbon Tracking and Monitoring
3.3.2. Growing Carbon Offset Markets (Voluntary and Compliance Markets)
3.3.3. Increased Adoption of Carbon Pricing Mechanisms (Carbon Taxes, Cap-and-Trade Systems)
3.4. Trends
3.4.1. Adoption of Blockchain for Carbon Footprint Transparency
3.4.2. Shift Towards Renewable Energy Solutions for Carbon Reduction
3.4.3. Integration with Corporate ESG Reporting Systems
3.5. Government Regulations
3.5.1. National Carbon Emission Reduction Programs (Carbon Neutrality Targets)
3.5.2. Regional Carbon Trading Systems (Emissions Trading Schemes)
3.5.3. Public-Private Partnerships for Green Infrastructure Development
3.6. SWOT Analysis
3.7. Stakeholder Ecosystem (Regulators, Service Providers, Corporations, NGOs)
3.8. Porter’s Five Forces Analysis
3.9. Competition Ecosystem (Key Market Players and Regional Competitiveness)
4. Asia Pacific Carbon Footprint Management Market Segmentation
4.1. By Component (In Value %)
4.1.1. Solutions
4.1.2. Services
4.2. By Deployment Mode (In Value %)
4.2.1. On-Premise
4.2.2. Cloud-Based
4.3. By Industry (In Value %)
4.3.1. Energy & Utilities
4.3.2. Manufacturing
4.3.3. Transportation & Logistics
4.3.4. Construction
4.3.5. Retail
4.4. By Carbon Type (In Value %)
4.4.1. Direct Emissions (Scope 1)
4.4.2. Indirect Emissions (Scope 2 & 3)
4.5. By Country (In Value %)
4.5.1. China
4.5.2. India
4.5.3. Japan
4.5.4. South Korea
4.5.5. Australia
5. Asia Pacific Carbon Footprint Management Market Competitive Analysis
5.1 Detailed Profiles of Major Companies
5.1.1. Enablon
5.1.2. Schneider Electric SE
5.1.3. IBM Corporation
5.1.4. SAP SE
5.1.5. Dakota Software
5.1.6. Salesforce.com, Inc.
5.1.7. Accenture
5.1.8. ENGIE Impact
5.1.9. Carbon Trust
5.1.10. Carbon Analytics
5.1.11. Verdafero Inc.
5.1.12. Trinity Consultants
5.1.13. FirstCarbon Solutions
5.1.14. Ecometrica
5.1.15. ClimatePartner GmbH
5.2 Cross Comparison Parameters (Headquarters, Global Revenue, No. of Employees, Solutions Offered, Geographic Presence, Sustainability Certifications, M&A Activity, ESG Impact)
5.3 Market Share Analysis
5.4 Strategic Initiatives
5.5 Mergers and Acquisitions
5.6 Investment Analysis
5.7 Venture Capital Funding
5.8 Government Grants and Subsidies
5.9 Private Equity Investments
6. Asia Pacific Carbon Footprint Management Market Regulatory Framework
6.1. International Standards and Protocols (Paris Agreement, IPCC Guidelines)
6.2. Regional Carbon Pricing Mechanisms (Carbon Taxes, Emission Trading Schemes)
6.3. Certification Processes (ISO 14064, PAS 2060)
7. Asia Pacific Carbon Footprint Management Future Market Size (In USD Bn)
7.1. Future Market Size Projections
7.2. Key Factors Driving Future Market Growth
8. Asia Pacific Carbon Footprint Management Future Market Segmentation
8.1. By Component (In Value %)
8.2. By Deployment Mode (In Value %)
8.3. By Industry (In Value %)
8.4. By Carbon Type (In Value %)
8.5. By Country (In Value %)
9. Asia Pacific Carbon Footprint Management Market Analysts’ Recommendations
9.1. TAM/SAM/SOM Analysis
9.2. Carbon Reduction Strategy Recommendations
9.3. Technological Partnerships and Collaborations
9.4. White Space Opportunity Analysis
Disclaimer
Contact Us
Research Methodology
Step 1: Identification of Key Variables
The first step involved mapping the entire ecosystem of the Asia Pacific Carbon Footprint Management Market. This was done through comprehensive desk research, using both secondary and proprietary sources to capture relevant market information. Key variables such as carbon pricing mechanisms, industrial emissions, and regulatory compliance were identified.
Step 2: Market Analysis and Construction
This phase focused on analyzing historical data related to the market’s growth and performance. Specific focus was placed on penetration of carbon management solutions across industries like energy and transportation. The gathered data was used to construct models to estimate market size and segment shares.
Step 3: Hypothesis Validation and Expert Consultation
Through detailed consultations with industry leaders and experts, the research team validated the market hypotheses and projections. Expert interviews provided deep insights into operational, regulatory, and financial drivers within the market, ensuring the accuracy of the data.
Step 4: Research Synthesis and Final Output
Finally, the research team synthesized all the collected data and expert inputs to produce the final output, which was thoroughly verified using bottom-up and top-down approaches. This ensured a high level of accuracy and reliability in the market forecast and segment analysis.
Frequently Asked Questions
01 How big is the Asia Pacific Carbon Footprint Management Market?
The Asia Pacific Carbon Footprint Management market is valued at USD 6 billion, driven by increasing governmental regulations and corporate sustainability goals.
02 What are the challenges in the Asia Pacific Carbon Footprint Management Market?
The primary challenges of Asia Pacific Carbon Footprint Management Market include high implementation costs, the complexity of regulatory frameworks across different countries, and the need for skilled professionals to manage carbon management platforms effectively.
03 Who are the major players in the Asia Pacific Carbon Footprint Management Market?
Key players of Asia Pacific Carbon Footprint Management Market include Schneider Electric, Enablon, IBM Corporation, SAP SE, and Carbon Trust, all offering cutting-edge solutions to monitor and reduce carbon emissions.
04 What drives the Asia Pacific Carbon Footprint Management Market?
Asia Pacific Carbon Footprint Management Market is driven by stringent environmental policies, corporate sustainability commitments, technological advancements in carbon monitoring, and growing public awareness of climate change.
Why Buy From Us?
 Framework")
What makes us stand out is that our consultants follows Robust, Refine and Result (RRR) methodology. i.e. Robust for clear definitions, approaches and sanity checking, Refine for differentiating respondents facts and opinions and Result for presenting data with story

We have set a benchmark in the industry by offering our clients with syndicated and customized market research reports featuring coverage of entire market as well as meticulous research and analyst insights.

While we don't replace traditional research, we flip the method upside down. Our dual approach of Top Bottom & Bottom Top ensures quality deliverable by not just verifying company fundamentals but also looking at the sector and macroeconomic factors.

With one step in the future, our research team constantly tries to show you the bigger picture. We help with some of the tough questions you may encounter along the way: How is the industry positioned? Best marketing channel? KPI's of competitors? By aligning every element, we help maximize success.

Our report gives you instant access to the answers and sources that other companies might choose to hide. We elaborate each steps of research methodology we have used and showcase you the sample size to earn your trust.

If you need any support, we are here! We pride ourselves on universe strength, data quality, and quick, friendly, and professional service.