CHAPTER 1 - MARKET SUMMARY
Market Overview
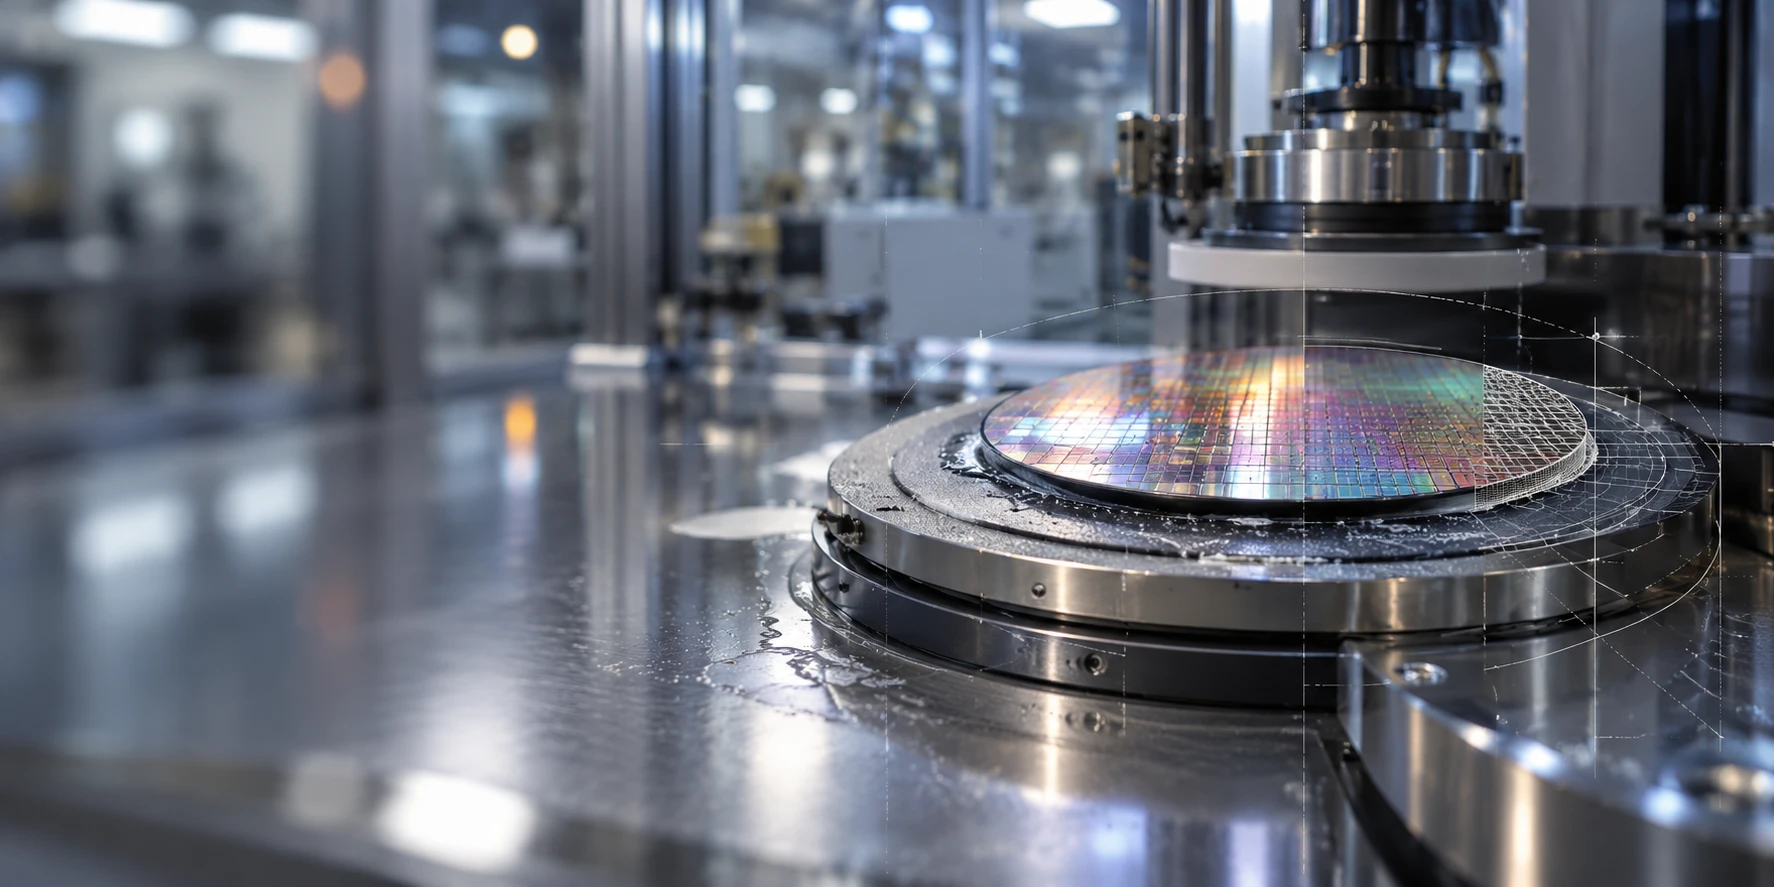
Chemical mechanical planarization combines slurry chemistry, a polishing pad, controlled pressure, and post-process cleaning to flatten semiconductor layers. Equipment revenue follows fab investment cycles, while consumables recur as wafers pass through qualified process steps. In the supplied market model, consumables represented 62% of Asia Pacific CMP revenue in 2024. That recurring component makes installed tool utilization as important as new tool orders to a supplier's commercial outlook.
Demand is geographically concentrated near high-volume fabs and their qualification teams. China was the largest modeled CMP consumption market in Asia Pacific in 2024, followed by Taiwan and South Korea. Separately, semiconductor equipment billings across those three economies reached 79% of the worldwide total in 2025. Close technical support matters because a slurry, pad, or cleaning formulation must meet each customer's removal-rate, defect, and yield requirements.
Market Value
USD 3,711 Mn
2025, Asia Pacific
Dominant Region
China
2025, Asia Pacific
Dominant Segment
CMP consumables
2025, Asia Pacific
Total Number of Players
10
2025, profiled players
Future Outlook
The market is projected to reach USD 6,569 Mn in 2032 from its USD 3,711 Mn 2025 base, equivalent to a 8.50% CAGR over 2025-2032. This is an extension of the supplied market-size model, which establishes the 2024 anchor and annual values through 2030. The estimated historical CAGR is 7.88% over 2020-2025; earlier years were backcast for this report and are less directly anchored than the supplied 2024 and 2025 values. The forecast assumes continued wafer-start growth, a richer process mix, and recurring material purchases from the expanding installed base.
Growth is unlikely to be uniform across products or countries. Consumable revenue benefits when qualified tools run at higher utilization; equipment demand depends more directly on new capacity and replacement decisions. China's mature-node expansion, Taiwan's advanced foundry investment, and South Korea's memory investment create different qualification and service requirements. Semiconductor equipment billings rose to USD 135.1 Bn worldwide in 2025, with Taiwan's billings rising particularly sharply; this supports the demand setting but is broader than CMP and should not be read as a CMP market-size measure.
8.50%
Forecast CAGR
USD 6,569 Mn
2030 Projection
Base Year
2025
Historical Period
2020-2025
Forecast Period
2025-2032
Historical CAGR
7.88%
CHAPTER 2 - SCOPE OF REPORT
Scope of the Market
CHAPTER 3 - Key Stakeholders
Key Target Audience
Key stakeholders can use this analysis for investment, strategy, procurement, and operational planning.
Investors
Consumables recurrence, tool cycles, qualification risk, margin resilience
Corporates
Process coverage, fab procurement, supplier concentration, regional expansion
Government
Semiconductor capacity, materials localization, export compliance, supply resilience
Operators
Removal uniformity, defectivity, uptime, cleaning, cost per wafer
Financial institutions
Capital intensity, customer concentration, contract duration, scenario sensitivity
CHAPTER 4 - Market Size & Growth
Market Size, Growth Forecast and Trends
This section evaluates historical market size, year-over-year growth, and forecast projections using a consumption-based Asia Pacific scope. Values from 2024 through 2030 follow the supplied market model; 2020-2023 are analytical backcasts, while 2031-2032 extend its base-case trajectory.
Historical & Projected Market Size ($ Million)
Year-over-Year Growth Rate (%)
Market Value vs Volume Growth (%)
Historical Market Performance (2020-2025)
The modeled series reflects a 2021-2022 expansion, a 2023 correction, and recovery through the report base year. The 2023 decline of 2.50% is directionally consistent with SEMI's reported 1.3% fall in worldwide semiconductor equipment billings in 2023; the two measures have different scopes and should not be treated as identical. The 2024 CMP anchor is the supplied analyst estimate. Semiconductor equipment billings subsequently increased worldwide in 2024 and 2025, supporting the direction of the 2025 CMP estimate.
Forecast Market Outlook (2025-2032)
At 8.50% annual compound growth, the market adds USD 2,858 Mn between the 2025 base and 2032 endpoint. The forecast combines an assumed 4.5% yearly increase in the wafer-activity index with an approximately 3.83% increase in modeled value per activity unit; their compounded effect is about 8.5%. This is a blended market bridge, not a quoted wafer price. Material mix, process complexity, utilization, and equipment cycles can cause annual results to depart from the smooth base case.
CHAPTER 5 - Market Data
Market Breakdown
Recurring consumables and fab-investment-driven equipment contribute differently to the market trajectory. The index and segment shares below make those operating assumptions explicit for investment and procurement planning.
Year | Market Size (USD Mn) | YoY Growth (%) | Wafer-Activity Index (2024=100) | Consumables Share (%) | China Share (%) | Period |
|---|---|---|---|---|---|---|
| 2020 | $2,540 Mn | +- | - | - | Forecast | |
| 2021 | $2,890 Mn | +13.78 | - | - | Forecast | |
| 2022 | $3,200 Mn | +10.73 | - | - | Forecast | |
| 2023 | $3,120 Mn | +-2.50 | - | - | Forecast | |
| 2024 | $3,420 Mn | +9.62 | 100.0 | 62.0 | Forecast | |
| 2025 | $3,711 Mn | +8.51 | 104.5 | 62.4 | Forecast | |
| 2026 | $4,026 Mn | +8.49 | 109.2 | 62.7 | Forecast | |
| 2027 | $4,368 Mn | +8.49 | 114.1 | 63.0 | Forecast | |
| 2028 | $4,740 Mn | +8.52 | 119.3 | 63.4 | Forecast | |
| 2029 | $5,143 Mn | +8.50 | 124.6 | 63.7 | Forecast | |
| 2030 | $5,580 Mn | +8.50 | 130.2 | 64.0 | Forecast | |
| 2031 | $6,054 Mn | +8.49 | 136.1 | 64.2 | Forecast | |
| 2032 | $6,569 Mn | +8.51 | 142.2 | 64.5 | Forecast |
Wafer-Activity Index
104.5 (2025, Asia Pacific; 2024=100). The modeled index links recurring material demand to fab activity. SEMI reported that worldwide installed fab capacity exceeded 42 million 300mm-equivalent wafers per quarter in Q4 2024; that is capacity, not this report's actual-start index.
Consumables Share
62.4% (2025, Asia Pacific; modeled). A larger recurring pool rewards process qualification and stable yield. Qnity identifies pads, slurries, and post-CMP cleaners as distinct CMP offerings, illustrating the breadth of materials attached to an installed tool base.
China Share
31.0% (2025, Asia Pacific; modeled). Local qualification capacity affects suppliers' access to this demand. China's semiconductor equipment billings were USD 49.3 Bn in 2025; that broader equipment statistic supports the scale of fab investment but is not a CMP revenue figure.
CHAPTER 6 - Segmentation
Market Segmentation Framework
Seven dimensions distinguish what fabs buy, where a CMP step occurs, who approves the purchase, and how suppliers deliver qualified products. Axes are alternative views of the same market and must not be added together.
No of Segments
7
Dominant Segment
CMP Consumables
Fastest Growing Segment
Advanced Packaging
Product Type
Application
Process Stage
Customer Type
Sales Channel
Technology
Geography
CHAPTER 7 - Regional Analysis
Regional Analysis
China, Taiwan, South Korea, and Japan account for most modeled Asia Pacific CMP consumption. The country comparison uses the supplied 2024 geographic allocation as its starting point and distributes 2025 growth across markets; country CMP values are estimates, while semiconductor equipment billings are independently reported broader indicators.
Largest Country Market
China, 1st (2025 modeled CMP value)
China CMP Market Size
USD 1,150 Mn (2025 modeled)
Asia Pacific CAGR (2025-2032)
8.50%
Largest Country Market
China, 1st (2025 modeled CMP value)
China CMP Market Size
USD 1,150 Mn (2025 modeled)
Asia Pacific CAGR (2025-2032)
8.50%
Regional Analysis (Current Year)
Regional Analysis Comparison
| Metric | China | Taiwan | South Korea | Japan | Singapore |
|---|---|---|---|---|---|
| CMP Market Size (USD Mn, 2025 modeled) | 1,150 | 1,058 | 835 | 371 | 160 |
| CMP CAGR (%, 2025-2032) | - | - | - | - | - |
Market Position
China ranks first in the modeled CMP comparison, with USD 1,150 Mn in 2025. Its USD 49.3 Bn of broader semiconductor equipment billings indicates a large local qualification and service opportunity.
Growth Advantage
Taiwan's semiconductor equipment billings rose 90% in 2025, versus 26% in South Korea. These are equipment-cycle indicators; they do not establish different country CMP CAGRs for the report forecast.
Competitive Strengths
The region combines China's equipment scale, Taiwan's advanced foundry and packaging base, and South Korea's memory investment. Together, the three represented 79% of worldwide equipment billings in 2025.
CHAPTER 8 - INDUSTRY ANALYSIS
Growth Drivers, Challenges & Opportunities
Wafer capacity, process complexity, material qualification, and trade controls shape the Asia Pacific Chemical Mechanical Planarization Market. The following indicators describe the wider semiconductor setting and the mechanisms through which it can affect CMP purchases.
Growth Drivers
Advanced Foundry Investment
- Billings rose 90% (2025, Taiwan), increasing the commercial value of local installation, process engineering, and parts support for equipment vendors.
- TSMC reported annual managed capacity of approximately 17 million 12-inch-equivalent wafers (2024, company); qualified consumables can generate repeat sales as that capacity runs.
- Worldwide wafer-processing equipment sales increased 12% (2025, global), supporting suppliers' fab-facing demand environment without equating the entire category with CMP.
Memory and High-Bandwidth Architectures
- Its billings increased 26% (2025, South Korea), creating potential equipment orders and a larger installed base for qualified consumables.
- SEMI measured 56% year-over-year growth in memory capital expenditure in Q4 2024 (global); CMP suppliers benefit where that spending converts into running capacity.
- Memory represented 38% (2024, modeled Asia Pacific CMP application value) in the supplied analysis; higher utilization has a direct bearing on recurring pad and slurry purchases.
Advanced Packaging Integration
- Advanced Packaging contributed 13% (2024, modeled Asia Pacific CMP application value); suppliers can target via, redistribution, and bonding-surface qualifications.
- TSMC described CoWoS and SoIC in its 2025 annual report (company), indicating multiple integration flows with distinct materials and process-control needs.
- Qnity introduced a next-generation pad platform in 2025 (company); successful qualification, rather than a product announcement alone, determines recurring commercial uptake.
Market Challenges
Equipment-Cycle Volatility
- Equipment suppliers face order-timing risk when billings shift between years; the 2023 global decline (SEMI) shows why a straight-line CMP tool forecast requires scenario testing.
- China's billings were almost flat at USD 49.3 Bn (2025, China) despite strong growth in Taiwan, illustrating why regional totals can mask different procurement cycles.
- The modeled equipment component was 37.6% (2025, Asia Pacific CMP value); suppliers concentrated in that component have greater exposure to order deferrals than recurring-material specialists.
Qualification and Defect Control
- Slurry chemistry and pad behavior affect removal uniformity; Entegris identifies three linked CMP elements (2025, supplier portfolio): slurries, pads, and cleaning formulations.
- EBARA states that its F-REX300XA uses approximately 10% less power than its preceding F-REX300X model (product specification); total cost of ownership can shape tool selection alongside process performance.
- Qnity's 2025 CMP portfolio (company) covers pads, slurries, and post-CMP cleans; changing one input can require new customer validation across the integrated process.
Export Controls and Supply Continuity
- Controlled-item classification under 2024 rules (United States) can change licensing and delivery lead times; suppliers must assess the actual product and transaction.
- China represented 31% (2024, modeled Asia Pacific CMP value); disruptions affecting this country would materially change the regional sales mix.
- The rules distinguish specified equipment and end uses under EAR Part 744 (United States); a blanket assumption that all CMP products are prohibited would misstate procurement risk.
Market Opportunities
Locally Qualified Consumable Portfolios
- Bundled slurry, pad, and clean development can improve revenue per qualified line; Qnity markets all three categories (2025, company).
- Domestic manufacturers can benefit from localized qualification; Dinglong reported a month exceeding 40,000 CMP pad unit sales (2025, company).
- Fab adoption requires demonstrated process stability; Entegris describes control of slurry delivery and cleaning as part of its CMP process offering (2025, company).
Advanced Packaging Process Qualification
- Suppliers can monetize tailored bonding-surface preparation as packaging architectures diversify; TSMC lists CoWoS and SoIC (2025, company) among its advanced technologies.
- Packaging manufacturers benefit when planarization and cleaning reduce defects; the modeled application accounted for 13% (2024, Asia Pacific CMP value).
- Commercial realization requires customer-specific validation of via and bonding flows; the broader assembly and packaging equipment category expanded 21% (2025, global).
Tool Productivity and Resource Efficiency
- Equipment suppliers can sell on throughput, uptime, and resource use, subject to customer testing; EBARA identifies a 10% power reduction (product comparison).
- Fabs benefit from lower process cost when removal and defect targets hold; Applied Materials describes in-line metrology and endpoint methods (Reflexion LK product).
- Adoption requires tool and materials co-qualification rather than a standalone efficiency claim; worldwide wafer-processing equipment sales increased 12% (2025, global).
CHAPTER 9 - Competitive Landscape
Competitive Landscape Overview
Competition spans specialized polishing-tool makers and recurring-material suppliers. Fab qualification, defect performance, local technical support, and process-specific intellectual property are significant barriers. Exact Asia Pacific CMP-only revenue is generally undisclosed, so company market shares and a definitive revenue ranking cannot be verified.
Market Share Distribution
Top 5 Players
Market Dynamics
8 new entrants in the past 5 years, indicating strong market attractiveness and growth potential.
Company Name | Market Share | Headquarters | Founding Year | Core Market Focus |
|---|---|---|---|---|
Applied Materials | - | - | - | Reflexion CMP polishing systems |
Qnity Electronics | - | - | - | CMP pads, slurries, and post-CMP cleans |
Entegris | - | - | - | CMP slurries, pads, filtration, and cleaning |
FUJIFILM Electronic Materials | - | - | - | CMP slurries and post-CMP cleaners |
EBARA | - | - | - | F-REX CMP systems |
Fujimi Incorporated | - | - | - | Semiconductor-device CMP abrasives and slurries |
Hwatsing Technology | - | - | - | 300mm CMP equipment |
Hubei Dinglong Holdings | - | - | - | CMP pads, slurries, and cleaning liquids |
Enpulse | - | - | - | CMP polishing pads |
Resonac Holdings | - | - | - | Semiconductor CMP slurries |
Cross Comparison Parameters
The report provides detailed cross-comparison of key players across 10 performance parameters to identify competitive strengths and weaknesses.
Qualified Process Coverage
Defect and Removal Performance
CMP-Specific Revenue Growth
CMP Operating Margin
Analysis Covered
Market Share Analysis:
Compare disclosed positions without assigning unsupported company revenue shares.
Cross Comparison Matrix:
Assess process breadth, qualification, financial disclosure, and regional support.
SWOT Analysis:
Test scale advantages against customer concentration and technology shifts.
Pricing Strategy Analysis:
Compare lifetime tool economics with recurring consumables contract structures.
Company Profiles:
Verify active products and avoid acquired-business double counting.
CHAPTER 10 - REPORT TOC
Table of Contents
Market Assessment Phase
Supply-side and competitive intelligence covering market sizing, segmentation, competitive dynamics, regulatory landscape, and future forecasts.
Go-To-Market Strategy Phase
15 chapters
Entry strategy evaluation, execution roadmap, partner recommendations, and profitability outlook.
Survey Phase
8 chapters
Demand-side primary research designed around structured interviews with fab and supplier specialists to test consumption, qualification, and procurement assumptions.
Complete Report Coverage
201+ detailed sections covering every aspect of the market
143
Assessment Sections
58
Strategy Sections
CHAPTER 11 - Our Approach
Research Methodology
Desk Research
- Review semiconductor equipment regional billings
- Examine CMP supplier product disclosures
- Map foundry memory packaging capacity
- Check export rules and scope
Primary Research
- Target fab CMP process engineers
- Target slurry formulation technical managers
- Target equipment account sales directors
- Target semiconductor procurement category managers
Validation and Triangulation
- Plan approximately 200 expert responses
- Reconcile fab and supplier perspectives
- Check ownership and acquisition overlap
- Test annual values against scenarios
CHAPTER 12 - FAQ
FAQs
Still have questions?
Our research team is here to help you find the right solution
CHAPTER 13 - Related Research
Explore Related Reports
Expand your market intelligence with complementary research across regions and adjacent markets.
Regional/Country ReportsRelated market analysis across key regions
Related market analysis across key regions
No regional reports found.
Adjacent ReportsRelated markets and complementary research
Related markets and complementary research
No adjacent reports found.
500+
Market Research Reports
50+
Countries Covered
15+
Industry Verticals