
Asia Pacific Composites Market Outlook to 2030
Region:Asia
Author(s):Shreya Garg
Product Code:KROD2309
November 2024
98
About the Report
Asia Pacific Composite Market Overview
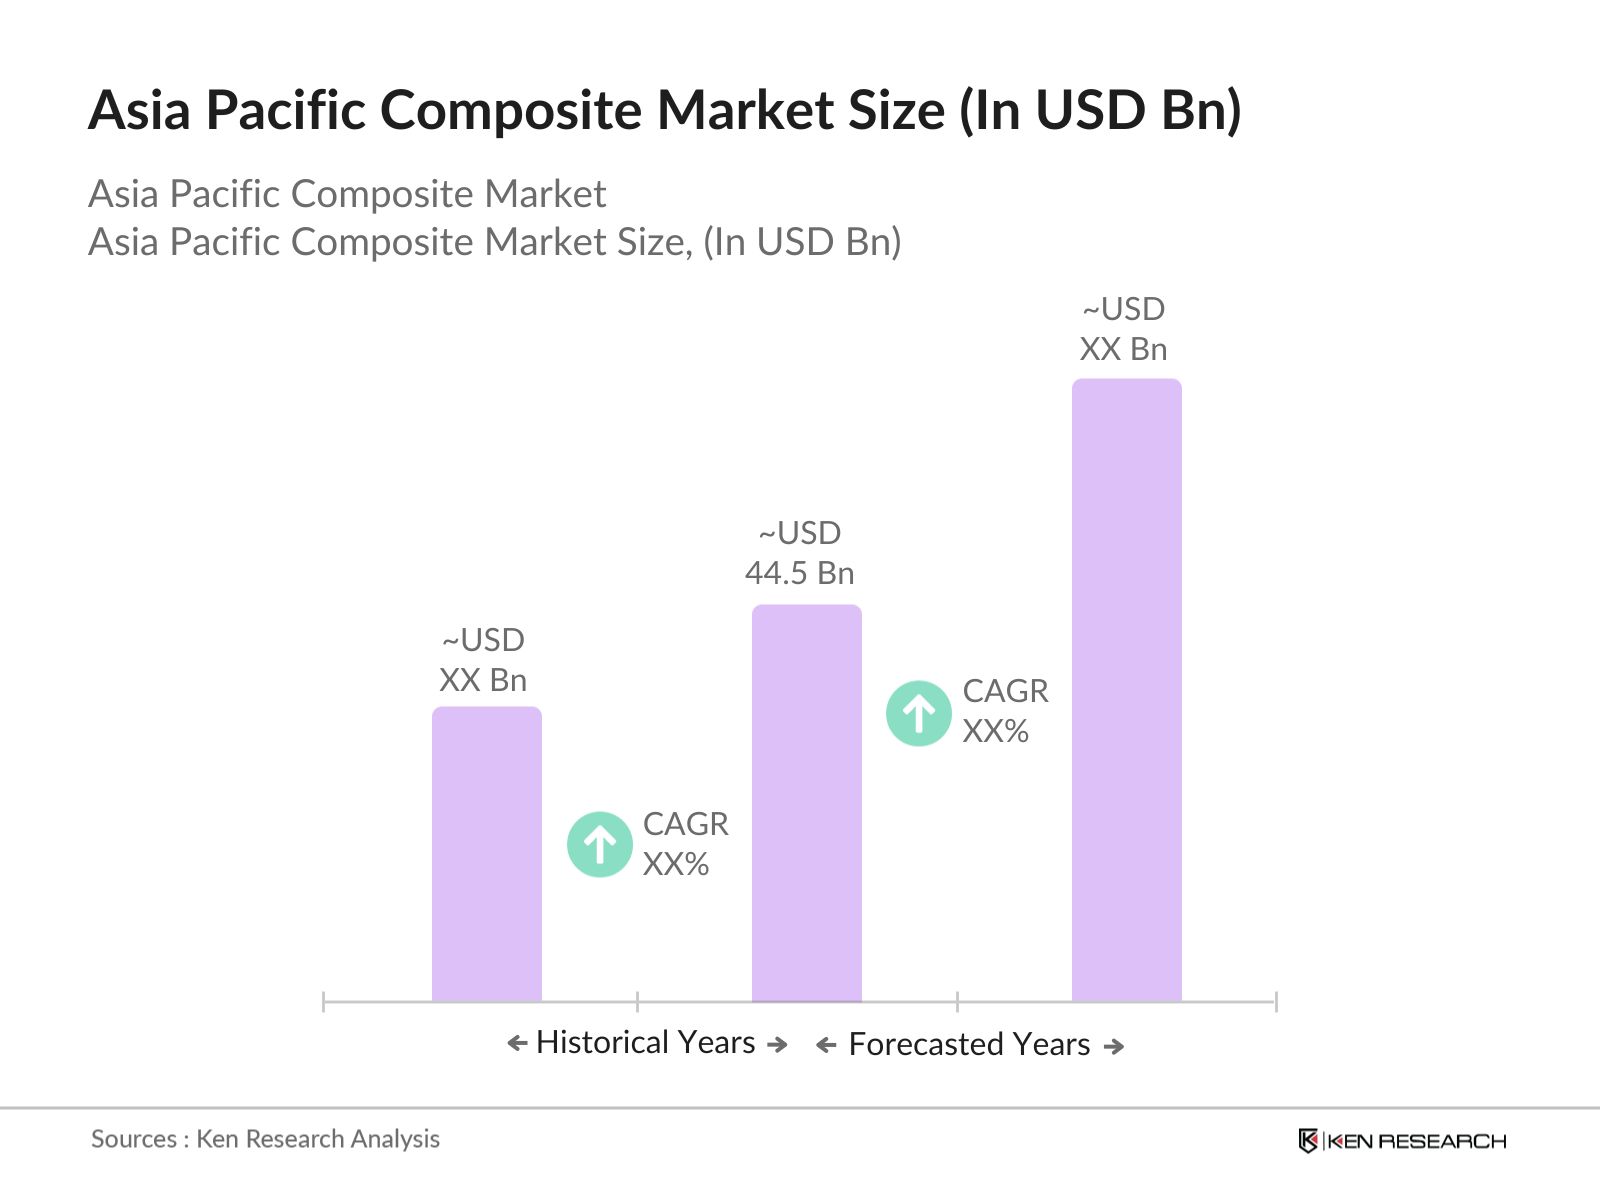
- The Asia Pacific Composite Market is currently valued at USD 44.5 billion, driven by rising demand in aerospace, automotive, and wind energy sectors. The composite materials, known for their lightweight and durability, are essential for improving fuel efficiency and reducing carbon emissions. Additionally, technological advancements in resin systems and fiber production have boosted market adoption. Companies in the region are increasingly investing in research and development to meet the growing demand for high-performance composites, ensuring continued market growth.
- Key countries driving the Asia Pacific Composite Market include China, Japan, and South Korea. China dominates due to its vast manufacturing base, government support for aerospace and automotive industries, and advancements in wind energy projects. Japan and South Korea, with their strong automotive and electronics industries, are also key players. These countries benefit from well-established infrastructure, cutting-edge technology, and strategic investments, contributing to their dominance in the region.
- East African governments are introducing stringent energy efficiency standards for industrial pumps to reduce energy consumption and promote sustainability. Kenyas Energy Act mandates that all new industrial pump installations must meet specific energy efficiency criteria, reducing energy use by an estimated 15%. The adoption of these standards is expected to significantly reduce operational costs for industries in the region. These regulations are aimed at aligning with global energy efficiency goals while reducing carbon footprints.
Asia Pacific Composite Market Segmentation
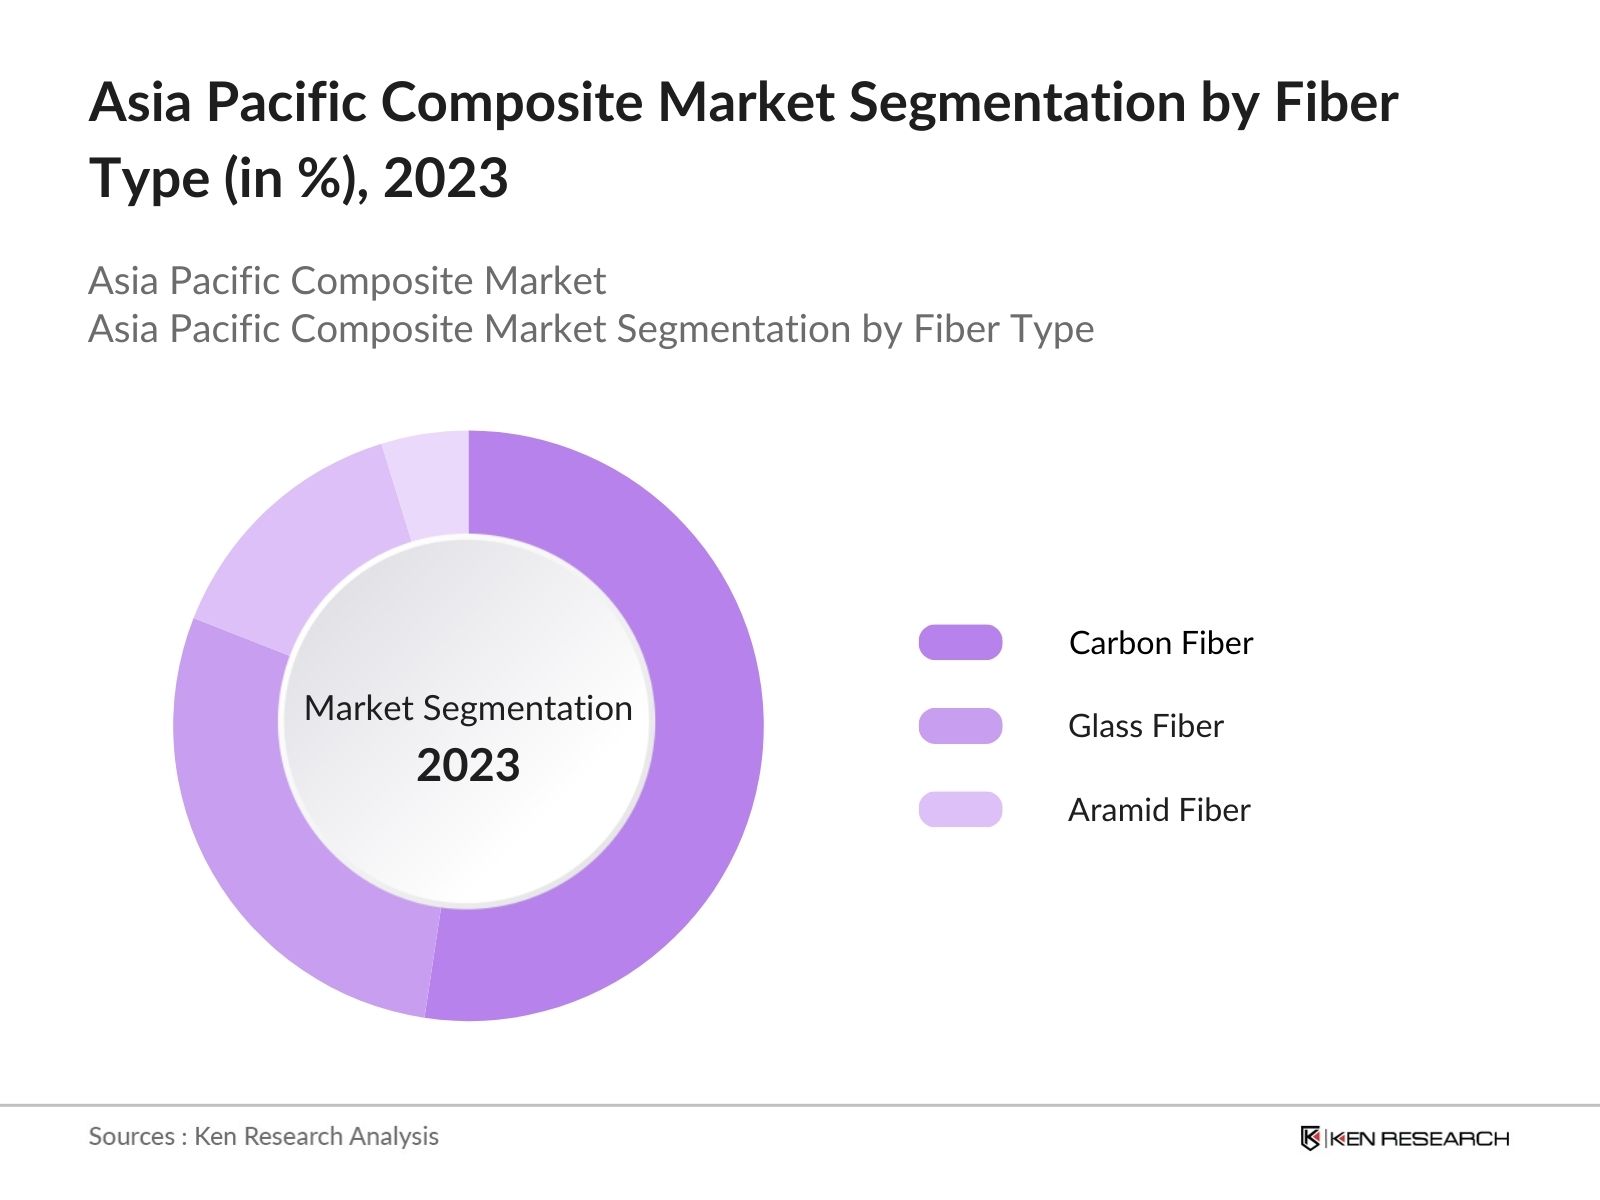
- By Fiber Type: The market is segmented by fiber type into carbon fiber, glass fiber, and aramid fiber. Carbon fiber holds a dominant market share in the region due to its widespread use in high-performance applications like aerospace, automotive, and sports equipment. Its superior strength-to-weight ratio and ability to withstand extreme conditions make it ideal for these sectors. The increasing demand for lightweight materials in electric vehicles and renewable energy solutions, particularly in wind turbines, has further boosted the adoption of carbon fiber composites.
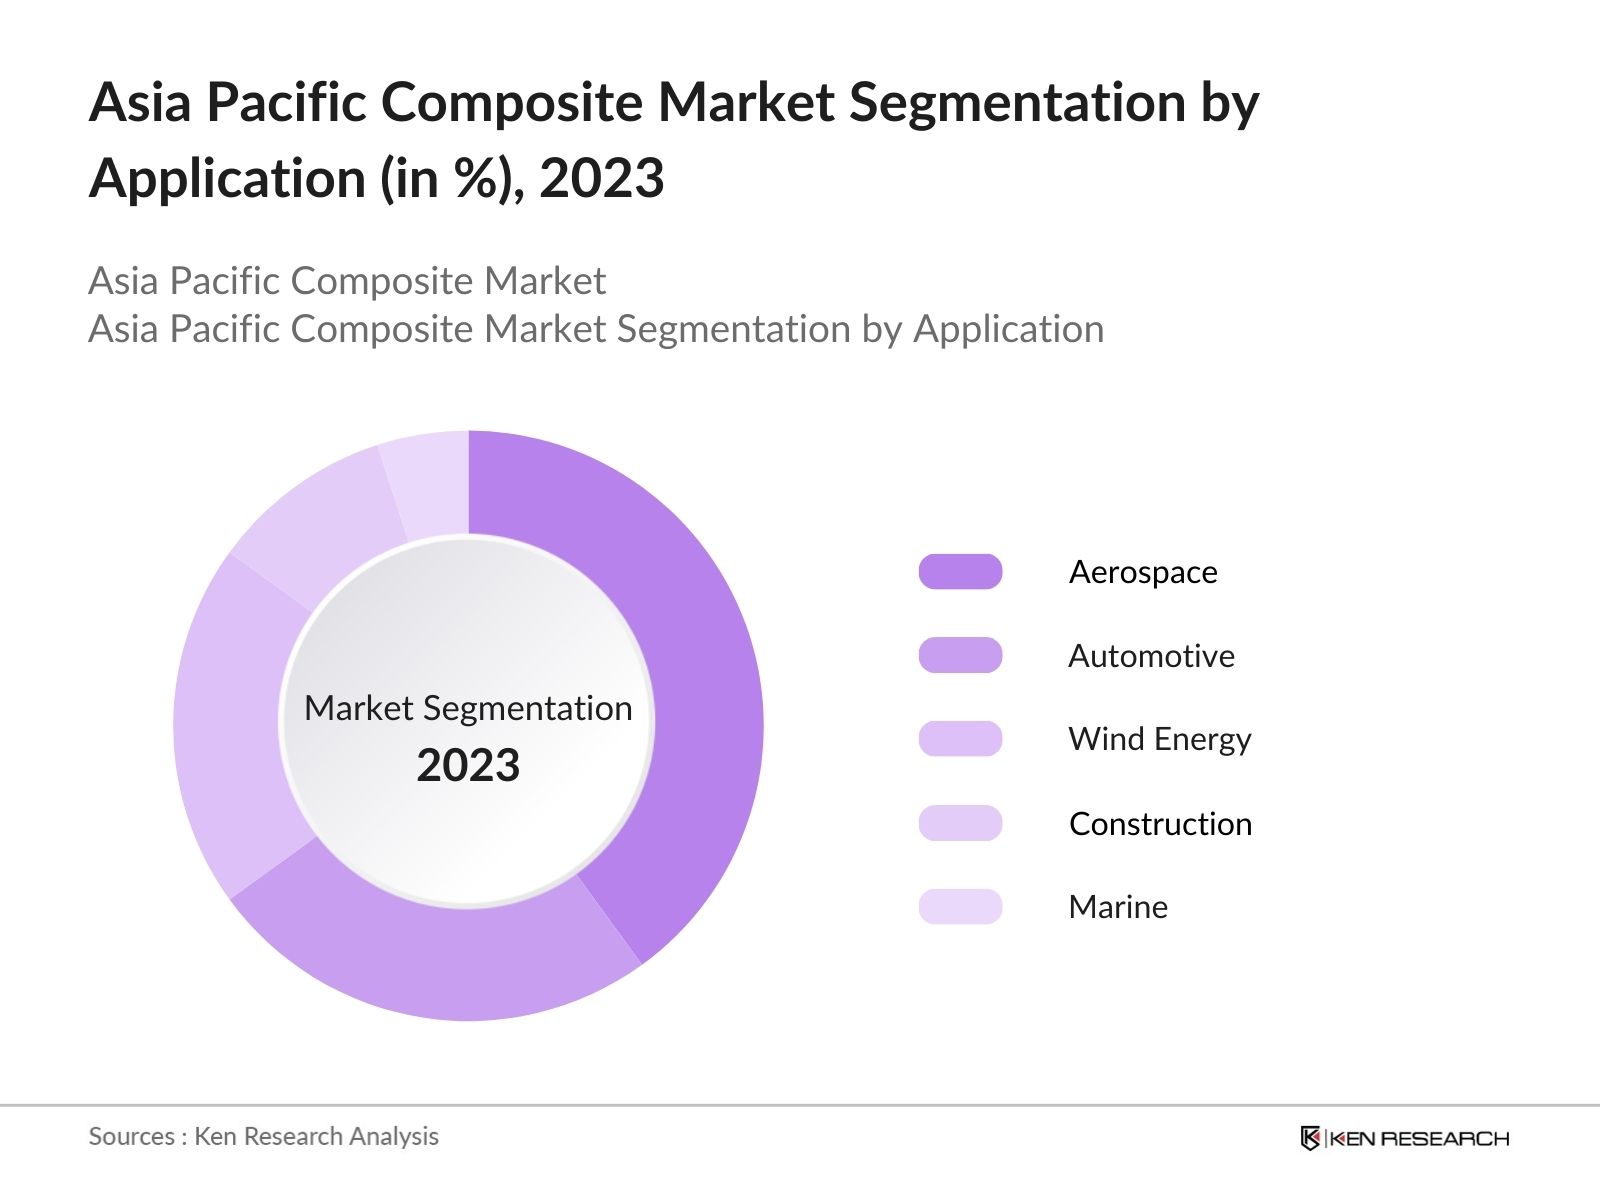
- By Application: The market is segmented by application into aerospace, automotive, wind energy, construction, and marine. The aerospace segment leads the market due to the growing demand for fuel-efficient aircraft and the increasing adoption of composite materials to reduce aircraft weight. Composites are used in critical aerospace components such as fuselages and wings, where durability, weight reduction, and performance are essential. Moreover, government initiatives to expand the aerospace industry, particularly in China and Japan, have accelerated the growth of this segment.
Asia Pacific Composite Market Competitive Landscape
The Asia Pacific Composite Market is dominated by several major players, including both local manufacturers and global companies. These companies leverage their extensive research and development capabilities to maintain a competitive edge. Some key players focus on vertical integration, controlling the entire supply chain, from raw material production to composite manufacturing. This strategy ensures cost efficiency and consistent supply, particularly in high-demand industries like aerospace and automotive.
|
Company |
Establishment Year |
Headquarters |
Annual Revenue (USD bn) |
Number of Employees |
Production Capacity (Tons) |
Key Markets |
Technological Expertise |
Partnerships |
R&D Investment (USD mn) |
|---|---|---|---|---|---|---|---|---|---|
|
Toray Industries Inc. |
1926 |
Japan |
|||||||
|
Teijin Limited |
1918 |
Japan |
|||||||
|
Hexcel Corporation |
1948 |
USA |
|||||||
|
Mitsubishi Chemical Corp. |
1933 |
Japan |
|||||||
|
Owens Corning |
1938 |
USA |
Asia Pacific Composite Industry Analysis
Growth Drivers
- Industrial Growth: The expansion of the oil and gas industry across the East Africa region, particularly in Uganda and Kenya, is propelling demand for EA pumps. In Uganda alone, oil reserves are estimated at 6.5 billion barrels, with planned projects such as the East African Crude Oil Pipeline boosting the need for efficient pump systems. Similarly, water treatment facilities in East Africa are undergoing rapid growth, driven by increasing urbanization. Kenya, for instance, has set up over 688 water treatment plants to cater to the growing demand for potable water, further driving the EA pumps market.
- Government Infrastructure Projects: East African governments are investing heavily in infrastructure projects related to water supply and irrigation, driving the demand for EA pumps. Kenyas National Water Master Plan 2030 outlines plans to develop 57 major water supply schemes, which will require a significant number of pumps. Similarly, Tanzanias ongoing $5 billion irrigation projects aim to expand irrigated land to 1 million hectares by 2025, pushing the need for advanced pump systems to support these efforts. These government-led projects represent a critical growth driver in the region.
- Urbanization & Population Growth: East Africa's urban population is growing rapidly, leading to an increase in water demand and the need for reliable pumping systems. The urban population in East Africa grew by 25 million people between 2012 and 2022, and this growth trend is expected to continue. With approximately 12.5 million people residing in Kenya's urban centers, the demand for water supply infrastructure is on the rise. This has increased investments in urban water distribution networks, where pump systems play a critical role. Uganda has also seen an 8.3% annual urban growth rate since 2012.
Market Challenges
- High Initial Costs: The initial investment required for the procurement and installation of EA pumps can be high, which presents a challenge, especially for smaller companies. In Kenya, the average cost for the installation of industrial pumps for a medium-sized facility is approximately $50,000, according to local industry reports. This high capital requirement acts as a barrier to market entry for many smaller players, slowing down the adoption of advanced pump technologies. Additionally, the operating costs are substantial, including maintenance and energy consumption, further compounding the issue for cost-sensitive markets.
- Lack of Skilled Workforce: The shortage of a skilled workforce to operate and maintain advanced EA pump systems is a significant challenge in East Africa. For example, Uganda faces a shortfall of approximately 5,000 trained technicians in the water and sanitation sector, as reported by the Ministry of Water and Environment. This skills gap results in higher operational costs due to frequent breakdowns and maintenance needs. Moreover, manufacturers are often forced to import skilled labor for high-end pump systems, which adds to the overall operational costs in the region.
Asia Pacific Composite Market Future Outlook
Over the next five years, the Asia Pacific Composite Market is expected to experience substantial growth, driven by expanding applications in the aerospace, automotive, and renewable energy sectors. Government support for reducing carbon emissions, along with increasing investments in electric vehicles and wind energy, will fuel demand for lightweight, high-performance composite materials. Additionally, advancements in manufacturing techniques, such as automated production and 3D printing, will further enhance the scalability and cost-effectiveness of composite production.
Future Market Opportunities
- Technological Advancements (Smart Pumps, IoT Integration) Technological advancements in smart pumps, including the integration of IoT technology, present significant opportunities for the EA pump market. In 2023, over 65% of industrial facilities in Kenya, particularly in the energy and water sectors, reported exploring or integrating smart pumps to optimize efficiency. Smart pumps can help reduce energy consumption by up to 20%, as indicated by studies from Uganda's Ministry of Energy. This adoption not only improves operational efficiency but also opens new revenue streams for companies offering advanced pump solutions in the region.
- Renewable Energy Integration (Solar-Powered Pumps) The push towards renewable energy solutions is creating opportunities for solar-powered pumps in East Africa. In rural Kenya, solar-powered water pumps have gained popularity, with over 300 installations in 2022 alone, supported by the Kenyan governments solar energy initiative. Additionally, Tanzania has introduced solar pump subsidies for agricultural applications, driving further demand. These pumps are particularly useful for irrigation in remote areas where electricity access is limited, offering a sustainable and cost-effective solution for farmers.
Scope of the Report
|
Fiber Type |
Carbon Fiber Glass Fiber Aramid Fiber |
|
Resin Type |
Thermoset Resin Thermoplastic Resin |
|
Manufacturing Process |
Lay-Up Process Filament Winding Injection Molding |
|
Application |
Aerospace Automotive Wind Energy Construction Marine |
|
Region |
China Japan India Australia South Korea |
Products
Key Target Audience
Aerospace and Defense Manufacturers
Automotive OEMs
Wind Energy Solution Providers
Marine Equipment Manufacturers
Construction Material Suppliers
Government and Regulatory Bodies (e.g., Ministry of Industry and Information Technology, Japan Aerospace Exploration Agency)
Investment and Venture Capitalist Firms
Composite Material Manufacturers
Banks and Financial Institutions
Companies
Major Players
Toray Industries Inc.
Teijin Limited
Hexcel Corporation
Mitsubishi Chemical Holdings Corporation
Owens Corning
Huntsman Corporation
Solvay SA
SGL Carbon SE
Gurit Holding AG
Hyosung Corporation
Zoltek Corporation
Plasan Carbon Composites
DIC Corporation
Jushi Group
Kineco Kaman Composites
Table of Contents
1. Asia Pacific Composite Market Overview
1.1. Definition and Scope
1.2. Market Taxonomy
1.3. Market Growth Rate (CAGR)
1.4. Market Segmentation Overview
2. Asia Pacific Composite Market Size (in USD Bn)
2.1. Historical Market Size (In Value)
2.2. Year-On-Year Growth Analysis
2.3. Key Market Developments and Milestones (Technological Advancements, Mergers)
3. Asia Pacific Composite Market Analysis
3.1. Growth Drivers (Market Expansion, Technological Advancements)
3.1.1. Increasing Demand in Aerospace
3.1.2. Sustainability and Lightweight Materials
3.1.3. Government Policies for Carbon Emission Reduction
3.1.4. Growing Adoption in the Automotive Industry
3.2. Market Challenges (Cost, Raw Material Availability)
3.2.1. High Production Costs
3.2.2. Limited Availability of High-Quality Fibers
3.2.3. Regulatory Standards for Composite Use
3.3. Opportunities (Market Penetration, New Technologies)
3.3.1. Adoption in Wind Energy
3.3.2. Emerging Applications in Marine Industry
3.3.3. Focus on 3D Printing and Advanced Composites
3.4. Trends (Innovative Materials, New Manufacturing Techniques)
3.4.1. Automated Manufacturing Technologies (Robotics, AI)
3.4.2. Recycling and Circular Economy Initiatives
3.4.3. Hybrid Composites Development
3.5. Government Regulation (Material Standards, Environmental Impact)
3.5.1. Regulations on Use of Composites in Aerospace
3.5.2. Emission Control Policies
3.5.3. Building Code Standards for Composite Applications
3.5.4. Subsidies for Renewable Energy Composite Products
3.6. SWOT Analysis
3.7. Stake Ecosystem
3.8. Porters Five Forces
3.9. Competition Ecosystem
4. Asia Pacific Composite Market Segmentation
4.1. By Fiber Type (In Value %) 4.1.1. Carbon Fiber
4.1.2. Glass Fiber
4.1.3. Aramid Fiber
4.2. By Resin Type (In Value %) 4.2.1. Thermoset Resin
4.2.2. Thermoplastic Resin
4.3. By Manufacturing Process (In Value %) 4.3.1. Lay-Up Process
4.3.2. Filament Winding
4.3.3. Injection Molding
4.4. By Application (In Value %) 4.4.1. Aerospace
4.4.2. Automotive
4.4.3. Wind Energy
4.4.4. Construction
4.4.5. Marine
4.5. By Region (In Value %) 4.5.1. China
4.5.2. Japan
4.5.3. India
4.5.4. Australia
4.5.5. South Korea
5. Asia Pacific Composite Market Competitive Analysis
5.1. Detailed Profiles of Major Companies (Revenue, Market Position)
5.1.1. Toray Industries Inc.
5.1.2. Teijin Limited
5.1.3. Hexcel Corporation
5.1.4. Mitsubishi Chemical Holdings Corporation
5.1.5. SGL Carbon SE
5.1.6. Owens Corning
5.1.7. Huntsman Corporation
5.1.8. Solvay SA
5.1.9. Kineco Kaman Composites
5.1.10. Gurit Holding AG
5.1.11. Hyosung Corporation
5.1.12. Zoltek Corporation
5.1.13. Plasan Carbon Composites
5.1.14. DIC Corporation
5.1.15. Jushi Group
5.2. Cross Comparison Parameters (Number of Employees, Manufacturing Capabilities, Market Share, Innovation Index, Global Reach, Technological Partnerships, Production Volume, Vertical Integration)
5.3. Market Share Analysis
5.4. Strategic Initiatives
5.5. Mergers and Acquisitions
5.6. Investment Analysis
5.7. Venture Capital Funding
5.8. Private Equity Investments
6. Asia Pacific Composite Market Regulatory Framework
6.1. Material Standards Compliance
6.2. Environmental Regulations
6.3. Safety Certifications for Composites
7. Asia Pacific Composite Future Market Size (In USD Bn)
7.1. Future Market Size Projections
7.2. Key Factors Driving Future Market Growth
8. Asia Pacific Composite Future Market Segmentation
8.1. By Fiber Type
8.2. By Resin Type
8.3. By Manufacturing Process
8.4. By Application
8.5. By Region
9. Asia Pacific Composite Market Analysts Recommendations
9.1. TAM/SAM/SOM Analysis
9.2. Customer Cohort Analysis
9.3. Marketing Initiatives
9.4. White Space Opportunity Analysis
Research Methodology
Step 1: Identification of Key Variables
In the initial phase, we mapped the major stakeholders in the Asia Pacific Composite Market, including fiber manufacturers, composite producers, and end-users. Extensive desk research and data analysis from secondary sources such as government databases and industry reports were employed to define key variables influencing market dynamics.
Step 2: Market Analysis and Construction
We compiled historical data on composite material production, export trends, and the adoption rate in various sectors such as aerospace and automotive. This analysis was complemented by assessing the supply chain and production capabilities of the major players.
Step 3: Hypothesis Validation and Expert Consultation
Market assumptions were validated through interviews with industry experts from leading composite manufacturing firms. These consultations provided insights into production challenges, innovation trends, and market expectations.
Step 4: Research Synthesis and Final Output
The final stage involved synthesizing data from multiple sources, including direct interactions with composite manufacturers, to provide a comprehensive analysis of the market. This ensured that the report was grounded in actual market conditions and backed by reliable data.
Frequently Asked Questions
01. How big is the Asia Pacific Composite Market?
The Asia Pacific Composite Market is valued at USD 44.5 billion, driven by strong demand across sectors such as aerospace, automotive, and wind energy.
02. What are the challenges in the Asia Pacific Composite Market?
Key challenges in the Asia Pacific Composite market include high production costs, the limited availability of high-quality raw materials, and strict regulatory standards for the use of composite materials in critical applications.
03. Who are the major players in the Asia Pacific Composite Market?
Major players in the Asia Pacific Composite market include Toray Industries Inc., Teijin Limited, Hexcel Corporation, Mitsubishi Chemical Holdings Corporation, and Owens Corning.
04. What are the growth drivers for the Asia Pacific Composite Market?
The Asia Pacific Composite market is driven by increasing demand for lightweight materials in the aerospace and automotive industries, advancements in fiber and resin technologies, and government initiatives supporting carbon emission reduction.
05. What are the key applications of composite materials in the Asia Pacific market?
The key applications in the Asia Pacific Composite market include aerospace, automotive, wind energy, construction, and marine sectors, with aerospace and automotive being the dominant segments due to the demand for high-performance materials.
Why Buy From Us?
 Framework")
What makes us stand out is that our consultants follows Robust, Refine and Result (RRR) methodology. i.e. Robust for clear definitions, approaches and sanity checking, Refine for differentiating respondents facts and opinions and Result for presenting data with story

We have set a benchmark in the industry by offering our clients with syndicated and customized market research reports featuring coverage of entire market as well as meticulous research and analyst insights.

While we don't replace traditional research, we flip the method upside down. Our dual approach of Top Bottom & Bottom Top ensures quality deliverable by not just verifying company fundamentals but also looking at the sector and macroeconomic factors.

With one step in the future, our research team constantly tries to show you the bigger picture. We help with some of the tough questions you may encounter along the way: How is the industry positioned? Best marketing channel? KPI's of competitors? By aligning every element, we help maximize success.

Our report gives you instant access to the answers and sources that other companies might choose to hide. We elaborate each steps of research methodology we have used and showcase you the sample size to earn your trust.

If you need any support, we are here! We pride ourselves on universe strength, data quality, and quick, friendly, and professional service.