
Asia Pacific Cruise Market Outlook to 2030
Region:Global
Author(s):Abhinav Kumar
Product Code:KROD6332
Region:Global
Author(s):Abhinav Kumar
Product Code:KROD6332
November 2024
100
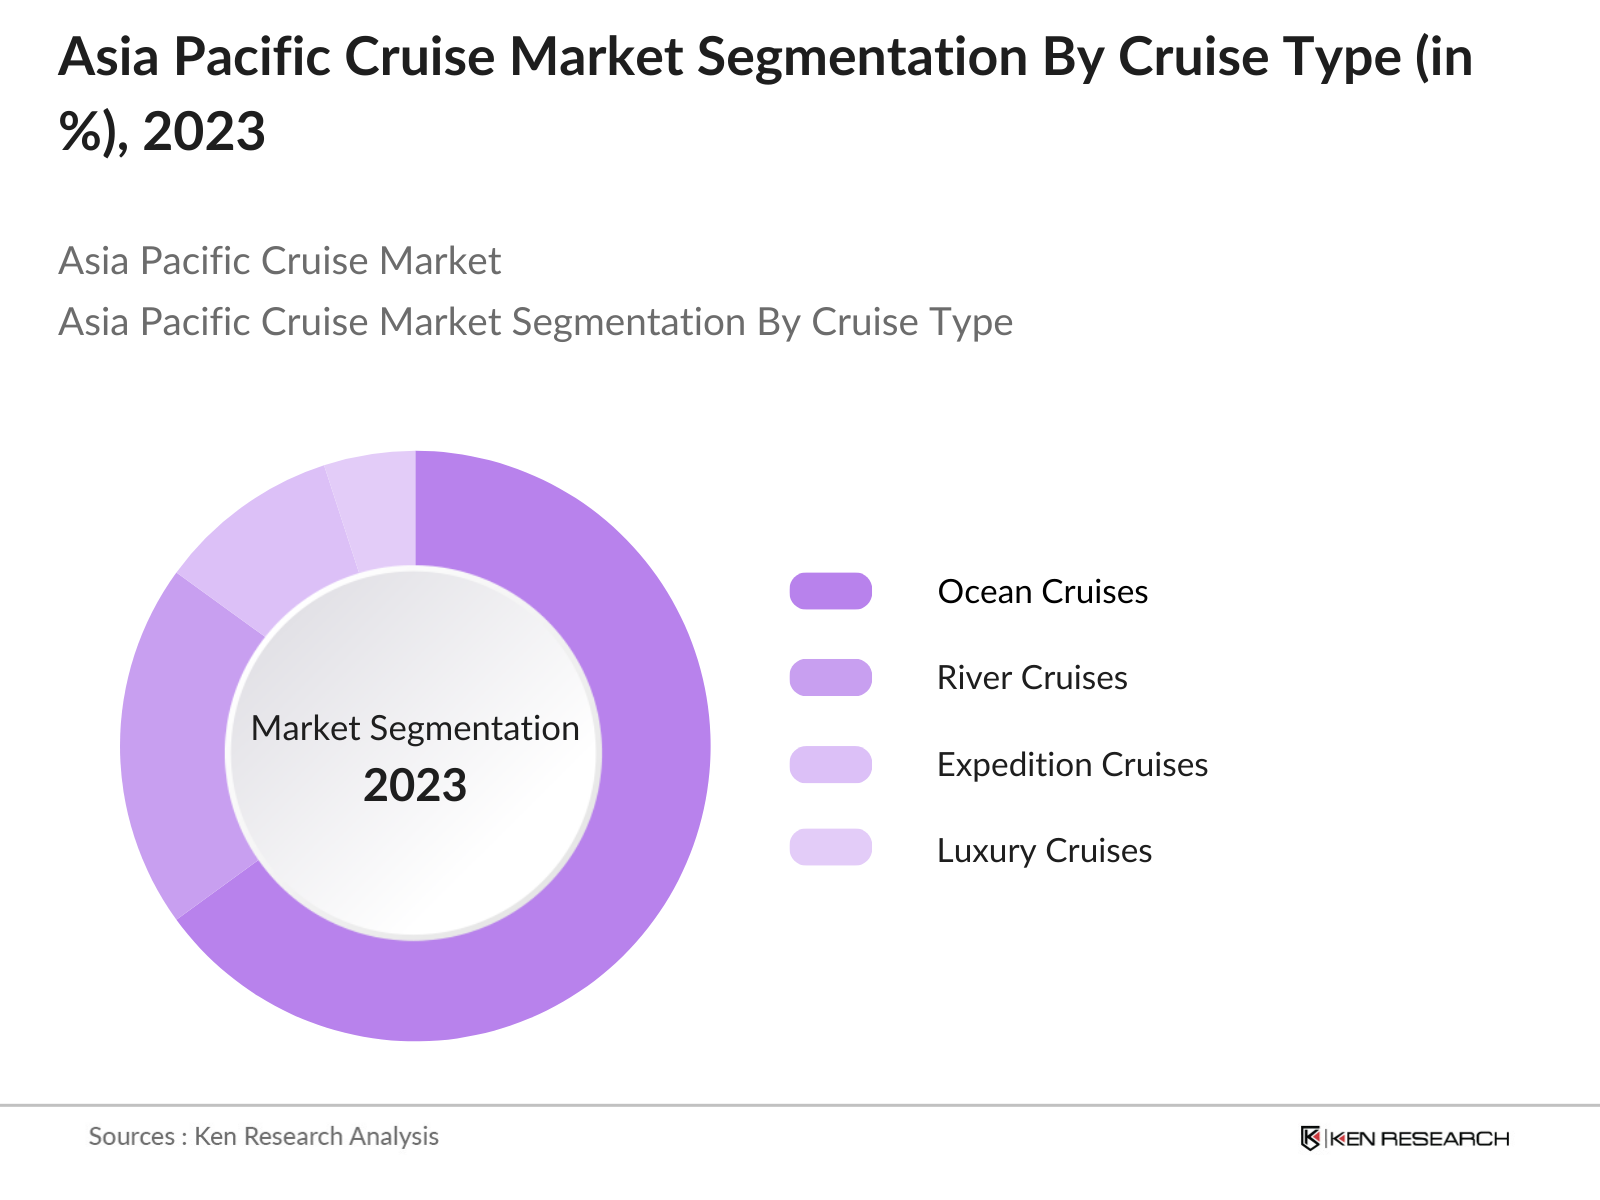
By Cruise Type: The Asia Pacific cruise market is segmented by cruise type into ocean cruises, river cruises, expedition cruises, and luxury cruises. Ocean cruises dominate the market share due to their widespread appeal across a broad demographic, attracting travelers seeking both short and long-haul vacations. The presence of well-established routes and large, entertainment-packed ships makes ocean cruises the preferred choice for a majority of travelers. Brands such as Carnival and Royal Caribbean further solidify this segments dominance by offering extensive itineraries, diverse activities, and a variety of price points for different consumer segments.
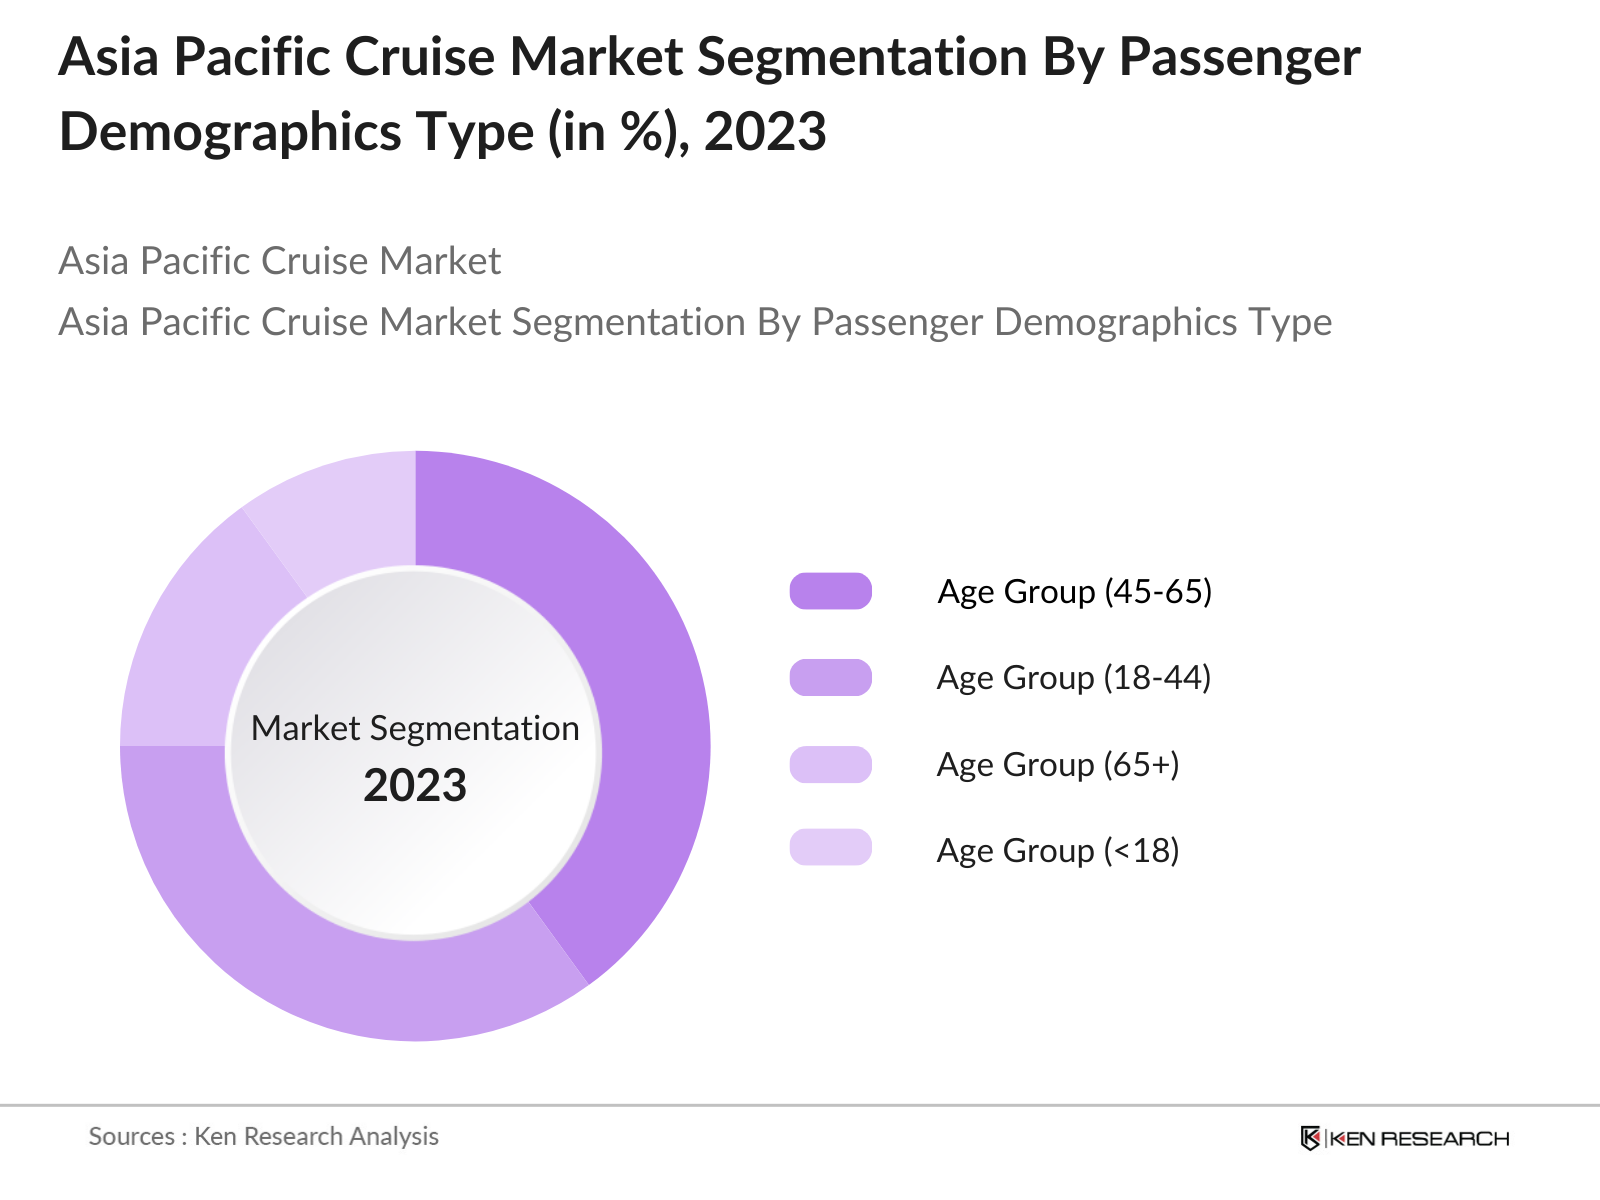
By Passenger Demographics: The Asia Pacific cruise market is segmented by passenger demographics into age groups, income brackets, and travel group types. Among these, cruises catering to middle-aged travelers (aged 45-65) have the highest market share. This is attributed to the greater disposable income and inclination towards leisure and cultural experiences, which align with the typical cruise offerings. Moreover, this demographic often prefers extended vacations, which fit well with longer cruise itineraries that combine multiple destinations.
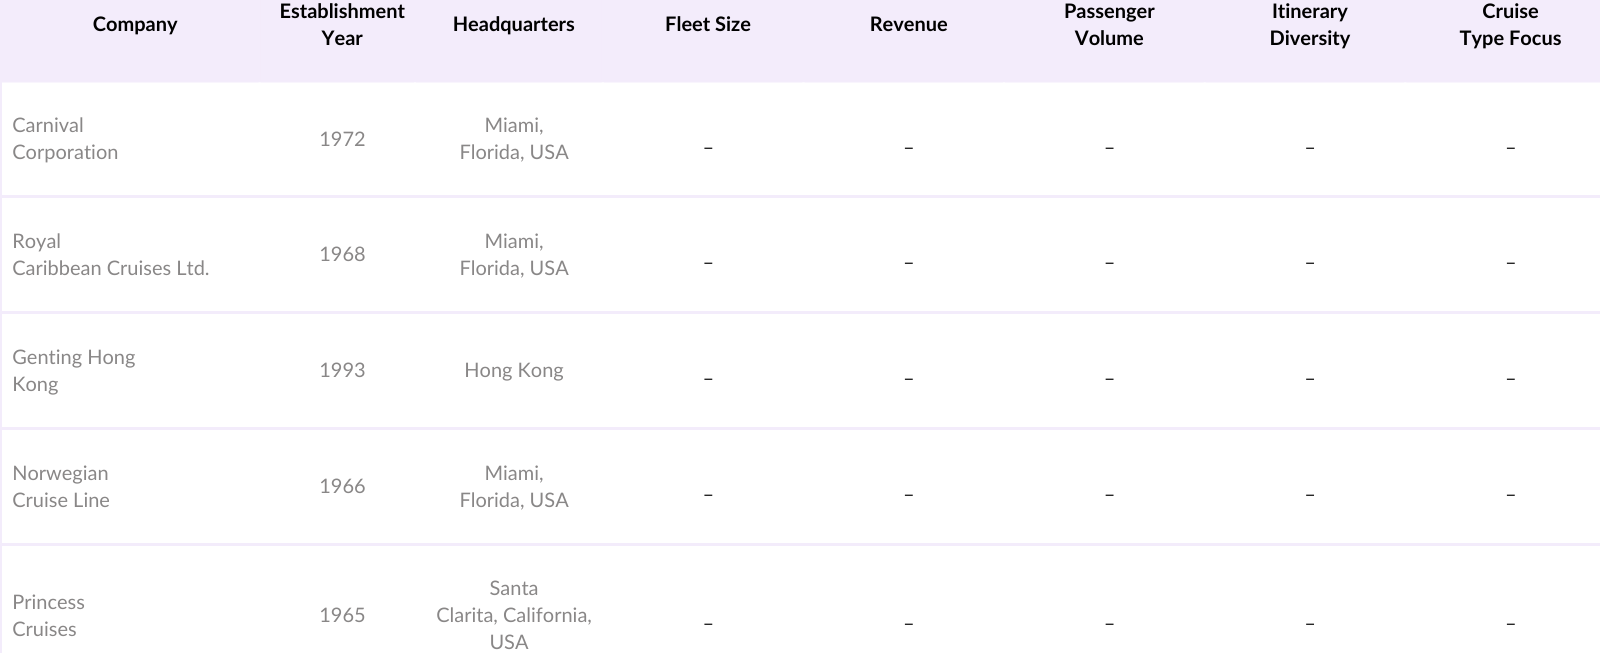
The Asia Pacific cruise market is characterized by a few dominant players that drive innovation, expand market penetration, and lead in market share. Companies such as Carnival Corporation, Royal Caribbean, and Genting Hong Kong lead the market by offering diverse cruise experiences across multiple destinations. The consolidation of the market around these key players reflects their strong financial resources, extensive fleet size, and a focus on customer experience enhancement.
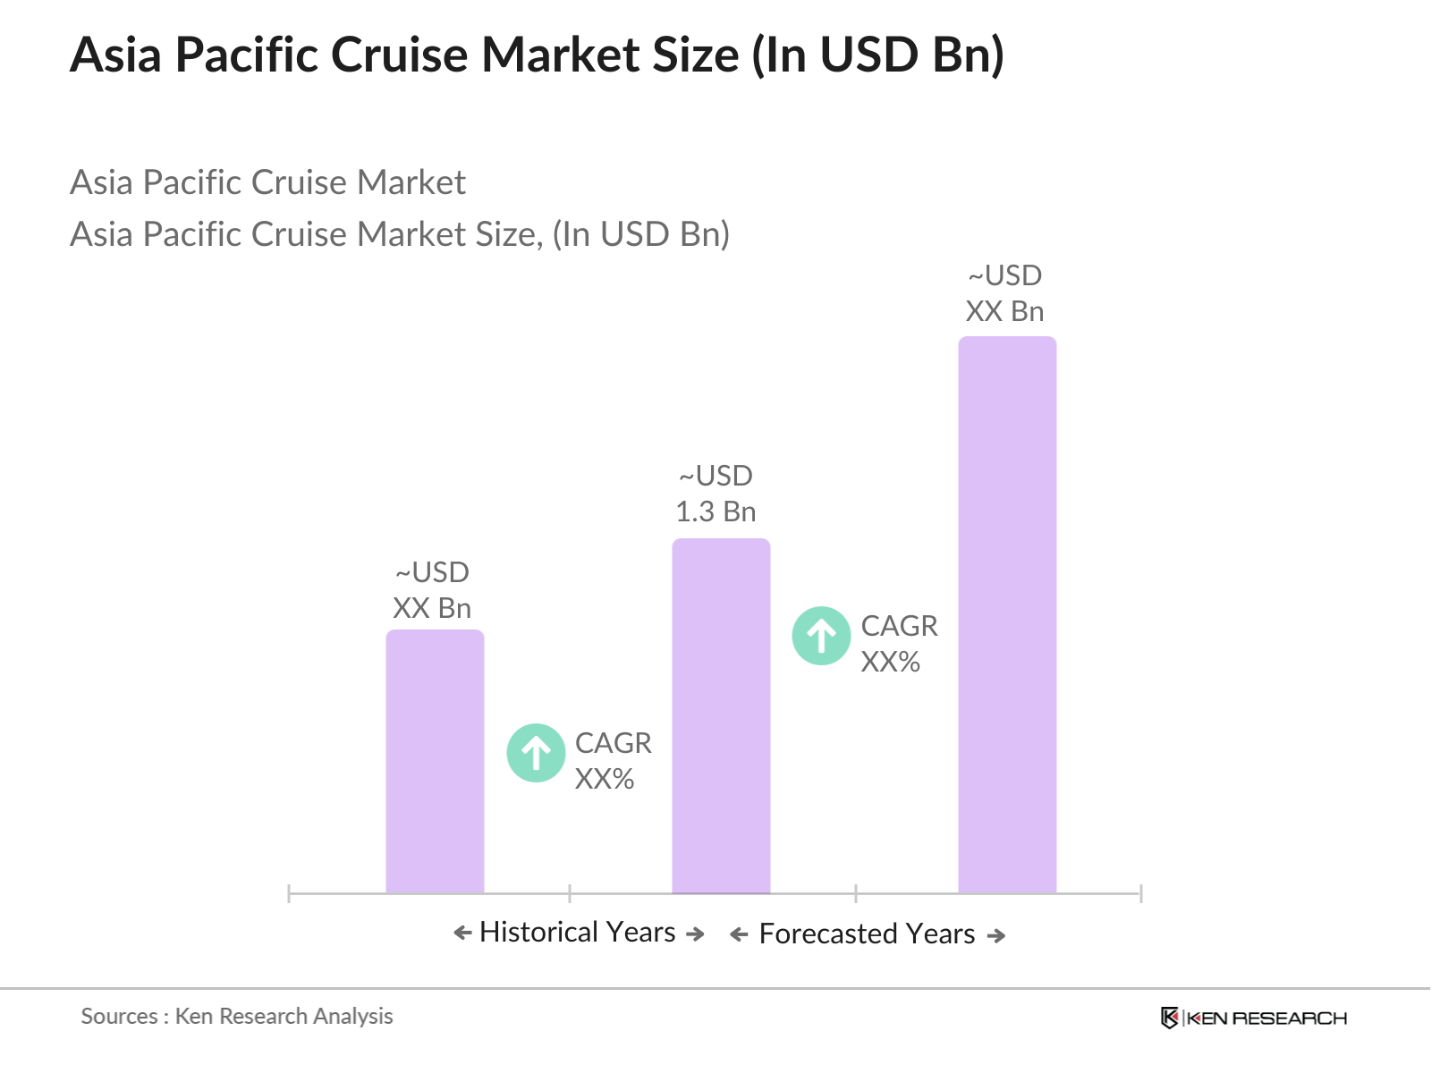
Over the next five years, the Asia Pacific cruise market is expected to witness considerable growth, driven by rising disposable incomes, increased tourism infrastructure investments, and a growing demand for unique travel experiences. Governments across the region are emphasizing tourism as a key economic driver, with several initiatives aimed at port development and expansion of cruise-related facilities. The shift towards eco-friendly travel, combined with advancements in cruise ship technology, will further enhance the markets appeal to environmentally-conscious travelers. Additionally, the regions untapped potential in lesser-known destinations is likely to drive growth in niche and expedition cruises.
|
Cruise Type |
Ocean Cruises River Cruises Expedition Cruises Luxury Cruises |
|
Passenger Demographics |
Age Group Income Bracket Travel Group Type |
|
Destination Type |
Coastal Cruises Remote Island Cruises Cultural Cruises |
|
Duration |
Short Cruises (1-3 Days) Mid-Length Cruises (4-7 Days) Long Cruises (8-14 Days) Extended Cruises (15+ Days) |
|
Region |
Southeast Asia East Asia Oceania South Asia |
1.1. Definition and Scope
1.2. Market Taxonomy
1.3. Market Growth Rate
1.4. Market Segmentation Overview
2.1. Historical Market Size
2.2. Year-On-Year Growth Analysis
2.3. Key Market Developments and Milestones
3.1. Growth Drivers
3.1.1. Increasing Disposable Income
3.1.2. Expanding Middle-Class Population
3.1.3. Surge in Coastal Tourism
3.1.4. Shift Towards Leisure and Experiential Travel
3.1.5. Government Infrastructure Investments
3.2. Market Challenges
3.2.1. Environmental Regulations
3.2.2. Seasonality and Weather-Related Risks
3.2.3. High Operating Costs
3.2.4. Limited Port Capacity
3.3. Opportunities
3.3.1. Expansion into New Cruise Destinations
3.3.2. Rise in Luxury and Niche Cruise Experiences
3.3.3. Technological Advancements in Ship Design
3.3.4. Collaborations with Hospitality and Airline Industries
3.4. Trends
3.4.1. Sustainability Initiatives
3.4.2. Growth in Domestic Cruises
3.4.3. Integration of Wellness and Health-Oriented Services
3.4.4. Increasing Popularity of Themed Cruises
3.5. Government Regulations
3.5.1. Environmental Compliance (Emission Controls, IMO Regulations)
3.5.2. Safety Standards (Passenger Safety, Health Protocols)
3.5.3. Maritime Laws (Cabotage Laws, Port Access Regulations)
3.5.4. Taxation Policies (Port Charges, Berthing Fees)
3.6. SWOT Analysis
3.7. Stakeholder Ecosystem
3.8. Porters Five Forces
3.9. Competition Ecosystem
4.1. By Cruise Type (In Value %)
4.1.1. Ocean Cruises
4.1.2. River Cruises
4.1.3. Expedition Cruises
4.1.4. Luxury Cruises
4.2. By Passenger Demographics (In Value %)
4.2.1. Age Group (Millennials, Gen X, Baby Boomers)
4.2.2. Income Bracket
4.2.3. Travel Group Type (Solo Travelers, Families, Couples)
4.3. By Destination Type (In Value %)
4.3.1. Coastal Cruises (Southeast Asia, East Asia)
4.3.2. Remote Island Cruises (Pacific Islands)
4.3.3. Cultural Cruises (Japan, China, South Korea)
4.4. By Duration (In Value %)
4.4.1. Short Cruises (1-3 Days)
4.4.2. Mid-Length Cruises (4-7 Days)
4.4.3. Long Cruises (8-14 Days)
4.4.4. Extended Cruises (15+ Days)
4.5. By Region (In Value %)
4.5.1. Southeast Asia (Thailand, Indonesia, Vietnam)
4.5.2. East Asia (China, Japan, South Korea)
4.5.3. Oceania (Australia, New Zealand, Pacific Islands)
4.5.4. South Asia (India, Sri Lanka, Maldives)
5.1 Detailed Profiles of Major Companies
5.1.1. Carnival Corporation
5.1.2. Royal Caribbean Cruises Ltd.
5.1.3. Genting Hong Kong Limited
5.1.4. Norwegian Cruise Line Holdings Ltd.
5.1.5. Princess Cruises
5.1.6. MSC Cruises
5.1.7. P&O Cruises
5.1.8. Dream Cruises
5.1.9. Seabourn Cruise Line
5.1.10. Viking Cruises
5.1.11. Holland America Line
5.1.12. Regent Seven Seas Cruises
5.1.13. Silversea Cruises
5.1.14. AIDA Cruises
5.1.15. Celebrity Cruises
5.2 Cross Comparison Parameters (Fleet Size, Headquarters, No. of Passengers, Market Share, Cruise Length, Itinerary Diversity, Revenue, Expansion Strategy)
5.3 Market Share Analysis
5.4 Strategic Initiatives
5.5 Mergers and Acquisitions
5.6 Investment Analysis
5.7 Government Support Programs
5.8 Sustainability and ESG Strategies
6.1 Maritime Environmental Regulations
6.2 Passenger and Crew Safety Protocols
6.3 Port Regulations and Compliance
7.1 Future Market Size Projections
7.2 Key Factors Driving Future Market Growth
8.1 By Cruise Type (In Value %)
8.2 By Passenger Demographics (In Value %)
8.3 By Destination Type (In Value %)
8.4 By Duration (In Value %)
8.5 By Region (In Value %)
9.1 TAM/SAM/SOM Analysis
9.2 Marketing Initiatives
9.3 Customer Behavior and Preference Analysis
9.4 White Space Opportunity Analysis
Disclaimer Contact UsThe first phase involves building a detailed ecosystem of the Asia Pacific cruise market by identifying all major stakeholders. This is supported by extensive desk research, leveraging secondary data sources to collect industry-level information and key market drivers, constraints, and opportunities.
Next, historical data is analyzed to understand market penetration and growth trends. Metrics such as passenger volume, cruise occupancy rates, and ship itineraries are examined to construct a robust analysis of revenue generation within the market.
To validate market assumptions, expert interviews and consultations are conducted with industry executives and stakeholders. This step ensures the accuracy of the data and refines the projections based on real-world insights from leading cruise operators.
Finally, the data is synthesized into a comprehensive report that is cross-verified with primary sources. The final output provides a detailed analysis of key market segments, competitive landscape, and market growth projections.
The Asia Pacific cruise market is valued at USD 1.3 billion, driven by strong demand for leisure travel, increasing disposable incomes, and expanding tourism infrastructure in countries such as China, Japan, and Australia.
Challenges include strict environmental regulations, fluctuating fuel costs, and seasonality risks. Additionally, the market faces capacity limitations in popular cruise ports, leading to congestion and operational inefficiencies.
Major players include Carnival Corporation, Royal Caribbean Cruises Ltd., Genting Hong Kong, Norwegian Cruise Line, and Princess Cruises. These companies dominate the market due to their vast fleets, established routes, and diverse cruise offerings.
The market is driven by the rise of middle-class travelers, increased government investment in tourism infrastructure, and the growing appeal of experiential travel. Additionally, technological advancements in cruise ships, such as green energy solutions, are boosting market growth.
 Framework")
What makes us stand out is that our consultants follows Robust, Refine and Result (RRR) methodology. i.e. Robust for clear definitions, approaches and sanity checking, Refine for differentiating respondents facts and opinions and Result for presenting data with story

We have set a benchmark in the industry by offering our clients with syndicated and customized market research reports featuring coverage of entire market as well as meticulous research and analyst insights.

While we don't replace traditional research, we flip the method upside down. Our dual approach of Top Bottom & Bottom Top ensures quality deliverable by not just verifying company fundamentals but also looking at the sector and macroeconomic factors.

With one step in the future, our research team constantly tries to show you the bigger picture. We help with some of the tough questions you may encounter along the way: How is the industry positioned? Best marketing channel? KPI's of competitors? By aligning every element, we help maximize success.

Our report gives you instant access to the answers and sources that other companies might choose to hide. We elaborate each steps of research methodology we have used and showcase you the sample size to earn your trust.

If you need any support, we are here! We pride ourselves on universe strength, data quality, and quick, friendly, and professional service.