


Asia Pacific Desktop Virtualization Market Outlook to 2030
Region:Global
Author(s):Abhinav kumar
Product Code:KROD8473
November 2024
97
About the Report
Asia Pacific Desktop Virtualization Market Overview
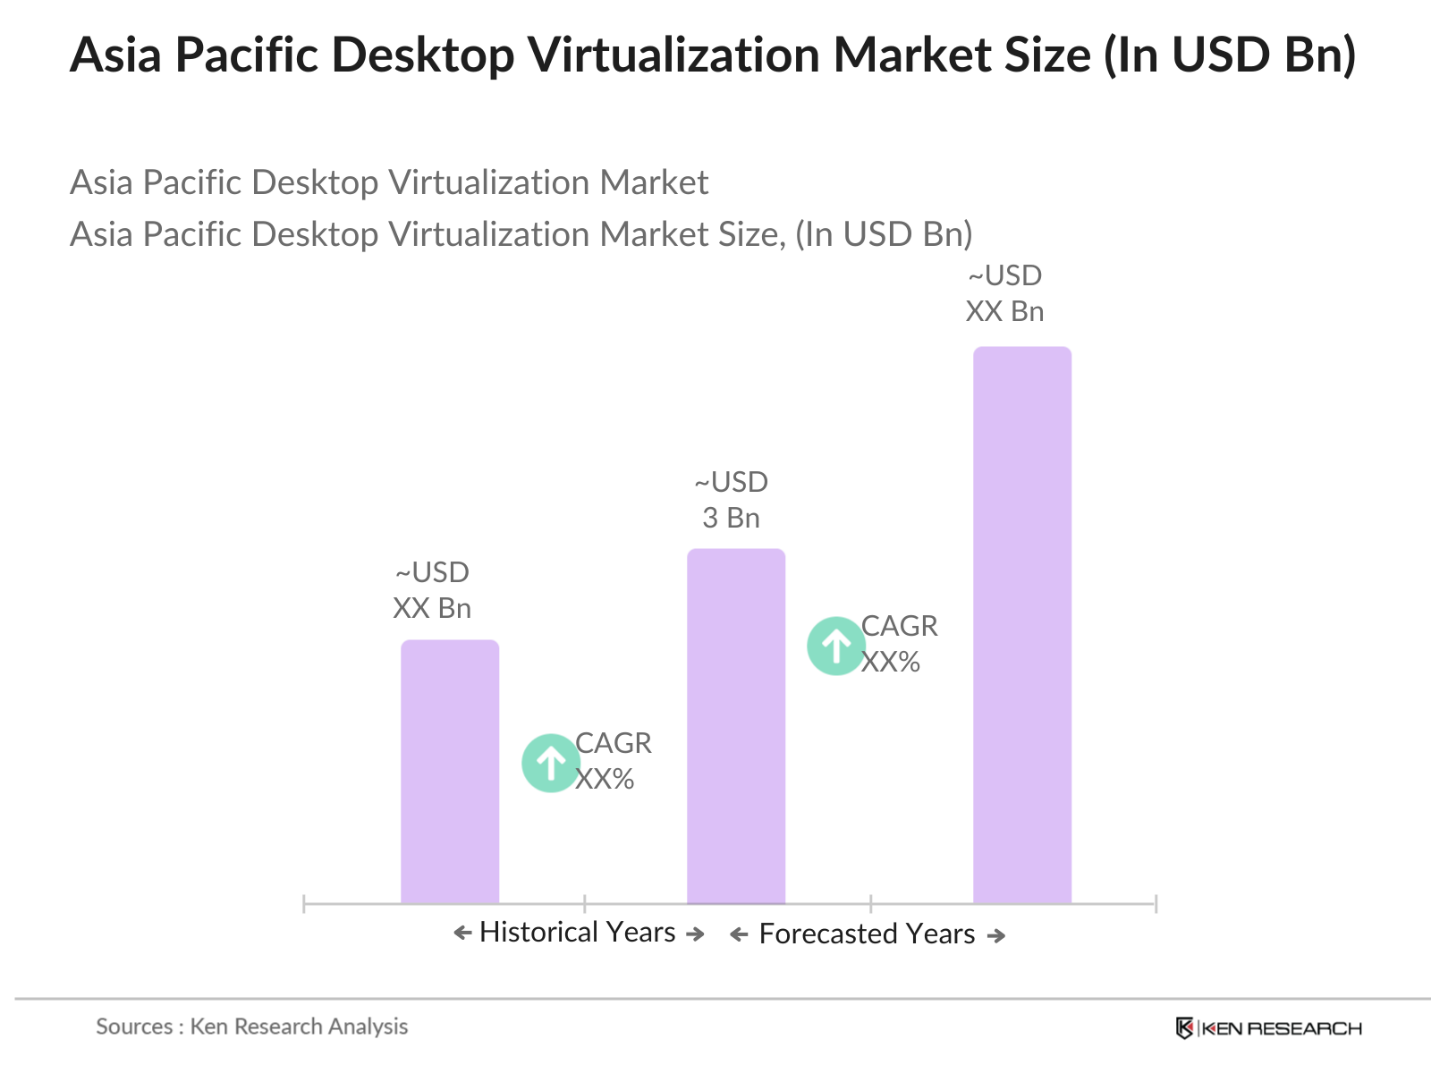
- The Asia Pacific desktop virtualization market is valued at USD 3 billion, driven by an increase in the adoption of cloud computing technologies and the growing need for remote working solutions. The market's expansion is attributed to the rising demand for cost-efficient IT infrastructure, especially as businesses seek to reduce overhead and improve scalability. Organizations across various industries have been shifting their operations online, and desktop virtualization provides a seamless way to manage remote workforces, enhance data security, and optimize resources.
- China, Japan, and India dominate the Asia Pacific desktop virtualization market. China's dominance stems from its robust IT infrastructure and growing investments in cloud computing and virtualization technologies. Japan excels due to its advanced technological capabilities and extensive adoption of desktop-as-a-service (DaaS) in industries such as banking and education. Indias prominence is fueled by its rapidly growing IT sector and the increasing shift toward remote work. These countries also benefit from government initiatives aimed at digital transformation.
- Stricter data privacy laws across Asia Pacific are impacting the desktop virtualization market, particularly in regions like Japan and South Korea, where compliance costs for data privacy regulations have increased to USD 1 billion annually. The enforcement of laws like the Personal Data Protection Act in Singapore requires businesses to implement robust security measures within their virtual desktop environments to avoid penalties. These regulations are influencing the way companies deploy and manage their desktop virtualization solutions.
Asia Pacific Desktop Virtualization Market Segmentation
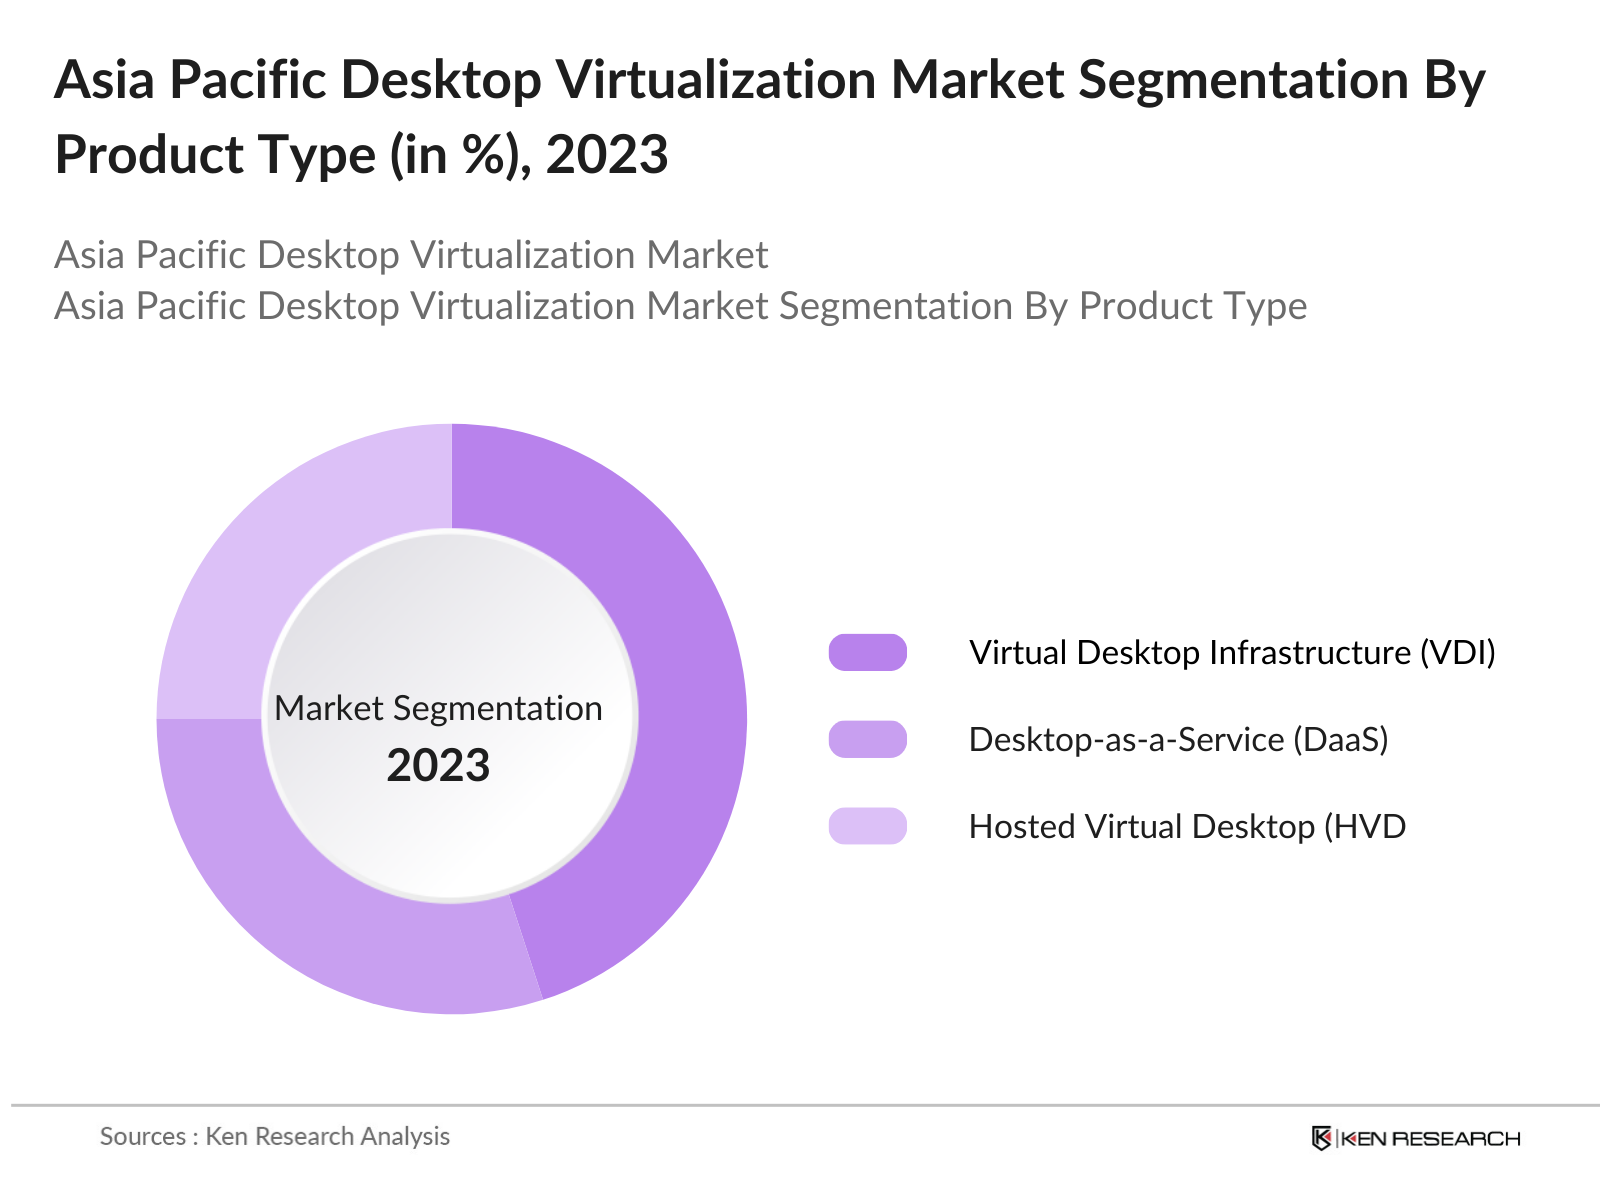
By Product Type: The Asia Pacific desktop virtualization market is segmented by product type into Hosted Virtual Desktop (HVD), Virtual Desktop Infrastructure (VDI), and Desktop-as-a-Service (DaaS). Among these, Virtual Desktop Infrastructure holds a dominant market share, driven by its ability to offer enhanced security and control over IT operations. Enterprises, particularly in sectors such as BFSI and healthcare, prefer VDI due to its on-premise deployment and capacity to manage large volumes of data securely. This has allowed VDI to maintain a significant lead in terms of market share, particularly in organizations where data confidentiality is paramount.
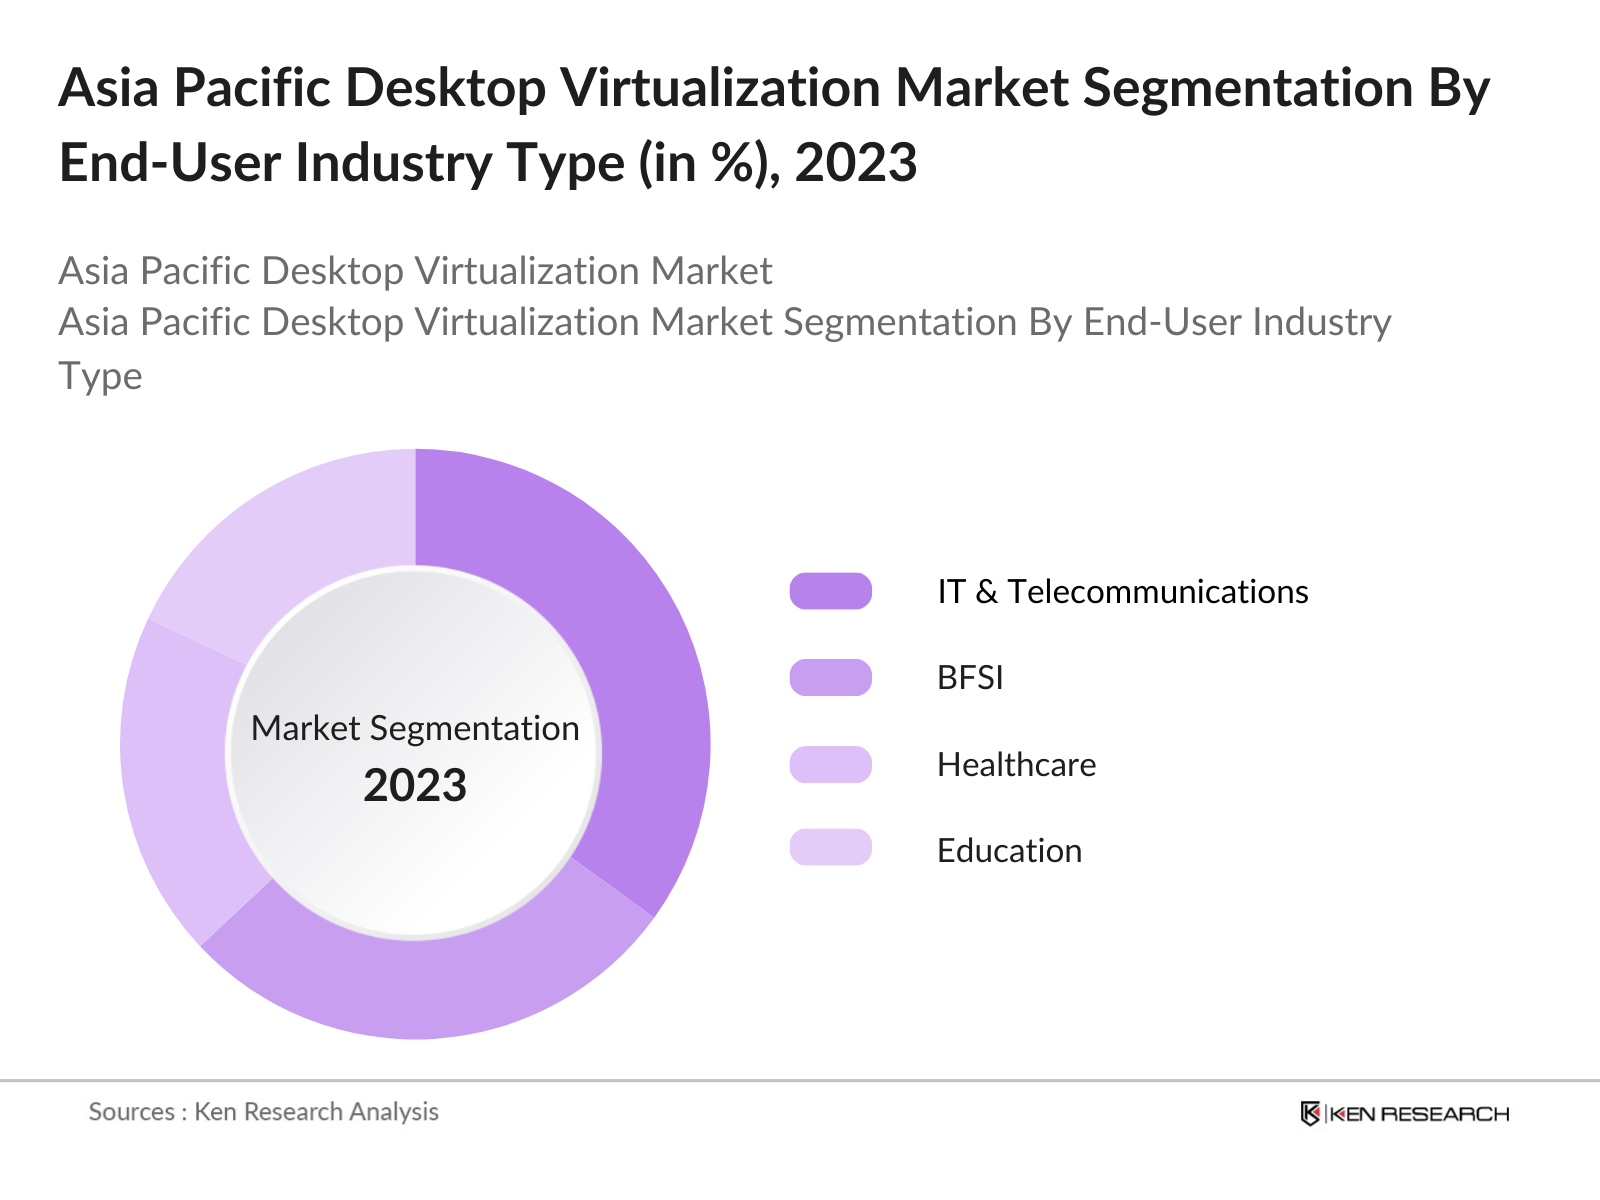
By End-User Industry: In terms of end-user industries, the desktop virtualization market is segmented into IT & Telecommunications, BFSI, Healthcare, Education, and Government. The IT & Telecommunications sector leads the market due to its early adoption of cloud computing and virtualization technologies. As companies in this sector seek to manage their distributed workforces and increase operational efficiency, the demand for virtual desktop solutions has surged. Additionally, the education sector has shown strong growth in adopting desktop virtualization, especially as schools and universities shift to hybrid learning models that require scalable and secure IT solutions.
Asia Pacific Desktop Virtualization Market Competitive Landscape
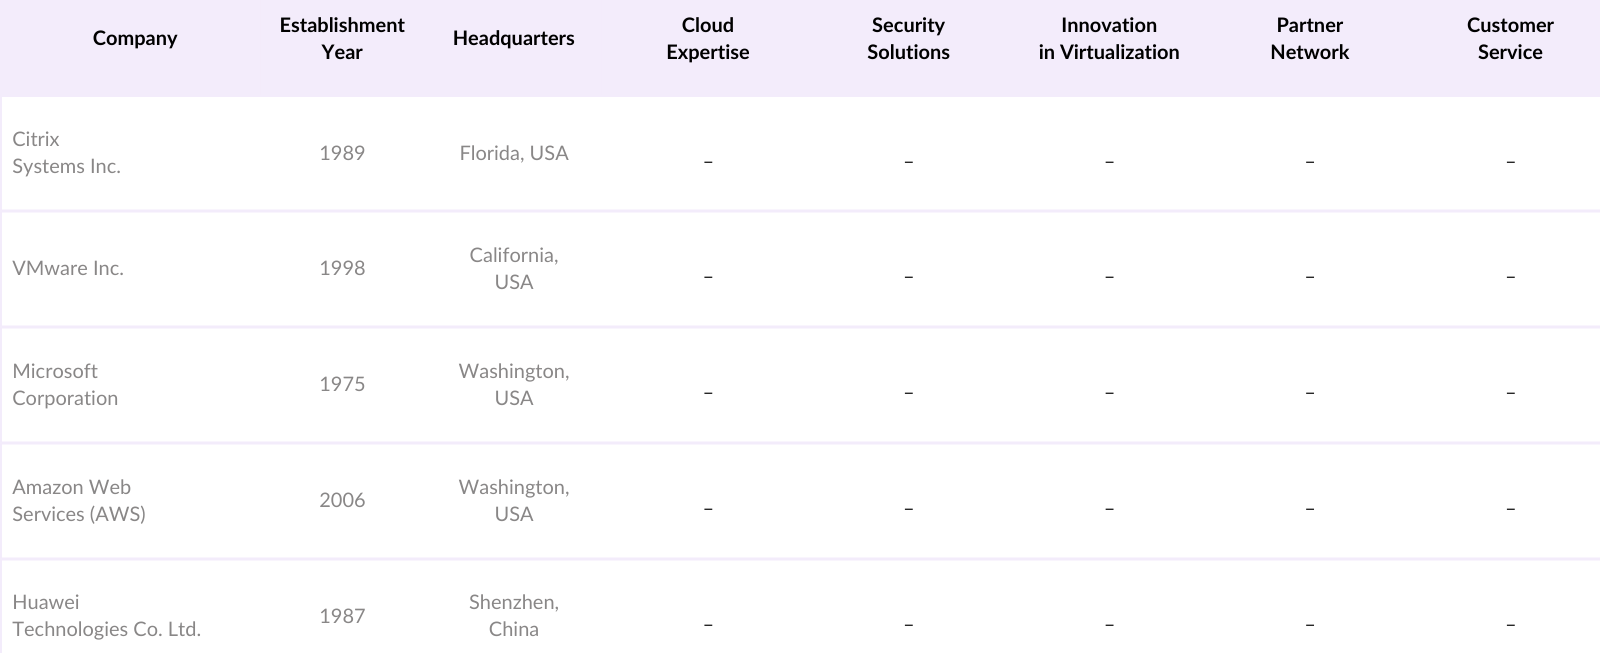
The Asia Pacific desktop virtualization market is dominated by key global and regional players that maintain strong brand presence and technological expertise. Companies like Citrix Systems, VMware, and Microsoft lead the market, thanks to their established customer base and robust virtualization solutions. These players have invested significantly in R&D, leading to continuous product innovation, which keeps them at the forefront of the industry. Additionally, the rise of regional players, particularly from China and India, has increased competition in the market.
Asia Pacific Desktop Virtualization Industry Analysis
Growth Drivers
- Rising Adoption of Cloud Computing: The Asia Pacific region has witnessed significant cloud adoption due to the increasing demand for scalable IT solutions. Countries like India and China have invested heavily in cloud infrastructure to support digital transformation. For example, India's government allocated approximately USD 4.5 billion in 2023 for cloud infrastructure development under its Digital India initiative. This investment is mirrored in other countries across the region, with cloud adoption rates accelerating to support businesses and government operations, thereby driving demand for desktop virtualization as businesses migrate to cloud-based solutions.
- Increasing Remote Working Trends: Remote work trends are growing in the Asia Pacific region due to the rise of digital businesses and an increasingly mobile workforce. In Japan alone, the number of remote workers doubled to approximately 34 million by 2023 as companies adapted to flexible work policies. Similarly, in Australia, over 7 million employees are now working remotely, pushing the demand for desktop virtualization solutions. The shift towards flexible work models has bolstered the adoption of virtual desktop infrastructure (VDI) to enable secure, scalable access for a distributed workforce.
- Cost Efficiency in IT Operations: Desktop virtualization has become a cost-efficient solution for companies looking to streamline IT operations in the Asia Pacific region. Governments in countries like Singapore have saved approximately USD 600 million in IT expenditures through virtualization and cloud-based technologies. Businesses benefit from lower hardware maintenance costs, reduced energy consumption, and a shift from capital to operational expenditures, making desktop virtualization a strategic priority in enterprise IT planning.
Market Challenges
- High Initial Setup Costs: Despite the long-term benefits, high initial setup costs for desktop virtualization remain a significant challenge in the Asia Pacific region. For instance, enterprises need to invest up to USD 500,000 for full-scale virtual desktop infrastructure deployment across medium-sized organizations in markets like South Korea and Japan. These costs are prohibitive for smaller businesses and government sectors operating on limited IT budgets, slowing adoption rates.
- Data Security Concerns: Data security concerns in the Asia Pacific region are growing, with reports of nearly 600,000 cybersecurity incidents in China alone during 2023, leading to significant data breaches and financial losses. This makes businesses hesitant to fully embrace desktop virtualization due to fears about data integrity and the lack of sufficient regional cybersecurity frameworks. The financial damage caused by data breaches across the region exceeded USD 9 billion in 2023, illustrating the gravity of this concern.
Asia Pacific Desktop Virtualization Market Future Outlook
Over the next five years, the Asia Pacific desktop virtualization market is expected to witness significant growth due to the increasing need for scalable and secure IT infrastructure. The rapid adoption of cloud computing, along with the rise of hybrid work models, is set to drive the demand for desktop virtualization solutions across industries. Governments across the region are also pushing for digital transformation, further accelerating market growth. With advancements in artificial intelligence and automation, companies are expected to invest heavily in desktop virtualization to optimize operations and improve workforce productivity.
Opportunities
- Integration with AI & Automation: The Asia Pacific market is experiencing a surge in AI-driven desktop virtualization solutions, with companies like Alibaba and Baidu integrating AI to optimize virtual desktop management. In 2023, China's AI industry reached USD 21 billion, providing new opportunities for automating desktop virtualization processes and reducing manual IT management. AI-enhanced virtualization also enables more secure, efficient operations, creating a promising opportunity for expansion in enterprise IT across the region.
- Growth of 5G Infrastructure: The ongoing rollout of 5G infrastructure in Asia Pacific is a critical enabler for desktop virtualization. South Korea, Japan, and China are leading the charge, with 5G penetration in these countries exceeding 600 million connections by 2023.This ultra-high-speed internet facilitates seamless virtual desktop experiences, enabling faster data transmission and lower latency for remote work environments. The growing 5G infrastructure across the region presents significant opportunities for expanding desktop virtualization across industries that rely on high-speed connectivity.
Scope of the Report
|
Product Type |
Hosted Virtual Desktop Virtual Desktop Infrastructure Desktop-as-a-Service |
|
End-User Industry |
IT & Telecommunications BFSI Education Healthcare Government |
|
Deployment Mode |
On-Premises Cloud-Based |
|
Organization Size |
Small & Medium Enterprises Large Enterprises |
|
Region |
China Japan India Australia Southeast Asia |
Products
Key Target Audience Organizations and Entities Who Can Benefit by Subscribing This Report:
IT & Telecommunication Companies
BFSI Organizations
Healthcare Provider Companies
Government and Regulatory Bodies (e.g., Ministry of IT, Ministry of Industry)
Cloud Service Provider Companies
Investor and Venture Capitalist Firms
Data Security Companies
Companies
Players Mentioned in the Report
Citrix Systems Inc.
VMware Inc.
Microsoft Corporation
Amazon Web Services (AWS)
Huawei Technologies Co. Ltd.
Nutanix Inc.
Dell Technologies
Oracle Corporation
Fujitsu Limited
IGEL Technology
Table of Contents
1. Asia Pacific Desktop Virtualization Market Overview
1.1. Definition and Scope
1.2. Market Taxonomy
1.3. Key Growth Metrics
1.4. Market Segmentation Overview
2. Asia Pacific Desktop Virtualization Market Size (In USD Mn)
2.1. Historical Market Size
2.2. Year-On-Year Growth Analysis
2.3. Key Developments and Milestones
3. Asia Pacific Desktop Virtualization Market Analysis
3.1. Growth Drivers
3.1.1. Rising Adoption of Cloud Computing
3.1.2. Increasing Remote Working Trends
3.1.3. Cost Efficiency in IT Operations
3.1.4. Government Digitalization Initiatives
3.2. Market Challenges
3.2.1. High Initial Setup Costs
3.2.2. Data Security Concerns
3.2.3. Lack of Skilled IT Personnel
3.3. Opportunities
3.3.1. Integration with AI & Automation
3.3.2. Growth of 5G Infrastructure
3.3.3. Expansion of Edge Computing
3.4. Trends
3.4.1. Shift to Hybrid Work Models
3.4.2. Increased Adoption of BYOD
3.4.3. Cloud-based Virtual Desktops
3.5. Government Regulations
3.5.1. Data Privacy Laws
3.5.2. IT Security Standards
3.5.3. National Digital Infrastructure Plans
3.6. SWOT Analysis
3.7. Stakeholder Ecosystem
3.8. Porters Five Forces
3.9. Competitive Landscape
4. Asia Pacific Desktop Virtualization Market Segmentation
4.1. By Product Type (In Value %)
4.1.1. Hosted Virtual Desktop (HVD)
4.1.2. Virtual Desktop Infrastructure (VDI)
4.1.3. Desktop-as-a-Service (DaaS)
4.2. By End-User Industry (In Value %)
4.2.1. IT & Telecommunications
4.2.2. BFSI
4.2.3. Education
4.2.4. Healthcare
4.2.5. Government
4.3. By Deployment Mode (In Value %)
4.3.1. On-Premises
4.3.2. Cloud-Based
4.4. By Organization Size (In Value %)
4.4.1. Small & Medium Enterprises (SMEs)
4.4.2. Large Enterprises
4.5. By Region (In Value %)
4.5.1. China
4.5.2. Japan
4.5.3. India
4.5.4. Australia
4.5.5. Southeast Asia
5. Asia Pacific Desktop Virtualization Market Competitive Analysis
5.1. Detailed Profiles of Major Competitors
5.1.1. Citrix Systems Inc.
5.1.2. VMware Inc.
5.1.3. Microsoft Corporation
5.1.4. Amazon Web Services (AWS)
5.1.5. Dell Technologies
5.1.6. Red Hat Inc.
5.1.7. Oracle Corporation
5.1.8. Parallels International
5.1.9. Nutanix Inc.
5.1.10. Hewlett Packard Enterprise (HPE)
5.1.11. Huawei Technologies Co. Ltd.
5.1.12. Cisco Systems Inc.
5.1.13. IGEL Technology
5.1.14. NComputing Co. Ltd.
5.1.15. Fujitsu Limited
5.2. Cross Comparison Parameters (Market-specific: Cloud Expertise, IT Security, Innovation in Virtualization, Market Reach, Customer Service, Pricing Strategy, Partner Network, Integration Capabilities)
5.3. Market Share Analysis
5.4. Strategic Initiatives
5.5. Mergers and Acquisitions
5.6. Investment Analysis
5.7. Venture Capital Funding
5.8. Government Grants
5.9. Private Equity Investments
6. Asia Pacific Desktop Virtualization Market Regulatory Framework
6.1. Data Localization Policies
6.2. IT Security Compliance Standards
6.3. Certification Processes
7. Asia Pacific Desktop Virtualization Future Market Size (In USD Mn)
7.1. Future Market Size Projections
7.2. Key Drivers for Future Growth
8. Asia Pacific Desktop Virtualization Future Market Segmentation
8.1. By Product Type (In Value %)
8.2. By End-User Industry (In Value %)
8.3. By Deployment Mode (In Value %)
8.4. By Organization Size (In Value %)
8.5. By Region (In Value %)
9. Asia Pacific Desktop Virtualization Market Analysts Recommendations
9.1. TAM/SAM/SOM Analysis
9.2. Customer Cohort Analysis
9.3. Marketing Strategies for Enhanced Adoption
9.4. Strategic White Space Opportunities
Disclaimer Contact UsResearch Methodology
Step 1: Identification of Key Variables
In this initial phase, we mapped the ecosystem for the Asia Pacific Desktop Virtualization Market, identifying key stakeholders including cloud service providers, IT departments, and governmental bodies. This process was supported by extensive desk research using secondary databases and proprietary insights, allowing us to define critical variables such as market growth drivers and industry challenges.
Step 2: Market Analysis and Construction
We compiled and analyzed historical data on desktop virtualization adoption across the Asia Pacific. Key performance indicators such as the ratio of service providers to marketplaces and revenue streams were assessed. Additionally, we measured service quality metrics to ensure the reliability and accuracy of revenue forecasts.
Step 3: Hypothesis Validation and Expert Consultation
Market hypotheses were validated through consultations with industry experts via computer-assisted telephone interviews (CATI). These experts provided in-depth insights into company performance, market trends, and strategic initiatives, enriching the market data with practical, real-world perspectives.
Step 4: Research Synthesis and Final Output
In the final phase, we engaged directly with major desktop virtualization providers to verify the gathered data. This allowed for an accurate synthesis of the market dynamics, supported by both top-down and bottom-up approaches, ensuring a comprehensive and validated analysis of the Asia Pacific Desktop Virtualization Market.
Frequently Asked Questions
1. How big is the Asia Pacific Desktop Virtualization Market?
The Asia Pacific Desktop Virtualization Market is valued at USD 3 billion, driven by the growing need for remote working solutions and cloud computing technologies. The market is supported by increasing digitalization efforts across industries.
2. What are the challenges in the Asia Pacific Desktop Virtualization Market?
Challenges include high initial setup costs, data security concerns, and the lack of skilled IT professionals. Organizations must invest in security measures and employee training to overcome these barriers.
3. Who are the major players in the Asia Pacific Desktop Virtualization Market?
Key players include Citrix Systems, VMware, Microsoft, Amazon Web Services, and Huawei. These companies dominate the market due to their strong product offerings, innovation, and extensive partner networks.
4. What are the growth drivers for the Asia Pacific Desktop Virtualization Market?
The market is driven by the adoption of cloud computing, increasing remote work trends, and advancements in desktop-as-a-service (DaaS) solutions. Government initiatives for digital transformation also play a critical role.
Why Buy From Us?
 Framework")
What makes us stand out is that our consultants follows Robust, Refine and Result (RRR) methodology. i.e. Robust for clear definitions, approaches and sanity checking, Refine for differentiating respondents facts and opinions and Result for presenting data with story

We have set a benchmark in the industry by offering our clients with syndicated and customized market research reports featuring coverage of entire market as well as meticulous research and analyst insights.

While we don't replace traditional research, we flip the method upside down. Our dual approach of Top Bottom & Bottom Top ensures quality deliverable by not just verifying company fundamentals but also looking at the sector and macroeconomic factors.

With one step in the future, our research team constantly tries to show you the bigger picture. We help with some of the tough questions you may encounter along the way: How is the industry positioned? Best marketing channel? KPI's of competitors? By aligning every element, we help maximize success.

Our report gives you instant access to the answers and sources that other companies might choose to hide. We elaborate each steps of research methodology we have used and showcase you the sample size to earn your trust.

If you need any support, we are here! We pride ourselves on universe strength, data quality, and quick, friendly, and professional service.