
Asia Pacific Digital Signage Market Outlook to 2030
Region:China
Author(s):Sanjna Verma
Product Code:KROD3675
Region:China
Author(s):Sanjna Verma
Product Code:KROD3675
October 2024
98
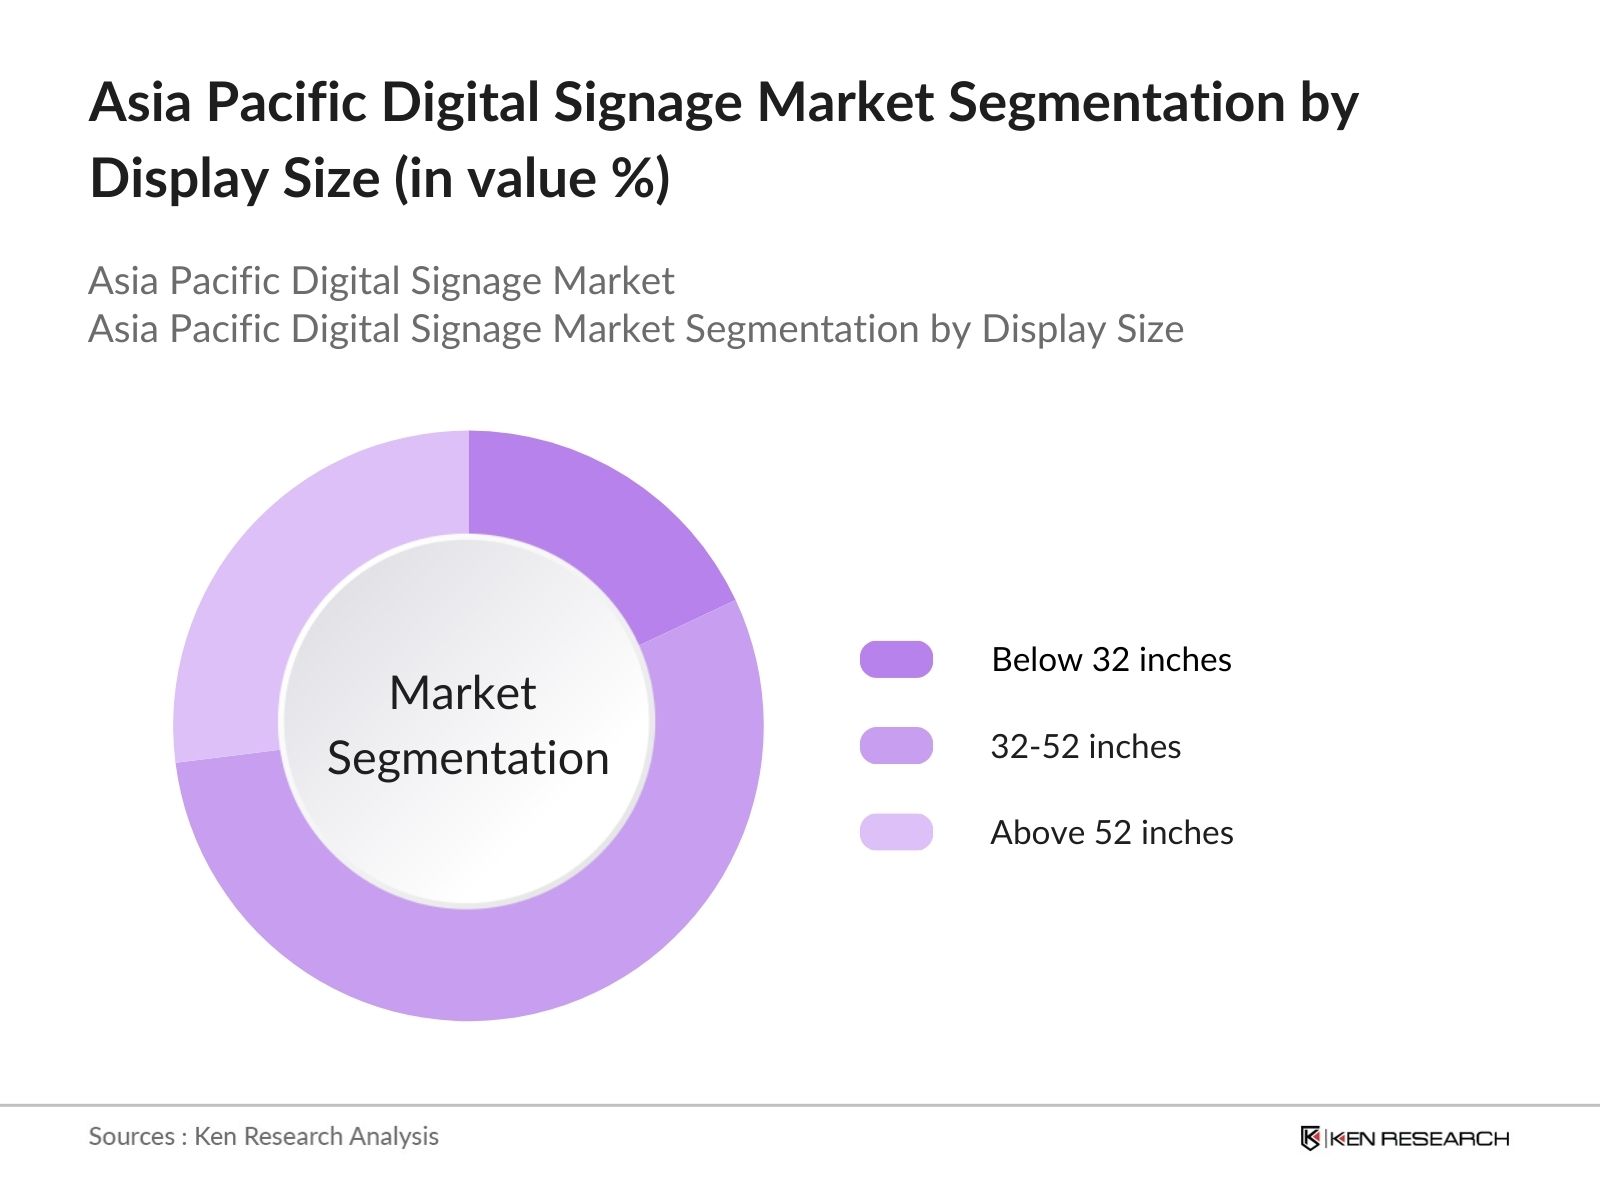
By Display Size: The Asia Pacific Digital Signage market is segmented by display size into below 32 inches, 32-52 inches, and above 52 inches. Among these, the 32-52 inches segment dominates the market, driven by its versatile application across retail outlets, educational institutions, corporate offices, and hospitality venues. This segment provides the perfect balance between visual clarity and affordability, making it a preferred choice for businesses looking to engage customers with dynamic advertising content. Additionally, its compatibility with modern interactive features such as touchscreens and gesture controls further boosts its adoption.
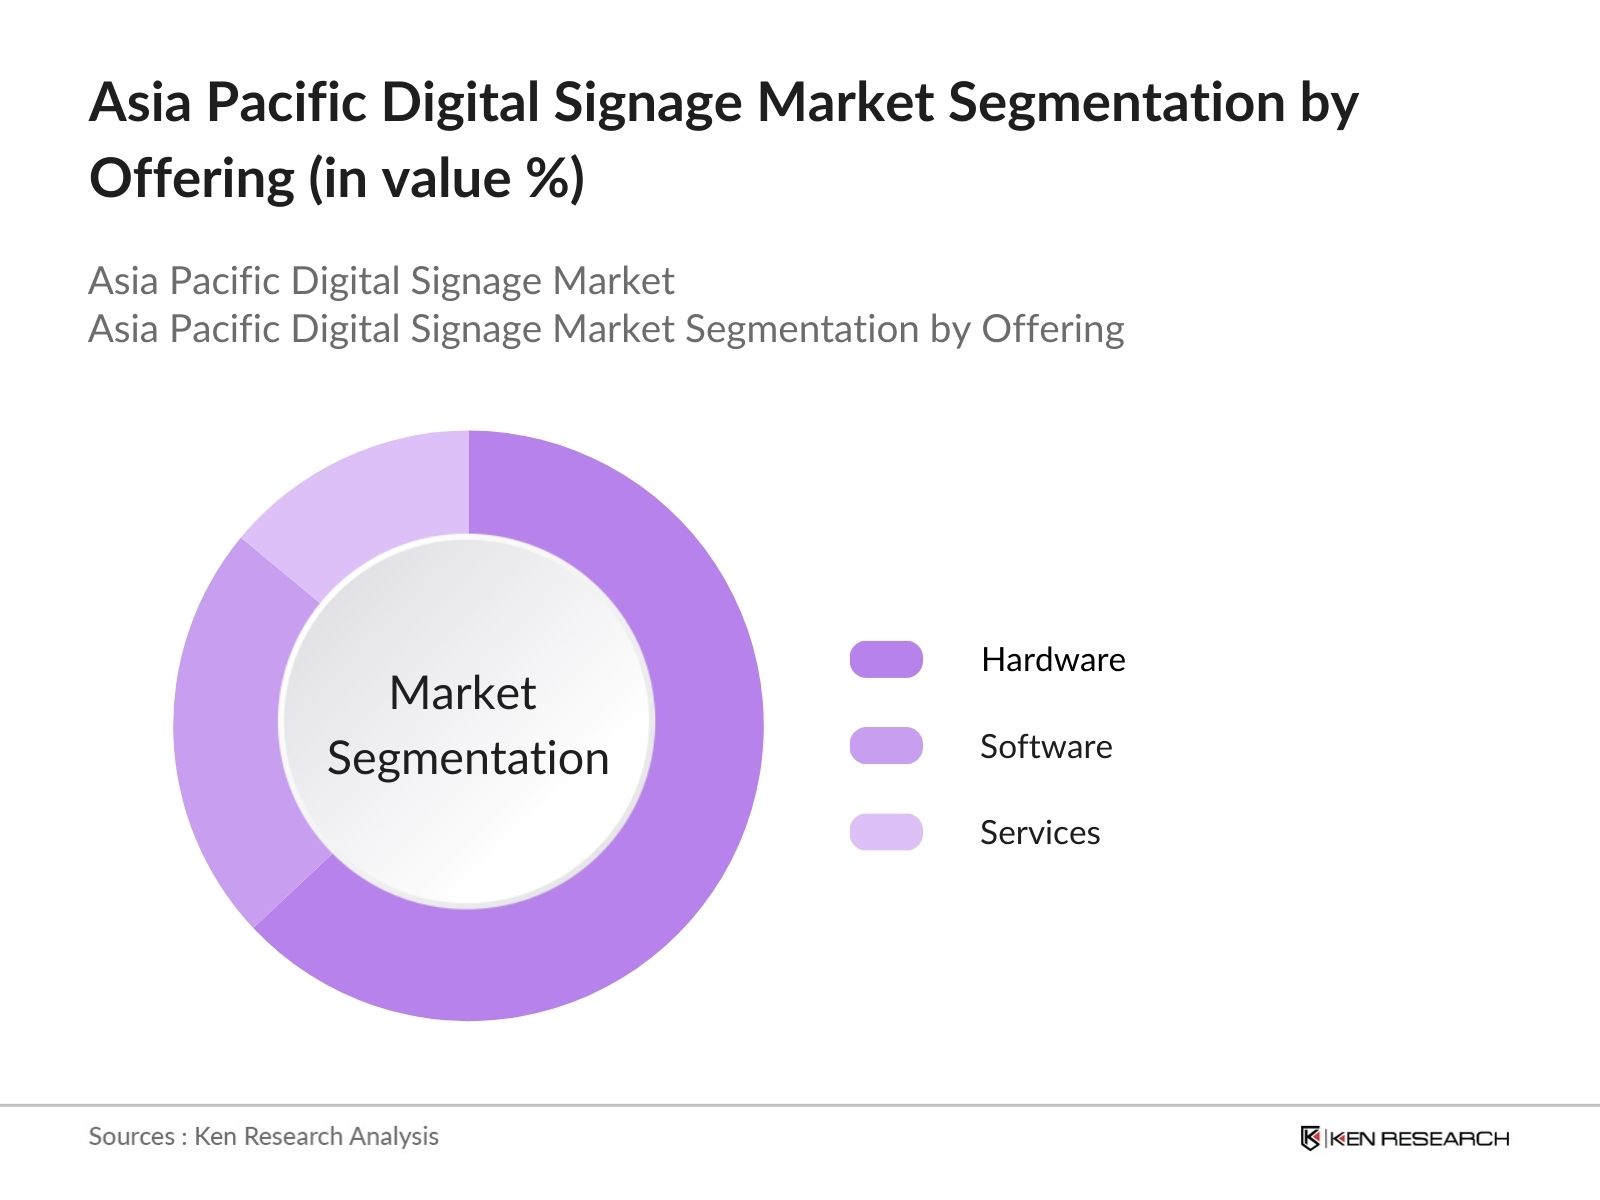
By Offering: The market is also segmented by offering into hardware, software, and services. The hardware segment holds the largest market share in 2023 due to the high demand for physical display units such as LED and OLED screens, media players, and mounting systems. Advanced display technologies like ultra-high-definition (UHD) screens are becoming more popular, contributing significantly to hardware sales. Additionally, the growing preference for energy-efficient, eco-friendly hardware solutions with superior visual quality supports the dominance of this segment.
The Asia Pacific Digital Signage market is characterized by the presence of several key players, including local manufacturers and multinational technology companies. Companies from Japan, South Korea, and China dominate the market due to their technological expertise and their strong presence in the broader electronics and display industries. These companies offer innovative products, ranging from basic display systems to advanced interactive signage solutions with integrated AI capabilities.
| Company | Establishment Year | Headquarters | Revenue | R&D Investment | Key Partnerships | Product Portfolio | Geographical Reach | Technological Innovations |
|---|---|---|---|---|---|---|---|---|
| Samsung Electronics | 1969 | Suwon, South Korea | - | - | - | - | - | - |
| LG Electronics | 1958 | Seoul, South Korea | - | - | - | - | - | - |
| NEC Display Solutions | 1899 | Tokyo, Japan | - | - | - | - | - | - |
| Sony Corporation | 1946 | Tokyo, Japan | - | - | - | - | - | - |
| Sharp Corporation | 1912 | Sakai, Japan | - | - | - | - | - | - |
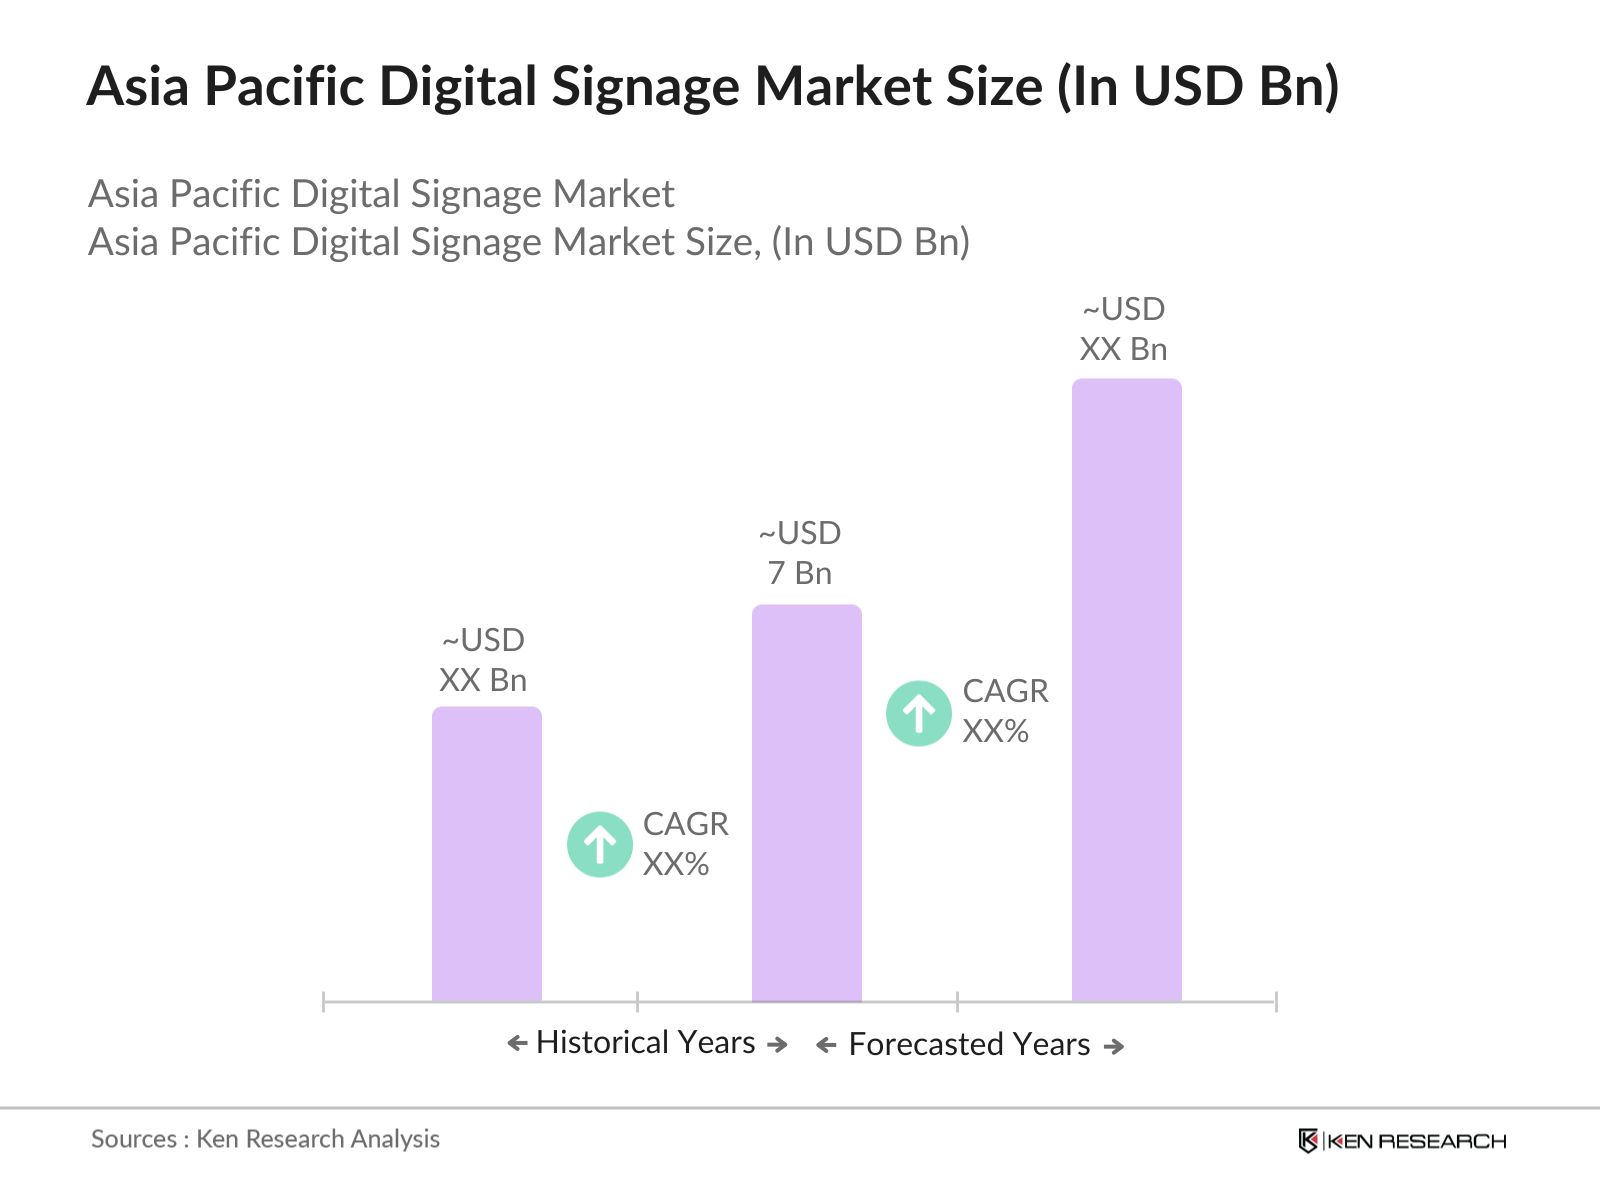
Over the next five years, the Asia Pacific Digital Signage market is expected to experience significant growth, driven by increased investments in smart city initiatives, technological advancements, and the expanding retail and hospitality sectors. The integration of AI, IoT, and cloud-based solutions in digital signage systems will enhance personalization and interactivity, making signage more engaging for end-users. The market will also benefit from the growing demand for energy-efficient, eco-friendly solutions in compliance with stringent environmental regulations.
|
Segment |
Sub-Segment |
|
By Display Size |
Below 32 Inches |
|
32-52 Inches |
|
|
Above 52 Inches |
|
|
By Offering |
Hardware |
|
Software |
|
|
Services |
|
|
By Application |
Indoor |
|
Outdoor |
|
|
By Industry Vertical |
Retail |
|
Hospitality |
|
|
Education |
|
|
Healthcare |
|
|
Transportation |
|
|
By Region |
East Asia |
|
South Asia |
|
|
Southeast Asia |
|
|
Oceania |
1.1. Definition and Scope
1.2. Market Taxonomy
1.3. Market Growth Rate (CAGR, Revenue, and Volume)
1.4. Market Segmentation Overview (By Display Size, By Offering, By Application, By Industry Vertical, By Region)
2.1. Historical Market Size
2.2. Year-on-Year Growth Analysis
2.3. Key Market Developments and Milestones
3.1. Growth Drivers
3.1.1. Infrastructure Development
3.1.2. Technological Advancements
3.1.3. Government Initiatives
3.1.4. Corporate Demand
3.2. Market Challenges
3.2.1. High Initial Cost
3.2.2. Limited Awareness
3.2.3. Integration with Existing Systems
3.2.4. Cybersecurity Risks
3.3. Opportunities
3.3.1. Smart City Projects
3.3.2. Integration with AI
3.3.3. Expanding Retail and Hospitality Sectors
3.3.4. Content Personalization
3.4. Market Trends
3.4.1. Adoption of Interactive Displays
3.4.2. Cloud-Based Solutions
3.4.3. Green Digital Signage
3.4.4. 4K/8K Displays
3.5. Government Regulations
3.5.1. Digital Media Policies
3.5.2. Environmental Compliance for Display Technologies
3.5.3. Public-Private Partnerships for Smart Infrastructure
3.6. SWOT Analysis
3.7. Stakeholder Ecosystem (Manufacturers, Integrators, Software Developers, Service Providers)
3.8. Porter’s Five Forces (Supplier Power, Buyer Power, Threat of New Entrants, Threat of Substitutes, Competitive Rivalry)
3.9. Competition Ecosystem
4.1. By Display Size (In Value %)
4.1.1. Below 32 Inches
4.1.2. 32-52 Inches
4.1.3. Above 52 Inches
4.2. By Offering (In Value %)
4.2.1. Hardware
4.2.2. Software
4.2.3. Services
4.3. By Application (In Value %)
4.3.1. Indoor
4.3.2. Outdoor
4.4. By Industry Vertical (In Value %)
4.4.1. Retail
4.4.2. Hospitality
4.4.3. Education
4.4.4. Healthcare
4.4.5. Transportation
4.5. By Region (In Value %)
4.5.1. East Asia
4.5.2. South Asia
4.5.3. Southeast Asia
4.5.4. Oceania
5.1. Detailed Profiles of Major Companies
5.1.1. Samsung Electronics
5.1.2. LG Electronics
5.1.3. NEC Display Solutions
5.1.4. Sony Corporation
5.1.5. Panasonic Corporation
5.1.6. Sharp Corporation
5.1.7. Scala
5.1.8. Planar Systems
5.1.9. ViewSonic Corporation
5.1.10. BrightSign LLC
5.1.11. AOPEN Inc.
5.1.12. Intel Corporation
5.1.13. Leyard Optoelectronic
5.1.14. AU Optronics
5.1.15. E Ink Holdings
5.2. Cross Comparison Parameters (Revenue, Market Share, Installed Base, Key Partnerships, Number of Patents, Product Offering, Geographic Reach, Employee Count)
5.3. Market Share Analysis
5.4. Strategic Initiatives (Mergers & Acquisitions, New Product Launches, Joint Ventures)
5.5. Investment Analysis (Private Equity, Venture Capital, Government Initiatives)
6.1. Compliance Standards (Energy Consumption, Display Safety, Electromagnetic Compatibility)
6.2. Industry Certifications (ISO Standards, Eco-Labels, Digital Media Standards)
6.3. Government Policies and Initiatives (Smart City Mandates, Digital Communication Guidelines, Incentives for Green Technology)
7.1. Future Market Size Projections
7.2. Key Factors Driving Future Market Growth
8.1. By Display Size (In Value %)
8.2. By Offering (In Value %)
8.3. By Application (In Value %)
8.4. By Industry Vertical (In Value %)
8.5. By Region (In Value %)
9.1. TAM/SAM/SOM Analysis
9.2. Product-Market Fit Analysis
9.3. Strategic Marketing Initiatives
9.4. White Space Opportunity Analysis
The initial phase involves constructing an ecosystem map encompassing all major stakeholders within the Asia Pacific Digital Signage Market. This step is supported by extensive desk research, leveraging secondary and proprietary databases to gather comprehensive industry-level information. The key variables include display technology advancements, market demand, and industry trends.
This step involves compiling and analyzing historical data related to the digital signage market. The analysis includes market penetration rates, technological development, and industry vertical analysis. Furthermore, we evaluate data on geographic distribution, industry trends, and growth drivers to construct a holistic market model.
Hypotheses regarding market growth and challenges are validated through expert consultations. These include interviews with executives from leading digital signage companies and other key stakeholders. The consultations provide valuable insights into operational strategies, revenue patterns, and challenges faced by businesses.
The final phase involves synthesizing the collected data and insights to produce the report. A bottom-up approach is used to verify the statistical data, complemented by detailed interviews with digital signage solution providers. This ensures a comprehensive and validated analysis of the Asia Pacific Digital Signage Market.
The Asia Pacific Digital Signage Market was valued at USD 7 billion in 2023, driven by the rising demand for dynamic advertising and consumer engagement solutions, particularly in retail and hospitality sectors.
Challenges in the Asia Pacific Digital Signage market include high initial costs of installation, cybersecurity concerns due to interconnected systems, and limited awareness in emerging markets, which slows the pace of adoption.
The major players in Asia Pacific Digital Signage Market include Samsung Electronics, LG Electronics, NEC Display Solutions, Sony Corporation, and Sharp Corporation. These companies dominate due to their technological advancements and extensive product portfolios.
Growth drivers of Asia Pacific Digital Signage Market include advancements in display technology, the rise of smart city projects, and increasing consumer demand for dynamic, interactive advertising solutions. Government initiatives supporting digital transformation also play a crucial role.
 Framework")
What makes us stand out is that our consultants follows Robust, Refine and Result (RRR) methodology. i.e. Robust for clear definitions, approaches and sanity checking, Refine for differentiating respondents facts and opinions and Result for presenting data with story

We have set a benchmark in the industry by offering our clients with syndicated and customized market research reports featuring coverage of entire market as well as meticulous research and analyst insights.

While we don't replace traditional research, we flip the method upside down. Our dual approach of Top Bottom & Bottom Top ensures quality deliverable by not just verifying company fundamentals but also looking at the sector and macroeconomic factors.

With one step in the future, our research team constantly tries to show you the bigger picture. We help with some of the tough questions you may encounter along the way: How is the industry positioned? Best marketing channel? KPI's of competitors? By aligning every element, we help maximize success.

Our report gives you instant access to the answers and sources that other companies might choose to hide. We elaborate each steps of research methodology we have used and showcase you the sample size to earn your trust.

If you need any support, we are here! We pride ourselves on universe strength, data quality, and quick, friendly, and professional service.