


Asia Pacific Ethylene Glycol Market Outlook to 2030
Region:Asia
Author(s):Meenakshi Bisht
Product Code:KROD7728
November 2024
97
About the Report
Asia Pacific Ethylene Glycol Market Overview
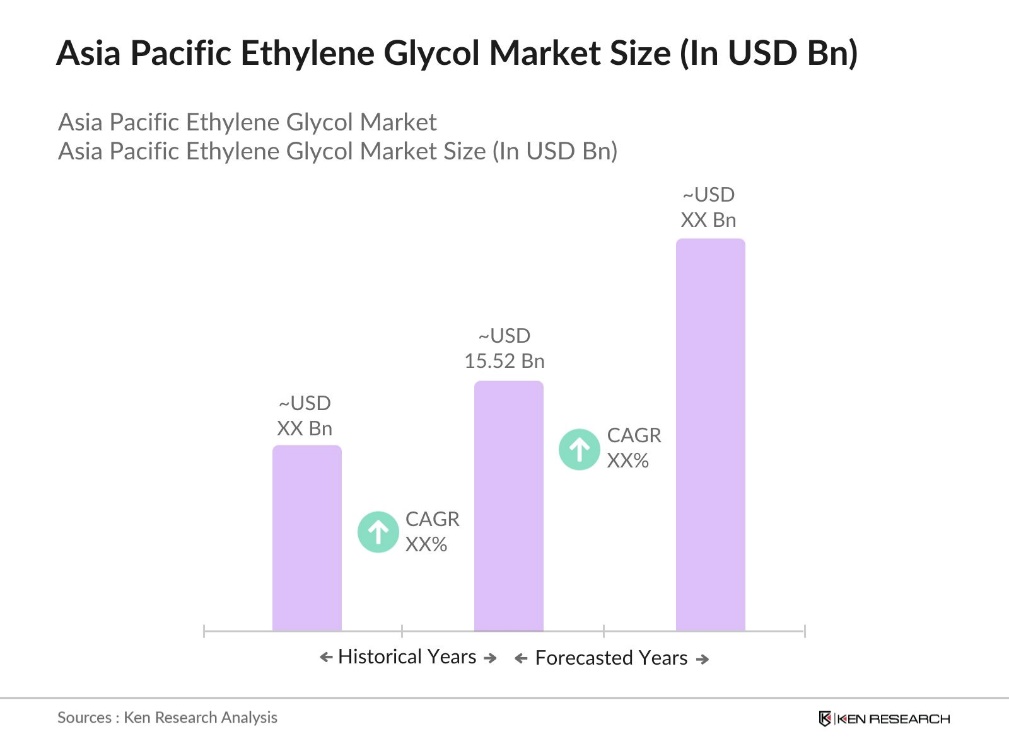
- The Asia Pacific ethylene glycol market is valued at USD 15.52 billion, driven by the expanding textile and automotive industries. Ethylene glycol's role in producing polyester fibers and antifreeze solutions underpins this growth.
- China and India dominate the market due to their robust manufacturing sectors and increasing demand for polyester fibers and automotive coolants. These countries' industrial growth and infrastructural developments contribute significantly to their market leadership.
- The Asia Pacific region's trade policies, including tariffs and import-export regulations, play a crucial role in the ethylene glycol market. For example, in 2023, India increased import tariffs on ethylene glycol from non-ASEAN countries, aiming to promote domestic production and reduce reliance on imports. This policy change has impacted international suppliers and encouraged local manufacturers to enhance their production capabilities.
Asia Pacific Ethylene Glycol Market Segmentation
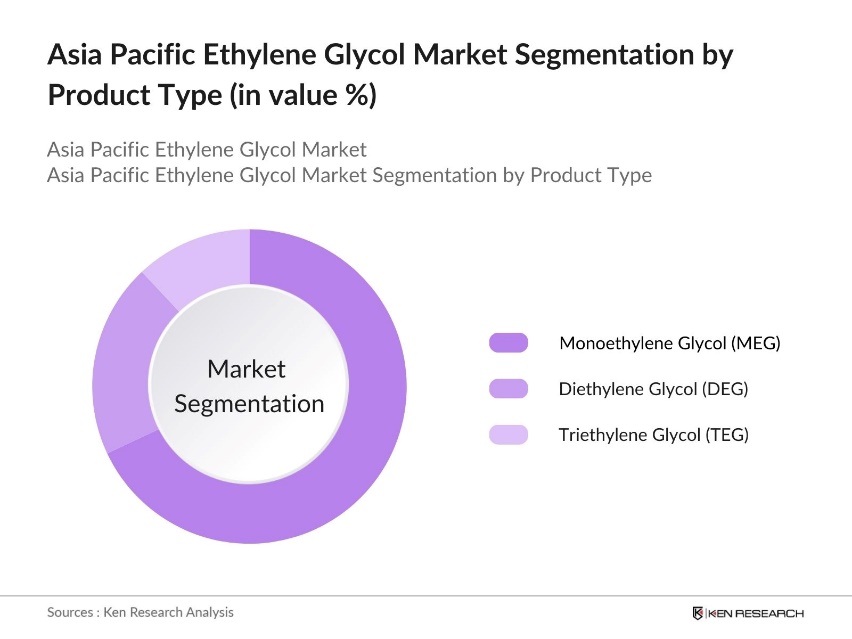
By Product Type: The market is segmented by product type into Monoethylene Glycol (MEG), Diethylene Glycol (DEG), and Triethylene Glycol (TEG). MEG holds a dominant market share due to its extensive use in producing polyester fibers and polyethylene terephthalate (PET) resins, essential for textiles and packaging industries. The high demand for these products in the region's growing economies reinforces MEG's leading position.
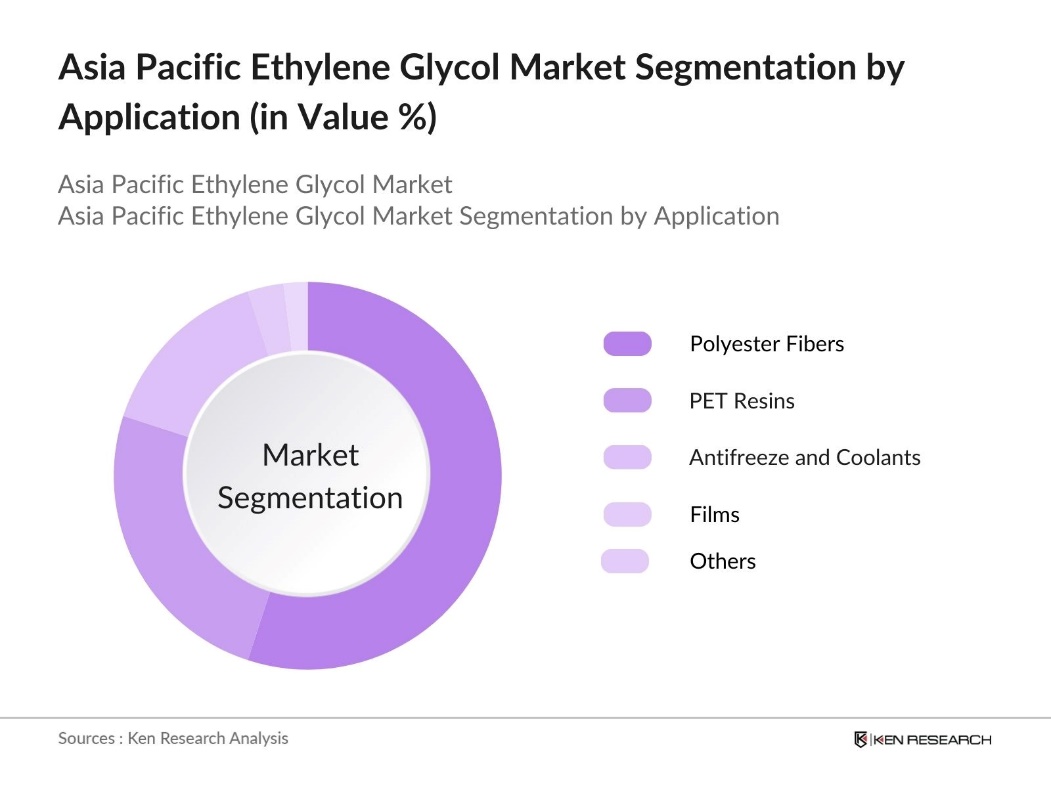
By Application: The market is segmented by application into Polyester Fibers, PET Resins, Antifreeze and Coolants, and Others. Polyester Fibers dominate this segment, driven by the booming textile industry in Asia Pacific. The versatility, durability, and cost-effectiveness of polyester fibers make them a preferred choice in apparel and home furnishings, leading to their substantial market share.
Asia Pacific Ethylene Glycol Market Competitive Landscape
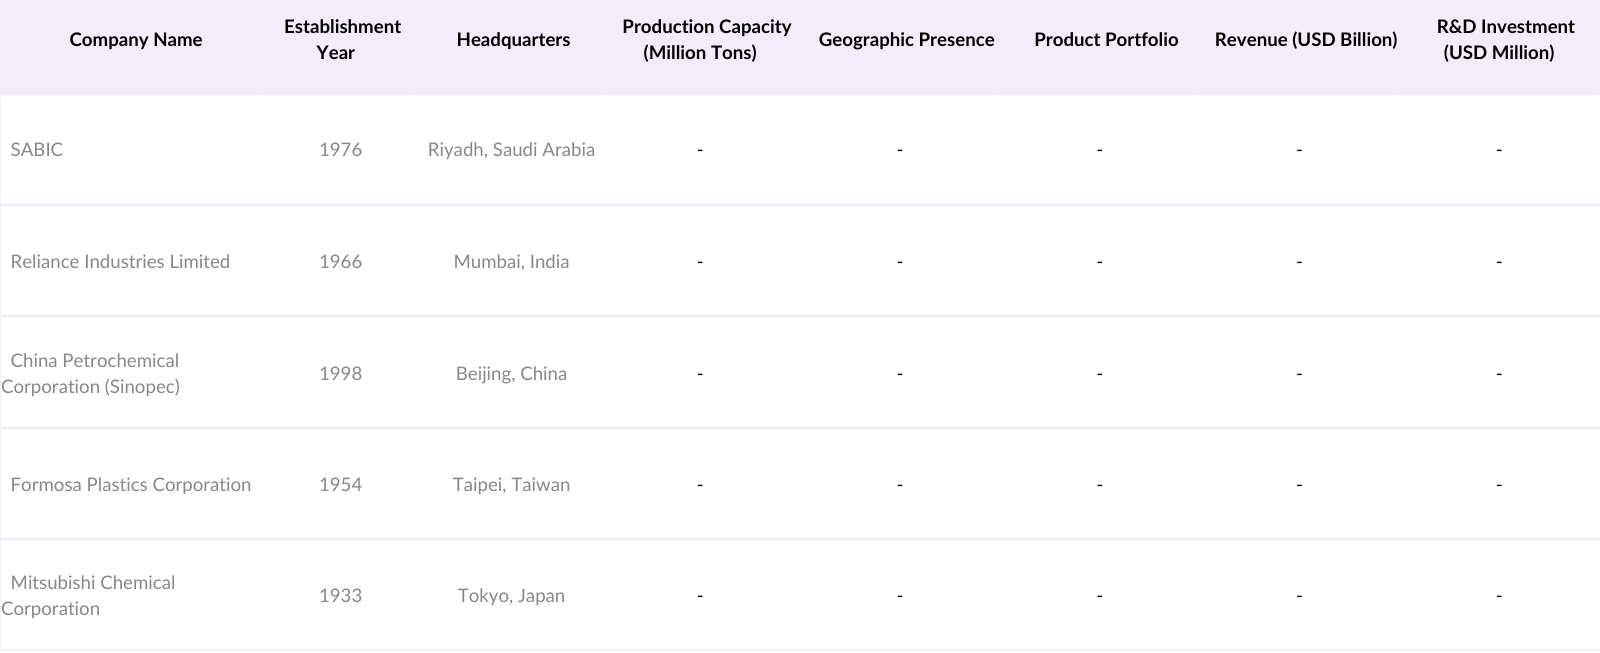
The Asia Pacific ethylene glycol market features key players such as SABIC, Reliance Industries Limited, China Petrochemical Corporation (Sinopec), Formosa Plastics Corporation, and Mitsubishi Chemical Corporation. These companies leverage their extensive production capacities, strategic geographic presence, and diverse product portfolios to maintain competitive advantages.
Asia Pacific Ethylene Glycol Industry Analysis
Growth Drivers
- Expansion of Textile Industry: The Asia Pacific region has experienced significant growth in its textile industry, with countries like China and India leading global production. In 2022, China's textile exports reached $323 billion. India's textile sector also saw substantial growth, with exports in the same year. This expansion drives the demand for ethylene glycol, a key component in polyester fiber production, essential for textile manufacturing.
- Rising Automotive Production: The automotive industry in the Asia Pacific region has been on an upward trajectory. In 2023, China produced 28 million vehicles, maintaining its position as the world's largest automobile manufacturer. India's automotive production also increased, with over 5 million vehicles produced in the same year. Ethylene glycol is crucial in automotive applications, particularly in antifreeze and coolant formulations, making this sector a significant driver for its demand.
- Increasing Demand for PET Resins: PET resins are essential in packaging, especially for beverage containers, with the Asia Pacific region being a major consumer. Ethylene glycol, a key ingredient in PET production, sees rising demand due to the expanding packaging sector. Growth in beverage consumption and urbanization directly drives the need for PET-based products, making ethylene glycol increasingly important to meet the region's packaging requirements.
Market Challenges
- Volatility in Raw Material Prices: The ethylene glycol market is highly sensitive to changes in raw material prices, particularly ethylene, which is derived from crude oil. Price fluctuations, driven by various global factors, introduce uncertainty, impacting production costs and affecting profit margins for manufacturers. This volatility requires producers to adapt to changing costs to maintain competitiveness in the market.
- Environmental Regulations: Strict environmental regulations in the Asia Pacific region present challenges for the ethylene glycol industry. Countries are enforcing policies aimed at reducing emissions, compelling manufacturers to adopt cleaner, more sustainable production technologies. Compliance with these regulations often involves considerable investment in eco-friendly processes, which increases operational costs for industry players.
Asia Pacific Ethylene Glycol Market Future Outlook
Over the next five years, the Asia Pacific ethylene glycol market is expected to experience significant growth, driven by continuous industrial expansion, advancements in production technologies, and increasing demand for polyester fibers and PET resins. The region's focus on sustainable practices and bio-based alternatives will further influence market dynamics.
Market Opportunities
- Development of Bio-based Ethylene Glycol: Investing in bio-based ethylene glycol presents substantial growth opportunities, particularly in the Asia Pacific, where ample biomass resources support sustainable production methods. With growing consumer preference for eco-friendly products, several companies are advancing bio-based ethylene glycol initiatives to align with environmental goals and meet rising demand for greener alternatives.
- Growth in Emerging Economies: Rapid industrialization and urbanization in Asia Pacific's emerging economies, like Vietnam and Indonesia, are driving demand for ethylene glycol. Expanding sectors such as textiles, automotive, and packaging in these regions require ethylene glycol as a vital input, fueled by strong economic development and a growing industrial base.
Scope of the Report
|
Product Type |
Monoethylene Glycol (MEG) |
|
Application |
Polyester Fibers |
|
End-Use Industry |
Textile |
|
Manufacturing Process |
Ethylene Oxide Process |
|
Region |
China |
Products
Key Target Audience
Ethylene Glycol Manufacturers
Polyester Fiber Producers
PET Resin Manufacturers
Textile Industry
Packaging Industry
Investor and Venture Capitalist Firms
Government and Regulatory Bodies (e.g., Ministry of Industry and Information Technology of the People's Republic of China)
Banks and Financial Institutions
Companies
Players Mentioned in the Report
SABIC
Reliance Industries Limited
China Petrochemical Corporation (Sinopec)
Formosa Plastics Corporation
Mitsubishi Chemical Corporation
Lotte Chemical Corporation
India Glycols Limited
Shell Chemicals
BASF SE
Dow Inc.
Table of Contents
1. Asia Pacific Ethylene Glycol Market Overview
1.1 Definition and Scope
1.2 Market Taxonomy
1.3 Market Growth Rate
1.4 Market Segmentation Overview
2. Asia Pacific Ethylene Glycol Market Size (In USD Mn)
2.1 Historical Market Size
2.2 Year-On-Year Growth Analysis
2.3 Key Market Developments and Milestones
3. Asia Pacific Ethylene Glycol Market Analysis
3.1 Growth Drivers
3.1.1 Expansion of Textile Industry
3.1.2 Rising Automotive Production
3.1.3 Increasing Demand for PET Resins
3.1.4 Technological Advancements in Production Processes
3.2 Market Challenges
3.2.1 Volatility in Raw Material Prices
3.2.2 Environmental Regulations
3.2.3 Competition from Bio-based Alternatives
3.3 Opportunities
3.3.1 Development of Bio-based Ethylene Glycol
3.3.2 Growth in Emerging Economies
3.3.3 Investments in R&D for Sustainable Production
3.4 Trends
3.4.1 Adoption of Circular Economy Practices
3.4.2 Integration of Digital Technologies in Manufacturing
3.4.3 Strategic Collaborations and Joint Ventures
3.5 Government Regulations
3.5.1 Environmental Standards and Compliance
3.5.2 Trade Policies and Tariffs
3.5.3 Incentives for Sustainable Practices
3.6 SWOT Analysis
3.7 Stakeholder Ecosystem
3.8 Porters Five Forces Analysis
3.9 Competitive Landscape
4. Asia Pacific Ethylene Glycol Market Segmentation
4.1 By Product Type (In Value %)
4.1.1 Monoethylene Glycol (MEG)
4.1.2 Diethylene Glycol (DEG)
4.1.3 Triethylene Glycol (TEG)
4.2 By Application (In Value %)
4.2.1 Polyester Fibers
4.2.2 Polyethylene Terephthalate (PET) Resins
4.2.3 Antifreeze and Coolants
4.2.4 Films
4.2.5 Others
4.3 By End-Use Industry (In Value %)
4.3.1 Textile
4.3.2 Automotive
4.3.3 Packaging
4.3.4 Chemical
4.3.5 Others
4.4 By Manufacturing Process (In Value %)
4.4.1 Ethylene Oxide Process
4.4.2 Coal-Based Process
4.4.3 Bio-Based Process
4.4.4 Others
4.5 By Region (In Value %)
4.5.1 China
4.5.2 India
4.5.3 Japan
4.5.4 South Korea
4.5.5 Rest of Asia Pacific
5. Asia Pacific Ethylene Glycol Market Competitive Analysis
5.1 Detailed Profiles of Major Companies
5.1.1 SABIC
5.1.2 Reliance Industries Limited
5.1.3 China Petrochemical Corporation (Sinopec)
5.1.4 Formosa Plastics Corporation
5.1.5 Mitsubishi Chemical Corporation
5.1.6 Lotte Chemical Corporation
5.1.7 India Glycols Limited
5.1.8 Shell Chemicals
5.1.9 BASF SE
5.1.10 Dow Inc.
5.1.11 Huntsman Corporation
5.1.12 AkzoNobel N.V.
5.1.13 Clariant AG
5.1.14 Exxon Mobil Corporation
5.1.15 LyondellBasell Industries N.V.
5.2 Cross Comparison Parameters (Production Capacity, Geographic Presence, Product Portfolio, Revenue)
5.3 Market Share Analysis
5.4 Strategic Initiatives
5.5 Mergers and Acquisitions
5.6 Investment Analysis
5.7 Venture Capital Funding
5.8 Government Grants
5.9 Private Equity Investments
6. Asia Pacific Ethylene Glycol Market Regulatory Framework
6.1 Environmental Standards
6.2 Compliance Requirements
6.3 Certification Processes
7. Asia Pacific Ethylene Glycol Future Market Size (In USD Mn)
7.1 Future Market Size Projections
7.2 Key Factors Driving Future Market Growth
8. Asia Pacific Ethylene Glycol Future Market Segmentation
8.1 By Product Type (In Value %)
8.2 By Application (In Value %)
8.3 By End-Use Industry (In Value %)
8.4 By Manufacturing Process (In Value %)
8.5 By Region (In Value %)
9. Asia Pacific Ethylene Glycol Market Analysts Recommendations
9.1 Total Addressable Market (TAM), Serviceable Available Market (SAM), and Serviceable Obtainable Market (SOM) Analysis
9.2 Customer Cohort Analysis
9.3 Marketing Initiatives
9.4 White Space Opportunity Analysis
Disclaimer Contact UsResearch Methodology
Step 1: Identification of Key Variables
The initial phase involves constructing an ecosystem map encompassing all major stakeholders within the Asia Pacific Ethylene Glycol Market. This step is underpinned by extensive desk research, utilizing a combination of secondary and proprietary databases to gather comprehensive industry-level information. The primary objective is to identify and define the critical variables that influence market dynamics.
Step 2: Market Analysis and Construction
In this phase, we compile and analyze historical data pertaining to the Asia Pacific Ethylene Glycol Market. This includes assessing market penetration, the ratio of marketplaces to service providers, and the resultant revenue generation. Furthermore, an evaluation of service quality statistics is conducted to ensure the reliability and accuracy of the revenue estimates.
Step 3: Hypothesis Validation and Expert Consultation
Market hypotheses are developed and subsequently validated through computer-assisted telephone interviews (CATIs) with industry experts representing a diverse array of companies. These consultations provide valuable operational and financial insights directly from industry practitioners, which are instrumental in refining and corroborating the market data.
Step 4: Research Synthesis and Final Output
The final phase involves direct engagement with multiple ethylene glycol manufacturers to acquire detailed insights into product segments, sales performance, consumer preferences, and other pertinent factors. This interaction serves to verify and complement the statistics derived from the bottom-up approach, thereby ensuring a comprehensive, accurate, and validated analysis of the Asia Pacific Ethylene Glycol market.
Frequently Asked Questions
01. How big is the Asia Pacific Ethylene Glycol Market?
The Asia Pacific ethylene glycol market is valued at USD 15.52 billion, driven by the expanding textile and automotive industries.
02. What are the challenges in the Asia Pacific Ethylene Glycol Market?
Challenges in Asia Pacific ethylene glycol market include volatility in raw material prices, stringent environmental regulations, and competition from bio-based alternatives. These factors can impact production costs and market dynamics.
03. Who are the major players in the Asia Pacific Ethylene Glycol Market?
Key players Asia Pacific ethylene glycol market include SABIC, Reliance Industries Limited, China Petrochemical Corporation (Sinopec), Formosa Plastics Corporation, and Mitsubishi Chemical Corporation. These companies dominate due to their extensive production capacities, geographic presence, and established supply chains.
04. What drives the Asia Pacific Ethylene Glycol Market?
The Asia Pacific ethylene glycol market is propelled by rising demand in the textile and automotive industries, especially for polyester fibers and antifreeze solutions. The large-scale production of polyester textiles in countries like China and India is a major growth driver.
Why Buy From Us?
 Framework")
What makes us stand out is that our consultants follows Robust, Refine and Result (RRR) methodology. i.e. Robust for clear definitions, approaches and sanity checking, Refine for differentiating respondents facts and opinions and Result for presenting data with story

We have set a benchmark in the industry by offering our clients with syndicated and customized market research reports featuring coverage of entire market as well as meticulous research and analyst insights.

While we don't replace traditional research, we flip the method upside down. Our dual approach of Top Bottom & Bottom Top ensures quality deliverable by not just verifying company fundamentals but also looking at the sector and macroeconomic factors.

With one step in the future, our research team constantly tries to show you the bigger picture. We help with some of the tough questions you may encounter along the way: How is the industry positioned? Best marketing channel? KPI's of competitors? By aligning every element, we help maximize success.

Our report gives you instant access to the answers and sources that other companies might choose to hide. We elaborate each steps of research methodology we have used and showcase you the sample size to earn your trust.

If you need any support, we are here! We pride ourselves on universe strength, data quality, and quick, friendly, and professional service.