
Asia Pacific Graphite Market Outlook to 2030
Region:Asia
Author(s):Yogita Sahu
Product Code:KROD3705
Region:Asia
Author(s):Yogita Sahu
Product Code:KROD3705
October 2024
94
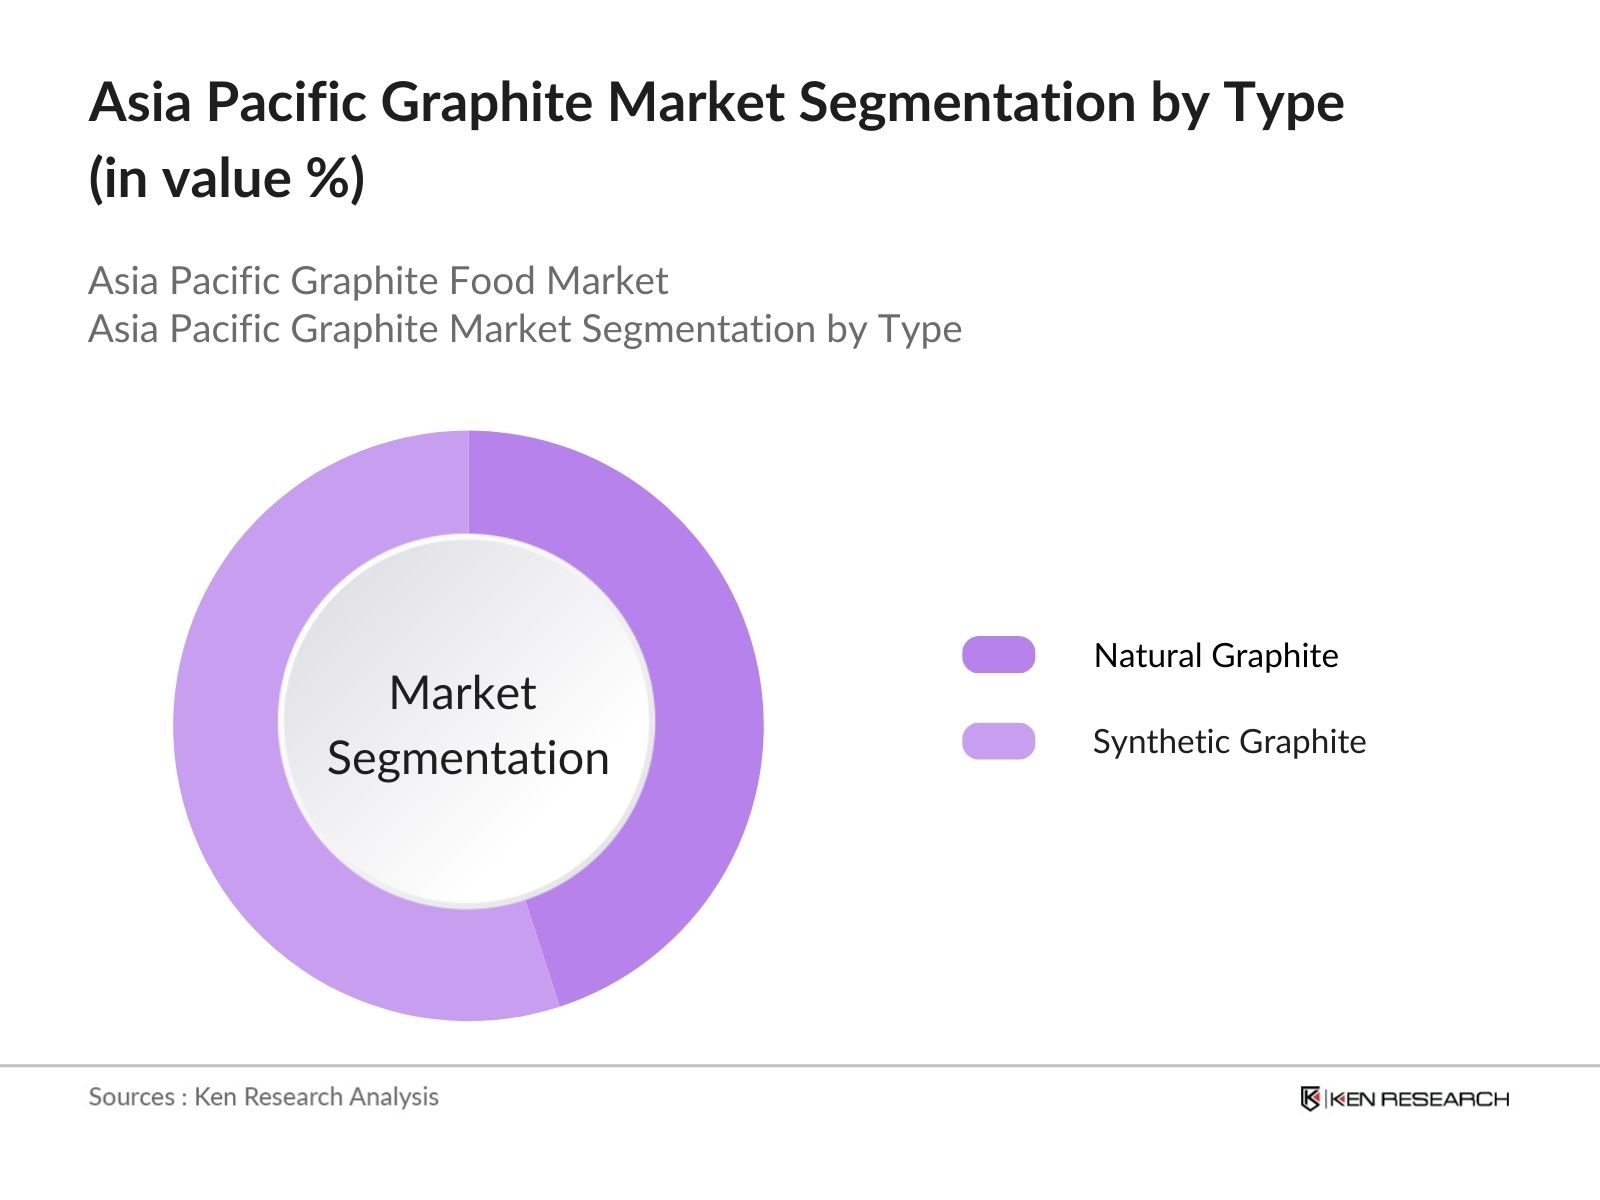
By Type: The market is segmented by type into Natural Graphite and Synthetic Graphite. Synthetic graphite has a dominant market share under this segmentation due to its higher purity, consistency, and suitability for specialized applications like lithium-ion batteries. This segment's dominance is further propelled by the large-scale manufacturing of batteries for electric vehicles in countries like China and South Korea, where synthetic graphite's superior performance enhances battery life and efficiency.
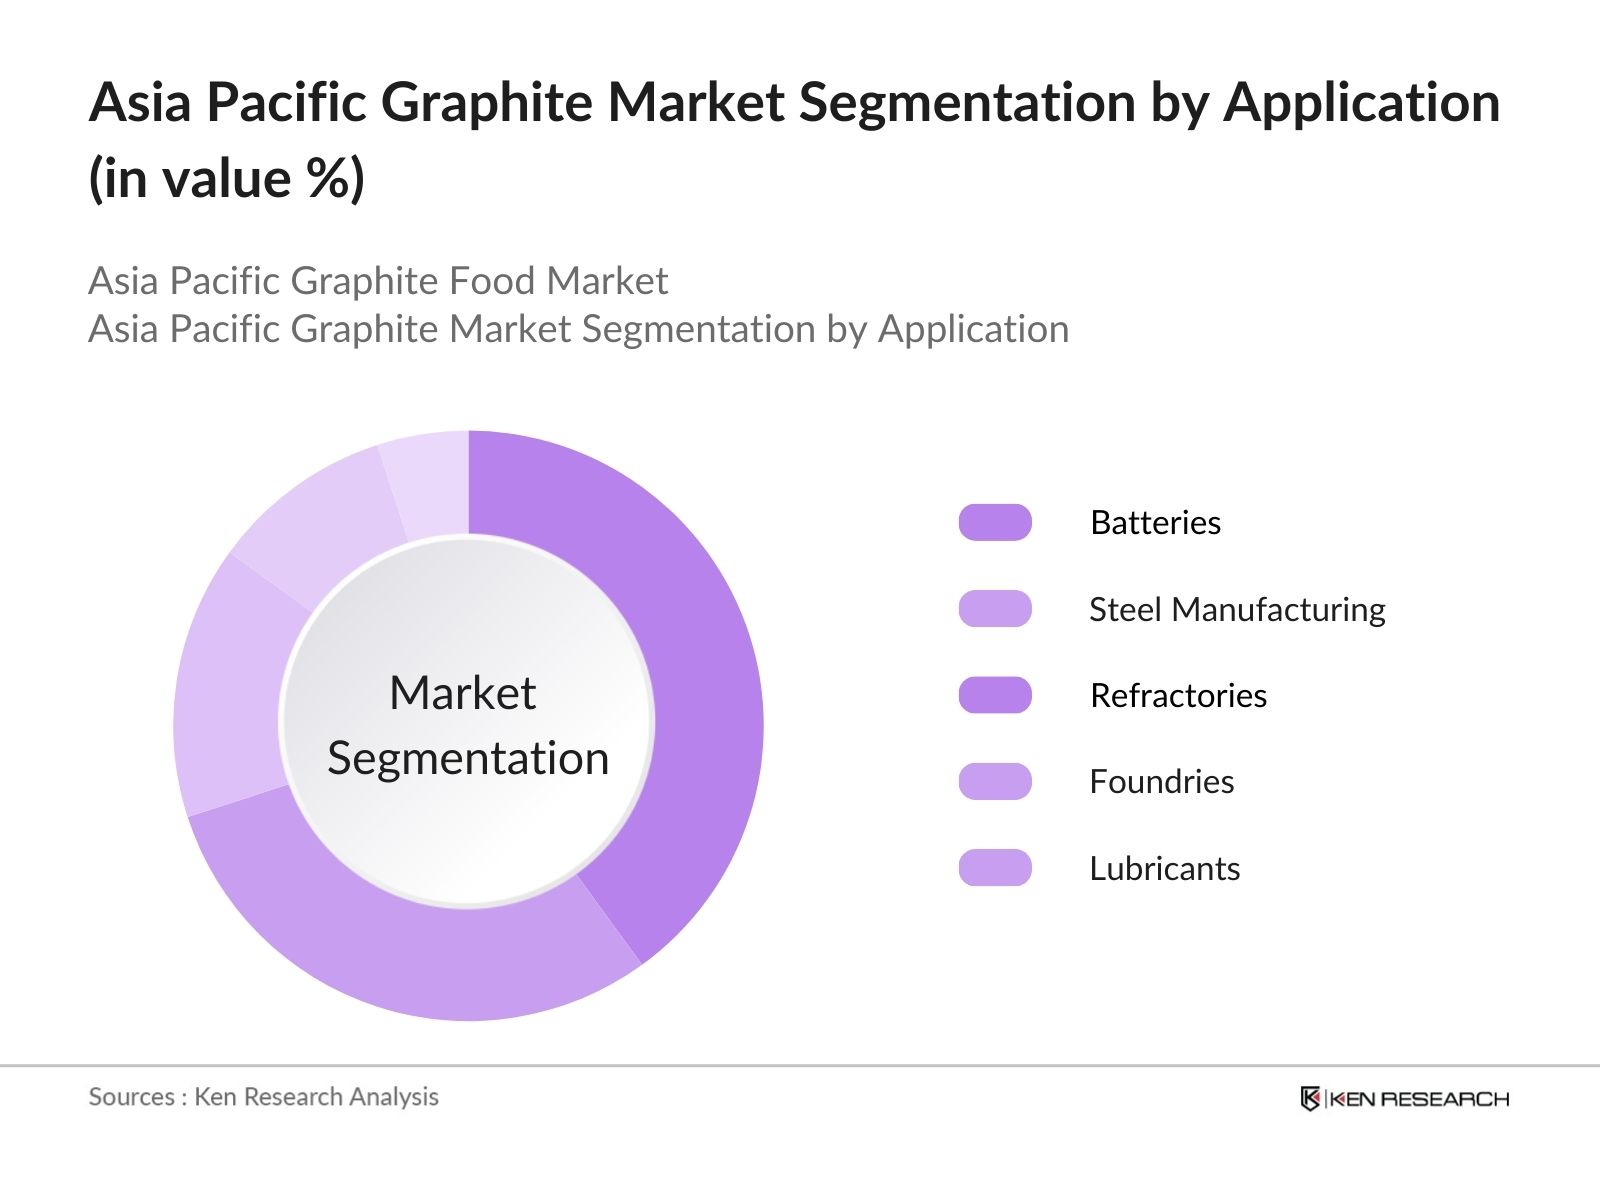
By Application: The market is also segmented by application into Batteries, Steel Manufacturing, Refractories, Foundries, and Lubricants. The Battery application holds a dominant market share due to the surging demand for electric vehicles and energy storage systems. As graphite is a crucial component of lithium-ion batteries, its demand is rising in tandem with the global push for electrification and green energy storage.
The market is characterized by the presence of both regional and global players. Major companies dominate the market through strategic investments, partnerships, and advancements in technology. China is home to many of these key players due to the abundance of natural resources and government support for mining and production.
|
Company |
Established |
Headquarters |
|
Syrah Resources Limited |
2007 |
Australia |
|
SGL Carbon SE |
1878 |
Germany |
|
GrafTech International Ltd. |
1886 |
USA |
|
Qingdao Haida Graphite Co. |
1988 |
China |
|
Nippon Graphite Industries |
1949 |
Japan |
Over the next five years, the Asia Pacific Graphite industry is expected to experience growth driven by the expanding electric vehicle industry, advancements in energy storage technologies, and increasing industrial demand. Governments in the region are providing support through favorable regulations for mining and export, as well as subsidies for industries involved in renewable energy and electric vehicle production.
|
Type |
Natural Graphite Synthetic Graphite |
|
Application |
Batteries Steel Manufacturing Refractories Foundries Lubricants |
|
Form |
Amorphous Graphite Flake Graphite Vein Graphite |
|
End-Use Industry |
Automotive Electronics Energy and Power Industrial Manufacturing |
|
Region |
China India Japan South Korea Australia Rest of APAC |
1.1. Definition and Scope
1.2. Market Taxonomy
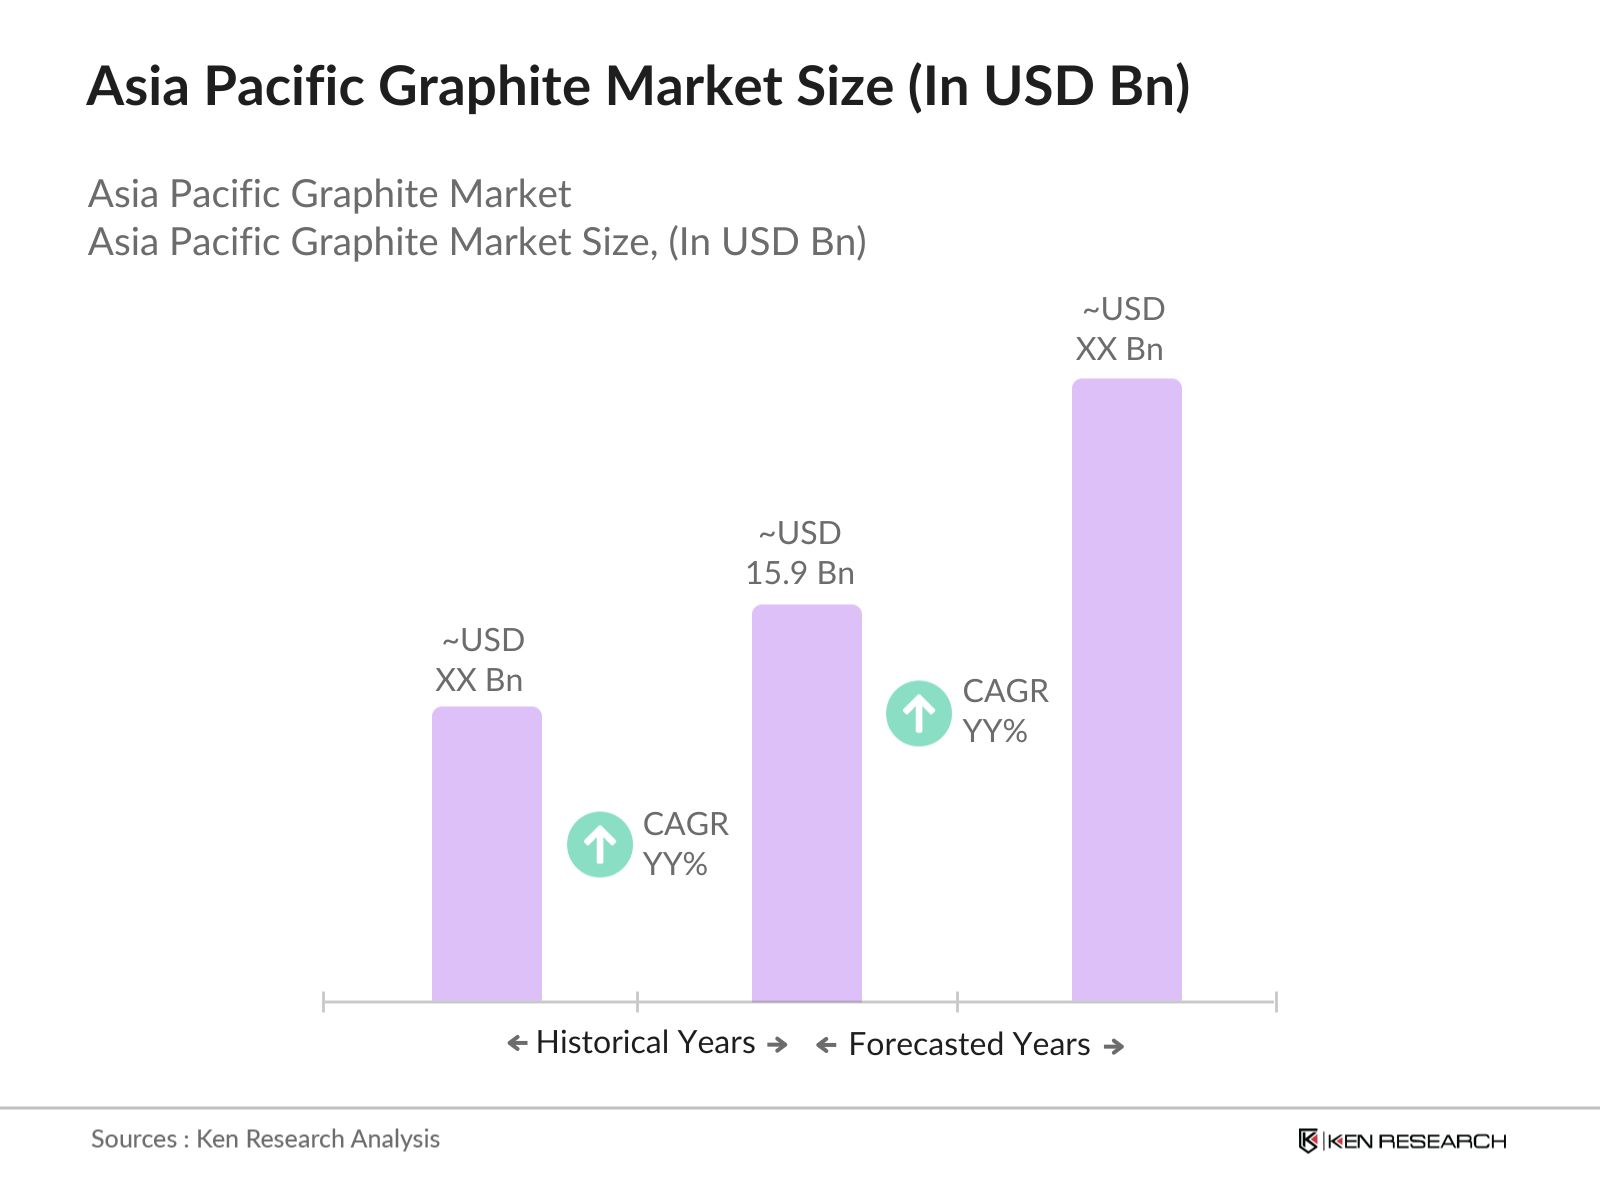
1.3. Market Growth Rate
1.4. Market Segmentation Overview
2.1. Historical Market Size
2.2. Year-on-Year Growth Analysis
2.3. Key Market Developments and Milestones
3.1. Growth Drivers
3.1.1. Expansion of Electric Vehicle (EV) Industry
3.1.2. Increase in Lithium-Ion Battery Production
3.1.3. Rising Demand in Steel Manufacturing
3.1.4. Growing Applications in Refractories and Foundries
3.2. Market Challenges
3.2.1. Environmental Regulations on Mining
3.2.2. Fluctuating Graphite Prices
3.2.3. Limited High-Quality Natural Graphite Supply
3.2.4. Competition from Synthetic Graphite
3.3. Opportunities
3.3.1. Graphene Research and Applications
3.3.2. Increasing Graphite Usage in Nuclear Reactors
3.3.3. Growing Adoption in Energy Storage Solutions
3.3.4. Expansion in the Asia Pacific Region's Industrial Sector
3.4. Trends
3.4.1. Adoption of Sustainable Mining Practices
3.4.2. Use of Artificial Intelligence in Mining Operations
3.4.3. Growing Demand for Graphite in 3D Printing Technologies
3.5. Government Regulations
3.5.1. Mining Licensing and Permits
3.5.2. Environmental Compliance Standards
3.5.3. Renewable Energy Policies Favoring Battery Adoption
3.5.4. Import and Export Restrictions
3.6. SWOT Analysis
3.7. Stakeholder Ecosystem
3.8. Porters Five Forces
3.9. Competition Ecosystem
4.1. By Type (In Value %)
4.1.1. Natural Graphite
4.1.2. Synthetic Graphite
4.2. By Application (In Value %)
4.2.1. Batteries (EVs, Consumer Electronics)
4.2.2. Steel Manufacturing
4.2.3. Refractories
4.2.4. Foundries
4.2.5. Lubricants
4.3. By Form (In Value %)
4.3.1. Amorphous Graphite
4.3.2. Flake Graphite
4.3.3. Vein Graphite
4.4. By End-Use Industry (In Value %)
4.4.1. Automotive
4.4.2. Electronics
4.4.3. Energy and Power
4.4.4. Industrial Manufacturing
4.5. By Region (In Value %)
4.5.1. China
4.5.2. India
4.5.3. Japan
4.5.4. South Korea
4.5.5. Australia
4.5.6. Rest of APAC
5.1. Detailed Profiles of Major Companies
5.1.1. Syrah Resources Limited
5.1.2. SGL Carbon SE
5.1.3. Showa Denko K.K.
5.1.4. Nippon Graphite Industries
5.1.5. GrafTech International Ltd.
5.1.6. HEG Ltd.
5.1.7. Tokai Carbon Co., Ltd.
5.1.8. Mitsubishi Chemical Corporation
5.1.9. China Graphite Group
5.1.10. Qingdao Haida Graphite Co., Ltd.
5.1.11. Tirupati Graphite PLC
5.1.12. Mason Graphite Inc.
5.1.13. Graphite India Ltd.
5.1.14. Northern Graphite Corporation
5.1.15. Asbury Carbons
5.2. Cross Comparison Parameters
5.3. Market Share Analysis
5.4. Strategic Initiatives
5.5. Mergers and Acquisitions
5.6. Investment Analysis
5.7. Venture Capital Funding
5.8. Private Equity Investments
6.1. Environmental Standards for Graphite Mining
6.2. Compliance Requirements for Graphite Exports
6.3. Safety and Health Regulations
6.4. Emission Control Standards for Manufacturing
7.1. Future Market Size Projections
7.2. Key Factors Driving Future Market Growth
8.1. By Type
8.2. By Application
8.3. By Form
8.4. By End-Use Industry
8.5. By Region
9.1. TAM/SAM/SOM Analysis
9.2. Customer Cohort Analysis
9.3. Marketing Initiatives
9.4. White Space Opportunity Analysis
This phase involves mapping out key stakeholders within the Asia Pacific Graphite Market. The team conducts detailed desk research using both proprietary and secondary data sources, identifying critical variables such as market dynamics, technology trends, and regulatory frameworks that influence market behavior.
In this phase, we analyze historical data on market penetration, usage in various industries, and the contribution of different product types to revenue generation. This data is supplemented by a comprehensive review of service quality and production statistics across key application areas such as batteries and steel manufacturing.
The initial market hypotheses are then validated through consultations with industry experts using computer-assisted telephone interviews (CATIs). These interviews provide first-hand insights from manufacturers and suppliers, helping to refine the market data.
The final phase involves synthesizing the data collected through both bottom-up and top-down approaches. Direct engagement with manufacturers and service providers further strengthens the accuracy of the report, ensuring a reliable and comprehensive analysis of the Asia Pacific Graphite Market.
The Asia Pacific Graphite market is valued at USD 15.9 billion, driven by increased demand from the electric vehicle and steel manufacturing sectors.
Challenges in the Asia Pacific Graphite market include environmental regulations, fluctuating graphite prices, and competition from synthetic alternatives. Ensuring sustainable mining practices is also a concern for manufacturers.
Key players in the Asia Pacific Graphite market include Syrah Resources, SGL Carbon, GrafTech International, Qingdao Haida Graphite Co., and Nippon Graphite Industries. These companies lead due to their technological advancements and large-scale production capacities.
Growth in the Asia Pacific Graphite market is driven by the rising demand for electric vehicles, lithium-ion batteries, and the steel manufacturing industry. Graphites importance in energy storage solutions is also a key factor.
Emerging trends in the Asia Pacific Graphite market include the use of artificial intelligence in mining operations, advancements in synthetic graphite production, and the increasing adoption of graphite in renewable energy systems such as energy storage and graphene production.
 Framework")
What makes us stand out is that our consultants follows Robust, Refine and Result (RRR) methodology. i.e. Robust for clear definitions, approaches and sanity checking, Refine for differentiating respondents facts and opinions and Result for presenting data with story

We have set a benchmark in the industry by offering our clients with syndicated and customized market research reports featuring coverage of entire market as well as meticulous research and analyst insights.

While we don't replace traditional research, we flip the method upside down. Our dual approach of Top Bottom & Bottom Top ensures quality deliverable by not just verifying company fundamentals but also looking at the sector and macroeconomic factors.

With one step in the future, our research team constantly tries to show you the bigger picture. We help with some of the tough questions you may encounter along the way: How is the industry positioned? Best marketing channel? KPI's of competitors? By aligning every element, we help maximize success.

Our report gives you instant access to the answers and sources that other companies might choose to hide. We elaborate each steps of research methodology we have used and showcase you the sample size to earn your trust.

If you need any support, we are here! We pride ourselves on universe strength, data quality, and quick, friendly, and professional service.