
Asia Pacific Optical Glass Market Outlook to 2030
Region:Asia
Author(s):Shreya Garg
Product Code:KROD7394
November 2024
82
About the Report
Asia Pacific Optical Glass Market Overview
The Asia Pacific optical glass market is valued at USD 16.9 billion, driven by technological advancements in the manufacturing process and increasing demand from various end-use industries, such as consumer electronics and automotive. The region's expansive growth is backed by the thriving electronics sector and robust R&D investments, fueling innovations in optical materials. Additionally, increasing utilization in medical imaging and telecommunication further bolsters the market's expansion. 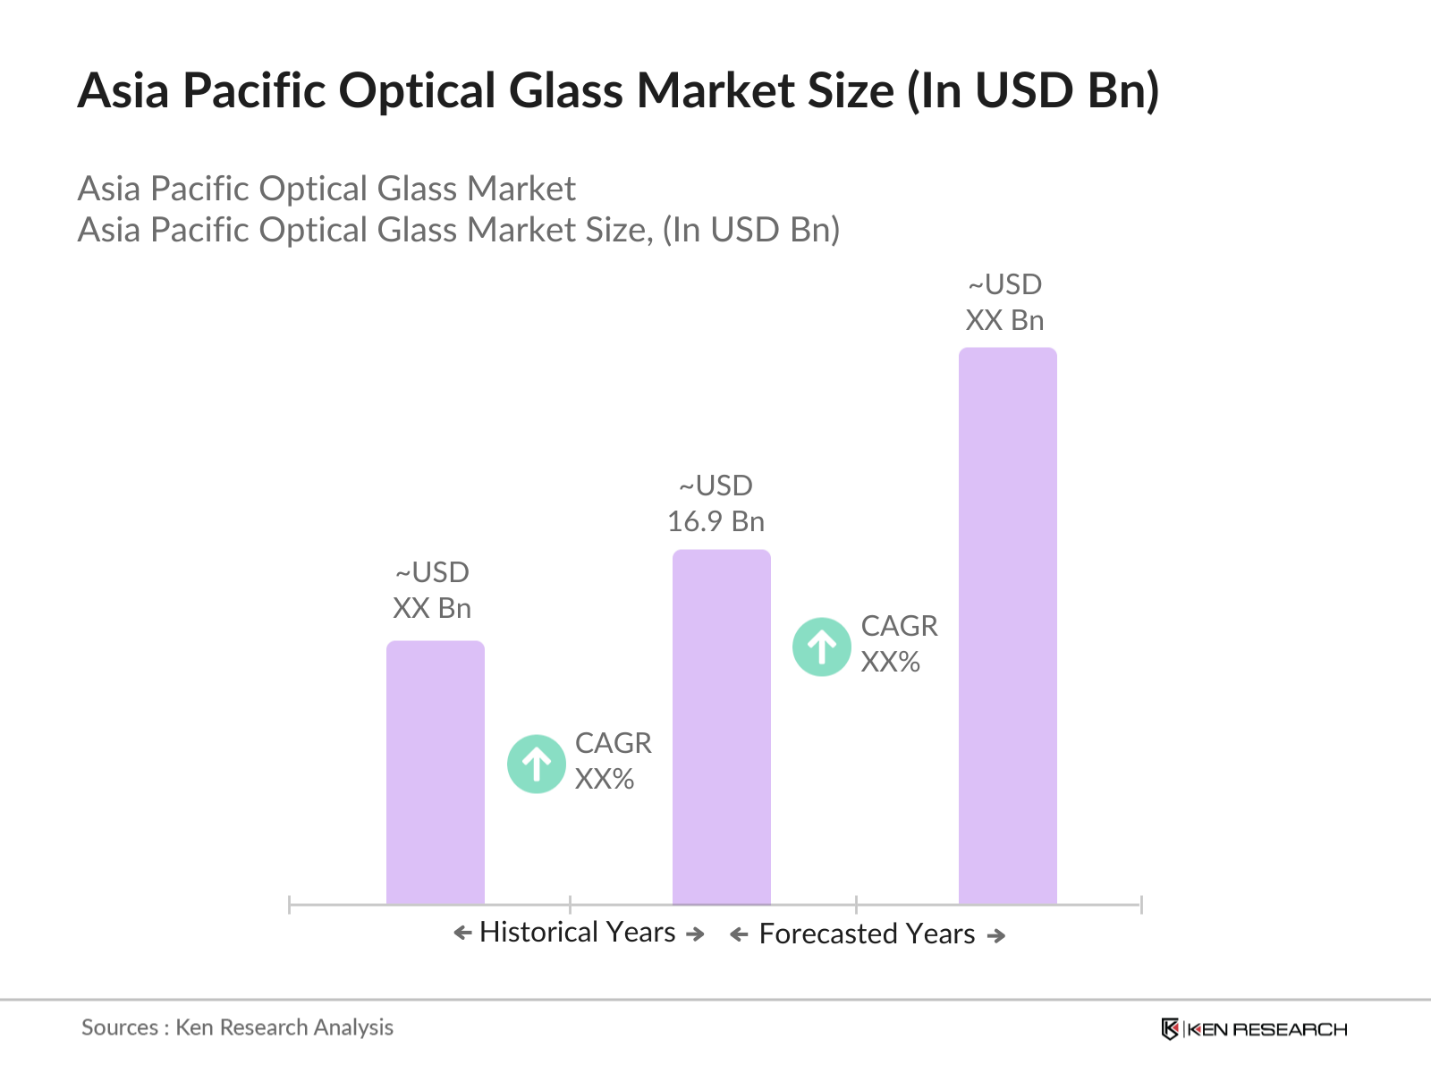
Countries like China and Japan dominate the market due to their strong industrial base, extensive manufacturing capabilities, and a high number of key market players with established supply chains. Chinas significant production output and Japans reputation for high-quality optics contribute to their leading positions. Both countries benefit from a well-developed technological ecosystem and extensive support for innovation.
Governments in Asia Pacific have implemented stringent import and export policies impacting the optical glass market. According to the IMFs 2024 trade report, stricter quality controls and tariff regulations in major exporting countries like Japan and South Korea have shaped the flow of optical products. These regulations aim to protect domestic industries and ensure that products meet high standards for safety and quality, influencing global trade dynamics in optical glass.
Asia Pacific Optical Glass Market Segmentation
By Product Type: The market is segmented by product type into high-transmission glass, low-dispersion glass, radiation-resistant glass, and specialty optical glass. High-transmission glass holds a dominant market share due to its widespread use in consumer electronics and telecommunication equipment, driven by the demand for enhanced optical clarity and efficiency. Manufacturers prioritize this segment for its consistent performance and versatility, which aligns with the evolving technological requirements of modern applications. 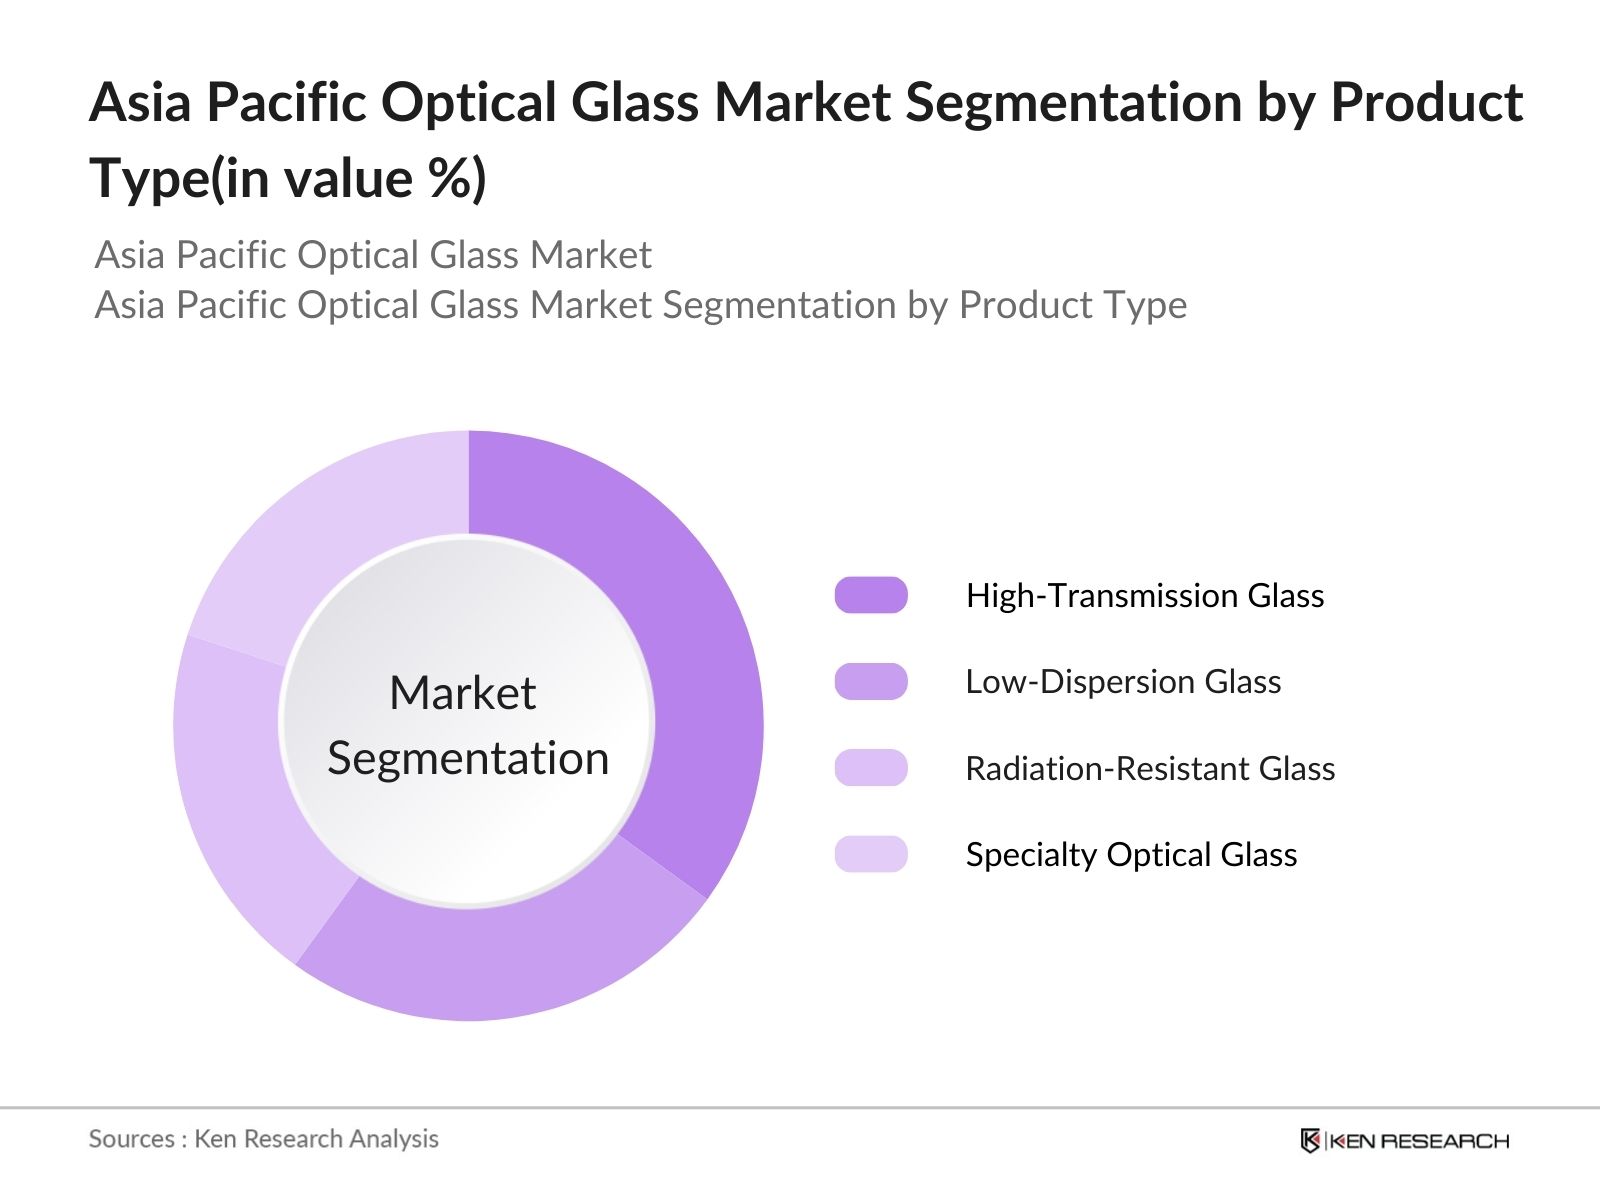
By End-Use Industry: The market is also segmented by end-use industry, including consumer electronics, automotive, medical devices, aerospace & defense, and industrial machinery. The consumer electronics segment dominates, driven by continuous innovations in smartphones, cameras, and display technologies. The need for high-precision and durable optical components in these devices has reinforced the segment's leadership in market share. 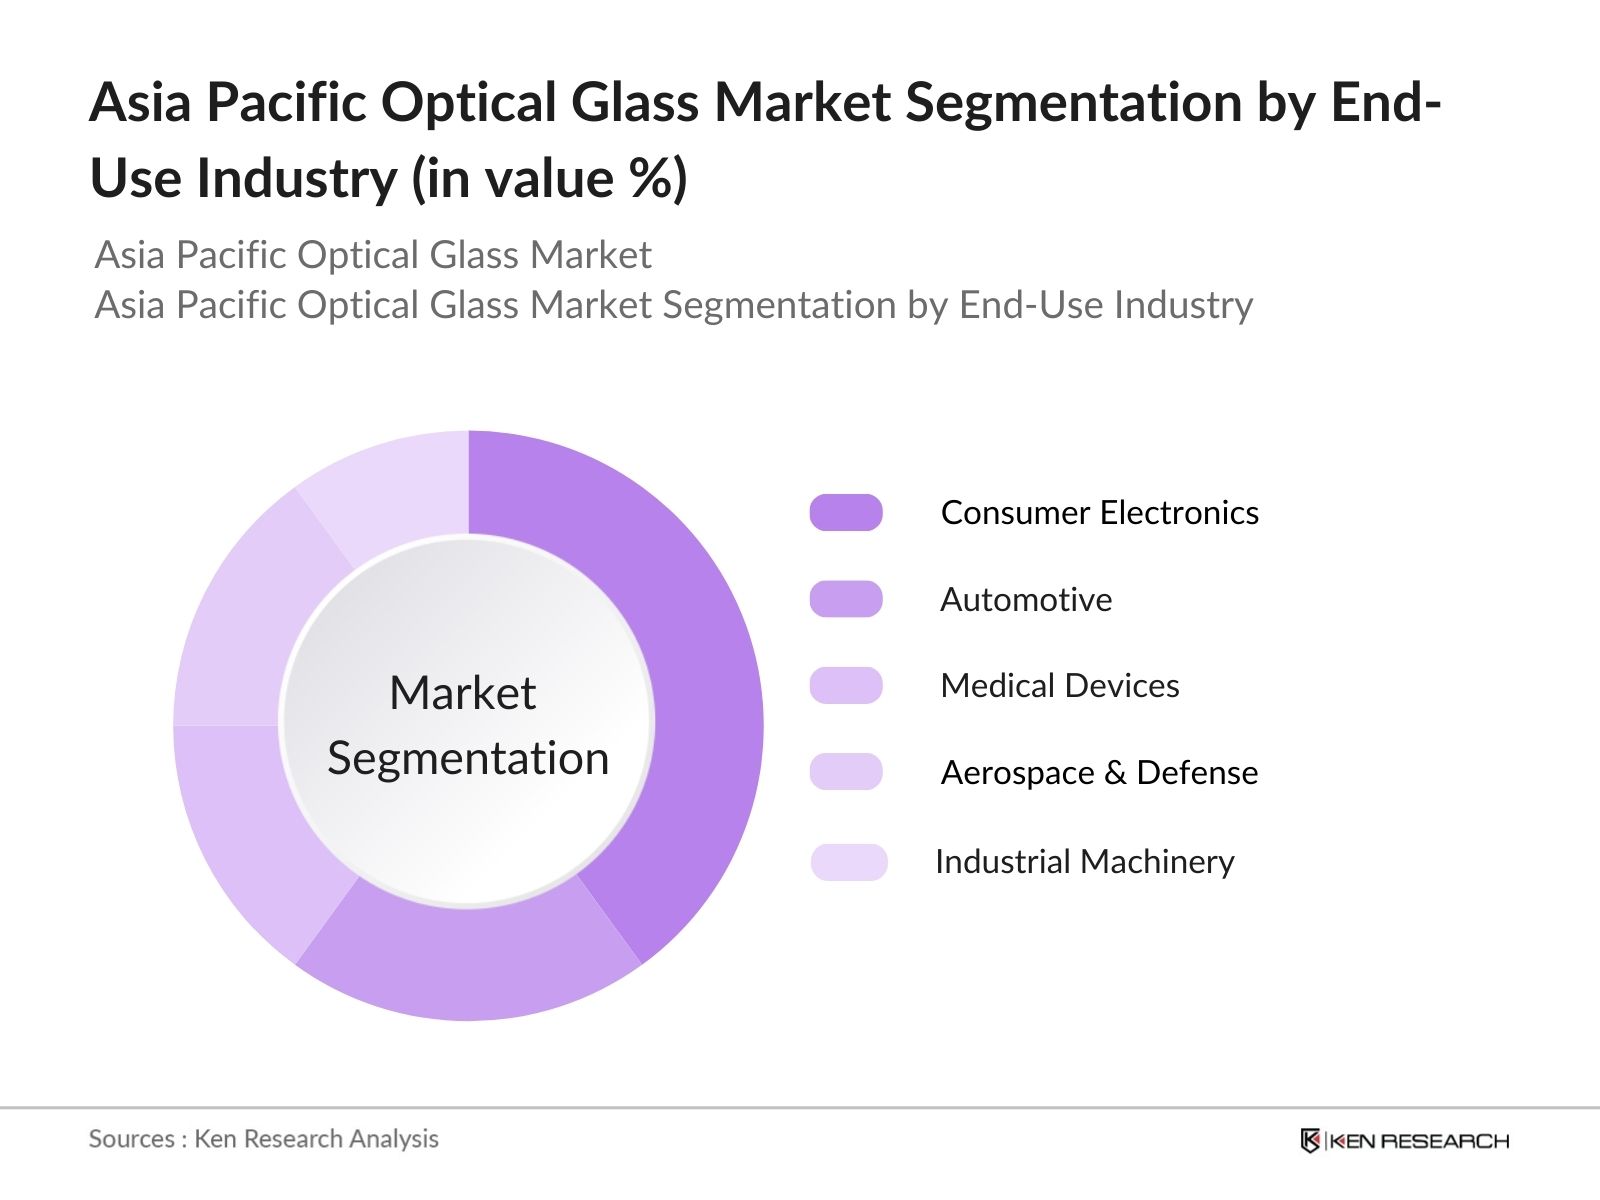
Asia Pacific Optical Glass Market Competitive Landscape
The Asia Pacific optical glass market is dominated by several major players with extensive market experience and innovative capabilities. This competition underscores the importance of R&D, strategic collaborations, and expansive distribution networks. 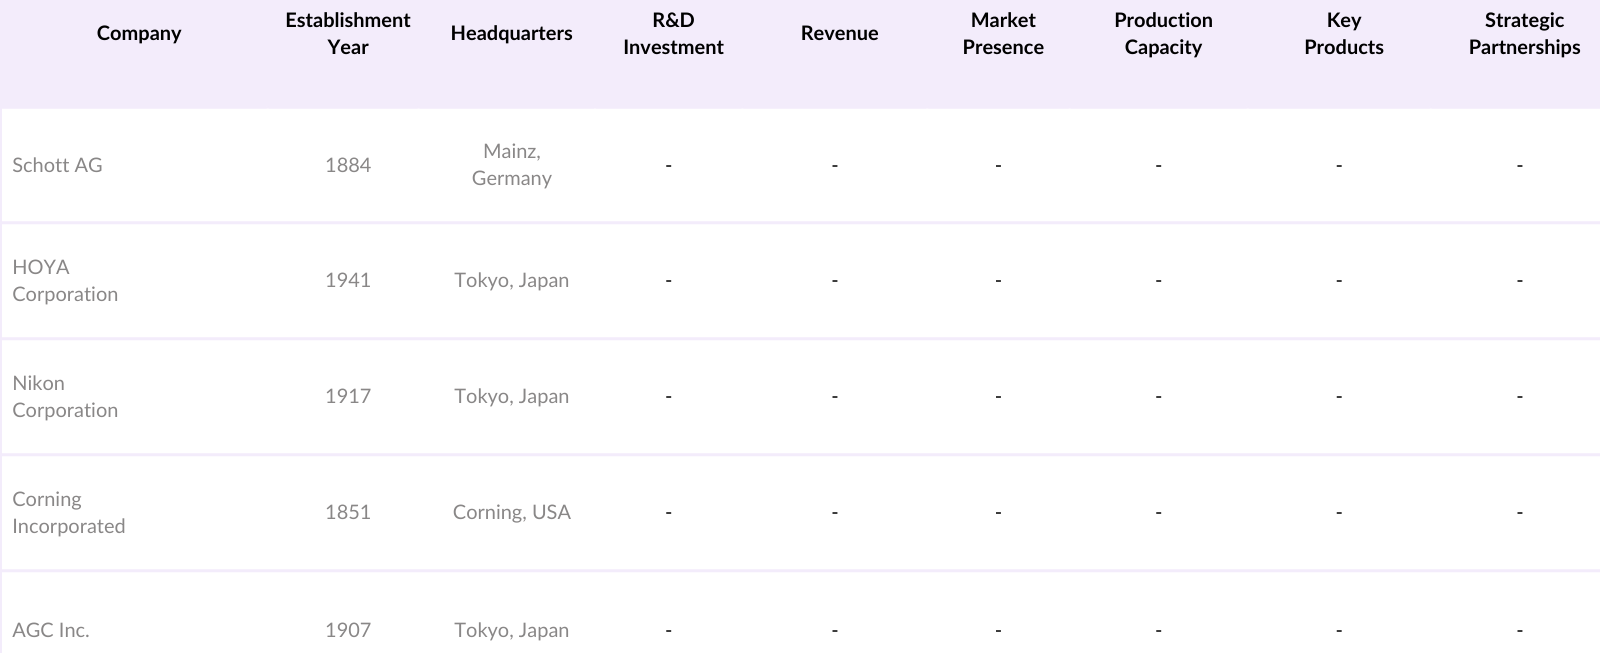
Asia Pacific Optical Glass Industry Analysis
Growth Drivers
- Technological Advancements: The Asia Pacific optical glass market is witnessing significant growth driven by technological advancements in production and application. As of 2023, the World Bank reports an increase in the adoption of innovative manufacturing techniques, including precision molding and advanced coating technologies, enhancing the quality and durability of optical components. Additionally, the push for more sophisticated imaging and sensor solutions across the region has led to the development of specialized glass with improved light transmission and minimal aberration, critical for high-resolution imaging systems.
- Increase in Demand for High-Precision Optics: The demand for high-precision optics in the Asia Pacific region has surged, driven by industries like semiconductor manufacturing and high-end medical imaging. According to IMF data from 2023, there has been a 15% increase in investment into advanced lithography equipment in major markets like Japan and South Korea. This has stimulated the production of ultra-precise optical glass, essential for next-generation chip production and advanced diagnostic devices. The necessity for higher-resolution optics in these applications continues to push the industry forward.
- Expansion of End-Use Industries: Consumer electronics, automotive, and medical device sectors have driven substantial growth in the optical glass market. IMF statistics for 2024 indicate that Asia Pacifics electronic goods production has grown, with China alone manufacturing over 1.5 billion units of smartphones annually. Additionally, the automotive sectors push for enhanced safety and autonomous driving technologies has bolstered the demand for optical sensors and high-quality glass. These expansions significantly contribute to the regions market, enhancing the use of optical glass for applications like LIDAR and advanced camera systems.
Market Challenges
- High Production Costs: One of the main challenges facing the Asia Pacific optical glass market is the high production costs due to raw material expenses and energy consumption. According to 2023 figures from the World Bank, energy prices in industrial sectors increased by 8% compared to 2022, contributing significantly to the cost of producing optical-grade glass. The sophisticated equipment and processes needed to maintain high precision and quality further add to production expenses, impacting profit margins for smaller manufacturers.
- Supply Chain Disruptions: Supply chain disruptions, exacerbated by global events and geopolitical tensions, pose a considerable challenge to the optical glass market in Asia Pacific. The IMFs 2023 report highlights that logistical delays and increased transportation costs have doubled since 2021, affecting the timely delivery of raw materials like silica and specialty coatings. Such disruptions lead to production backlogs and increased lead times, making it difficult for manufacturers to meet demand consistently.
Asia Pacific Optical Glass Market Future Outlook
Over the next five years, the Asia Pacific optical glass market is expected to witness significant growth driven by sustained advancements in manufacturing technologies, increased demand for AR/VR solutions, and expanding applications in automotive and medical fields. The surge in smart device penetration and investments in high-performance optical components will continue to bolster market momentum.
Future Market Opportunities
- Emerging Markets and Untapped Regions: The Asia Pacific optical glass market has significant opportunities in emerging economies such as Vietnam and Indonesia. World Bank data from 2023 shows that these countries experienced a combined GDP growth of over 6%, fostering an increase in industrial manufacturing capacities. The expansion of local industries and growing investments in infrastructure and technology provide a fertile ground for optical glass manufacturers to establish a foothold. This untapped potential presents opportunities to cater to the rising demand for advanced optics in telecommunications and manufacturing sectors.
- Growing Demand for AR/VR and Advanced Imaging Systems: The adoption of augmented reality (AR) and virtual reality (VR) technologies is driving demand for high-quality optical glass. IMF figures from 2023 reveal that investment in digital technology infrastructure in Asia Pacific grew by 10%, driven largely by advancements in AR/VR sectors. Countries like China and South Korea are leading in this growth, pushing the need for optical components that enable high-resolution, immersive experiences. This demand encourages the production of glass with superior light transmittance and minimal distortion, crucial for realistic VR applications.
Scope of the Report
|
Product Type |
High-Transmission Glass Low-Dispersion Glass Radiation-Resistant Glass Specialty Optical Glass |
|
End-Use Industry |
Consumer Electronics Automotive Aerospace & Defense Industrial Machinery |
|
Application |
Lenses Prisms Windows and Mirrors Optical Fibers Displays |
|
Material Composition |
Silicate Glass Borosilicate Glass Fluoride Glass Phosphate Glass |
|
Region |
China Japan South Korea India Southeast Asia |
Products
Key Target Audience
Investors and Venture Capitalist Firms
Government and Regulatory Bodies (e.g., Ministry of Industry and Information Technology, Japan's Ministry of Economy, Trade and Industry)
Optical Glass Manufacturers
Consumer Electronics Companies
Automotive Manufacturers
Medical Device Producers
Aerospace & Defense Contractors
Industrial Machinery Producers
Companies
Major Players
Schott AG
HOYA Corporation
Nikon Corporation
Corning Incorporated
AGC Inc.
Ohara Inc.
Canon Inc.
Nippon Electric Glass Co., Ltd.
Saint-Gobain S.A.
Sumita Optical Glass, Inc.
OptoTech Optical Machinery
Lianyungang Zhongbei Optical Glass Co., Ltd.
Carl Zeiss AG
Kowa Company, Ltd.
Hubei New Huaguang Information Materials Co., Ltd.
Table of Contents
1. Asia Pacific Optical Glass Market Overview
1.1. Definition and Scope
1.2. Market Taxonomy
1.3. Market Growth Rate
1.4. Market Segmentation Overview
2. Asia Pacific Optical Glass Market Size (In USD Bn)
2.1. Historical Market Size
2.2. Year-On-Year Growth Analysis
2.3. Key Market Developments and Milestones
3. Asia Pacific Optical Glass Market Analysis
3.1. Growth Drivers
3.1.1. Technological Advancements
3.1.2. Increase in Demand for High-Precision Optics
3.1.3. Expansion of End-Use Industries (e.g., consumer electronics, automotive, medical devices)
3.1.4. Rise in Investments for Enhanced Optical Solutions
3.2. Market Challenges
3.2.1. High Production Costs
3.2.2. Supply Chain Disruptions
3.2.3. Availability of Substitute Materials
3.3. Opportunities
3.3.1. Emerging Markets and Untapped Regions
3.3.2. Growing Demand for AR/VR and Advanced Imaging Systems
3.3.3. Adoption in Aerospace and Defense Applications
3.4. Trends
3.4.1. Adoption of Eco-Friendly Production Processes
3.4.2. Development of Ultra-Thin Optical Glass
3.4.3. Integration with Smart Technologies
3.5. Government Regulations
3.5.1. Import and Export Policies
3.5.2. Environmental Compliance Standards
3.5.3. Safety and Quality Certifications
3.6. SWOT Analysis
3.7. Stake Ecosystem (Suppliers, Manufacturers, Distributors, End-Users)
3.8. Porters Five Forces Analysis
3.9. Competition Ecosystem
4. Asia Pacific Optical Glass Market Segmentation
4.1. By Product Type (In Value %)
4.1.1. High-Transmission Glass
4.1.2. Low-Dispersion Glass
4.1.3. Radiation-Resistant Glass
4.1.4. Specialty Optical Glass
4.2. By End-Use Industry (In Value %)
4.2.1. Consumer Electronics
4.2.2. Automotive
4.2.3. Medical Devices
4.2.4. Aerospace & Defense
4.2.5. Industrial Machinery
4.3. By Application (In Value %)
4.3.1. Lenses
4.3.2. Prisms
4.3.3. Windows and Mirrors
4.3.4. Optical Fibers
4.3.5. Displays
4.4. By Material Composition (In Value %)
4.4.1. Silicate Glass
4.4.2. Borosilicate Glass
4.4.3. Fluoride Glass
4.4.4. Phosphate Glass
4.5. By Region (In Value %)
4.5.1. China
4.5.2. Japan
4.5.3. South Korea
4.5.4. India
4.5.5. Southeast Asia
5. Asia Pacific Optical Glass Market Competitive Analysis
5.1. Detailed Profiles of Major Companies
5.1.1. Schott AG
5.1.2. HOYA Corporation
5.1.3. Nikon Corporation
5.1.4. Corning Incorporated
5.1.5. AGC Inc.
5.1.6. Ohara Inc.
5.1.7. Canon Inc.
5.1.8. Nippon Electric Glass Co., Ltd.
5.1.9. Saint-Gobain S.A.
5.1.10. Sumita Optical Glass, Inc.
5.1.11. OptoTech Optical Machinery
5.1.12. Lianyungang Zhongbei Optical Glass Co., Ltd.
5.1.13. Carl Zeiss AG
5.1.14. Kowa Company, Ltd.
5.1.15. Hubei New Huaguang Information Materials Co., Ltd.
5.2. Cross Comparison Parameters (Revenue, R&D Investment, Market Presence, Product Portfolio, Market Strategies, Production Capacity, Distribution Networks, Customer Base)
5.3. Market Share Analysis
5.4. Strategic Initiatives
5.5. Mergers and Acquisitions
5.6. Investment Analysis
5.7. Venture Capital Funding
5.8. Government Grants
5.9. Private Equity Investments
6. Asia Pacific Optical Glass Market Regulatory Framework
6.1. Quality Standards and Certifications
6.2. Compliance and Safety Regulations
6.3. Trade and Tariff Regulations
7. Asia Pacific Optical Glass Future Market Size (In USD Bn)
7.1. Future Market Size Projections
7.2. Key Factors Driving Future Market Growth
8. Asia Pacific Optical Glass Future Market Segmentation
8.1. By Product Type (In Value %)
8.2. By End-Use Industry (In Value %)
8.3. By Application (In Value %)
8.4. By Material Composition (In Value %)
8.5. By Region (In Value %)
9. Asia Pacific Optical Glass Market Analysts Recommendations
9.1. TAM/SAM/SOM Analysis
9.2. Customer Cohort Analysis
9.3. Marketing Initiatives
9.4. White Space Opportunity Analysis
Disclaimer
Contact Us
Research Methodology
Step 1: Identification of Key Variables
The initial phase involves constructing a comprehensive ecosystem map of the Asia Pacific optical glass market. This step is supported by extensive desk research leveraging both secondary and proprietary databases to gather relevant industry-level data. The goal is to identify critical variables impacting market dynamics.
Step 2: Market Analysis and Construction
Historical data analysis is conducted to evaluate market penetration, the distribution ratio between major suppliers and consumers, and overall revenue generation. This phase also includes examining production statistics to verify the accuracy of revenue estimates.
Step 3: Hypothesis Validation and Expert Consultation
Market hypotheses are developed and validated through structured interviews with industry experts from various key companies. This process provides deep operational and financial insights that help refine and verify the market data collected.
Step 4: Research Synthesis and Final Output
The final phase integrates insights from direct engagements with optical glass manufacturers to obtain details on product performance, customer preferences, and sales trends. These insights are cross-checked with bottom-up data analysis to ensure a comprehensive, validated market report.
Frequently Asked Questions
01 How big is the Asia Pacific Optical Glass Market?
The Asia Pacific optical glass market is valued at USD 16.9 billion, driven by high demand from consumer electronics and automotive sectors.
02 What are the challenges in the Asia Pacific Optical Glass Market?
Key challenges in the Asia Pacific optical glass market include high production costs, supply chain disruptions, and competition from substitute materials that impact market growth and profitability.
03 Who are the major players in the Asia Pacific Optical Glass Market?
Major players in the Asia Pacific optical glass market include Schott AG, HOYA Corporation, Nikon Corporation, Corning Incorporated, and AGC Inc., known for their strong market presence and innovation.
04 What are the growth drivers of the Asia Pacific Optical Glass Market?
Growth in the Asia Pacific optical glass market is propelled by technological advancements, increasing use of optical components in consumer electronics, and the adoption of high-precision glass in medical and automotive industries.
05 Which country leads the Asia Pacific Optical Glass Market?
China and Japan lead the Asia Pacific optical glass market, attributed to their robust industrial bases, advanced manufacturing capabilities, and extensive supply chains.
Why Buy From Us?
 Framework")
What makes us stand out is that our consultants follows Robust, Refine and Result (RRR) methodology. i.e. Robust for clear definitions, approaches and sanity checking, Refine for differentiating respondents facts and opinions and Result for presenting data with story

We have set a benchmark in the industry by offering our clients with syndicated and customized market research reports featuring coverage of entire market as well as meticulous research and analyst insights.

While we don't replace traditional research, we flip the method upside down. Our dual approach of Top Bottom & Bottom Top ensures quality deliverable by not just verifying company fundamentals but also looking at the sector and macroeconomic factors.

With one step in the future, our research team constantly tries to show you the bigger picture. We help with some of the tough questions you may encounter along the way: How is the industry positioned? Best marketing channel? KPI's of competitors? By aligning every element, we help maximize success.

Our report gives you instant access to the answers and sources that other companies might choose to hide. We elaborate each steps of research methodology we have used and showcase you the sample size to earn your trust.

If you need any support, we are here! We pride ourselves on universe strength, data quality, and quick, friendly, and professional service.