
Asia Pacific PLA (Polylactic Acid) Market Outlook to 2030
Region:Asia
Author(s):Sanjna Verma
Product Code:KROD8391
December 2024
83
About the Report
Asia Pacific PLA (Polylactic Acid) Market Overview
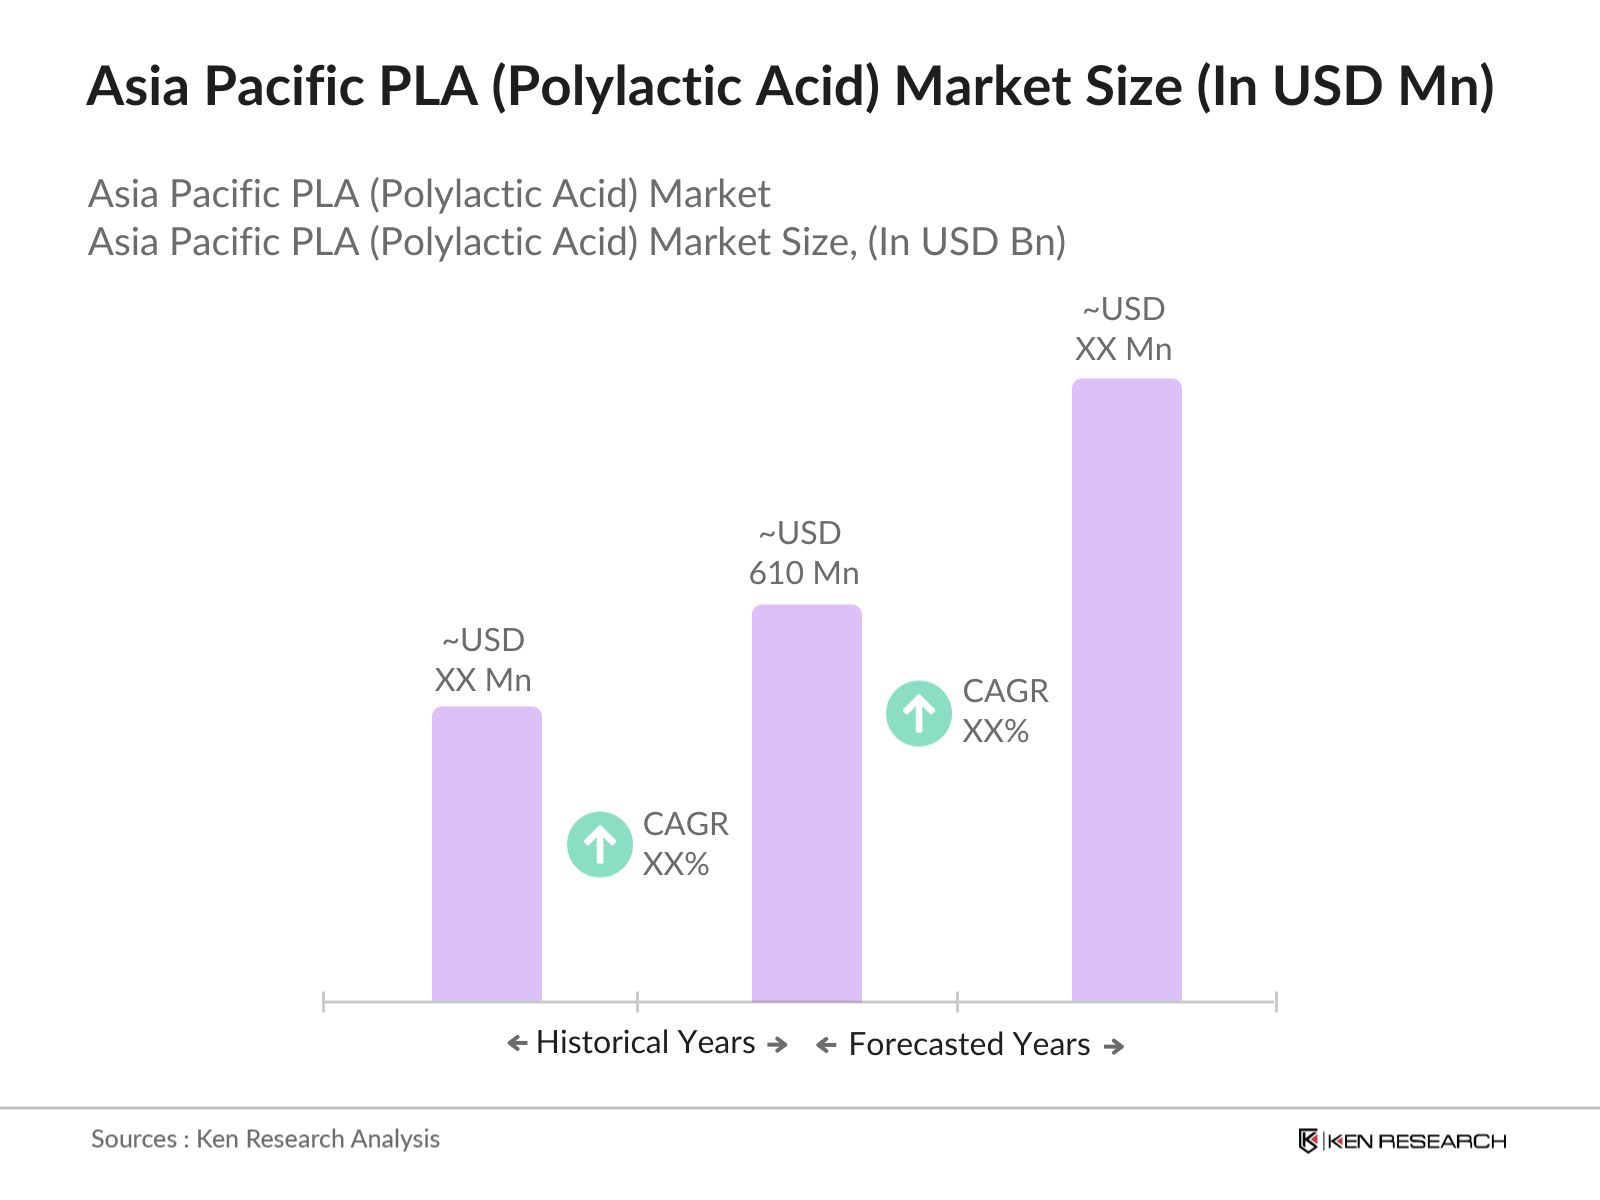
- The Asia Pacific PLA market is valued at USD 610 million, driven by growing demand for biodegradable and sustainable packaging materials. The shift towards eco-friendly alternatives across various industries like food packaging, textiles, and agriculture has increased the adoption of PLA. Government regulations and initiatives promoting the reduction of single-use plastics further fuel the demand for PLA. Major corporations are also investing in PLA production to meet sustainability goals, contributing to market expansion.
- Countries like China, Japan, and South Korea dominate the Asia Pacific PLA market due to their advanced industrial base and focus on sustainability. China's large manufacturing sector, along with government policies supporting green technology, provides a conducive environment for PLA growth. Japan and South Korea's strong R&D initiatives and investment in eco-friendly materials make them key players in the region. These countries benefit from large-scale production capacities, well-established supply chains, and a growing consumer awareness about sustainability.
- Several Asia Pacific governments are implementing green procurement policies that mandate the use of eco-friendly materials, including PLA. In Japan, for instance, government institutions are required to purchase biodegradable materials for specific products. This policy shift is expected to reduce plastic waste by over 10 million tons by 2025, according to the World Bank. Such initiatives are providing a significant boost to the PLA market, as businesses increasingly align with these requirements.
Asia Pacific PLA (Polylactic Acid) Market Segmentation
By Raw Material: The Asia Pacific PLA market is segmented by raw material into corn, sugarcane, and cassava. Corn is the dominant raw material due to its wide availability and cost-effectiveness in PLA production. With established corn supply chains, PLA producers can efficiently source the raw material for manufacturing. The scalability of corn-based PLA also supports its dominance, especially in large-scale packaging applications.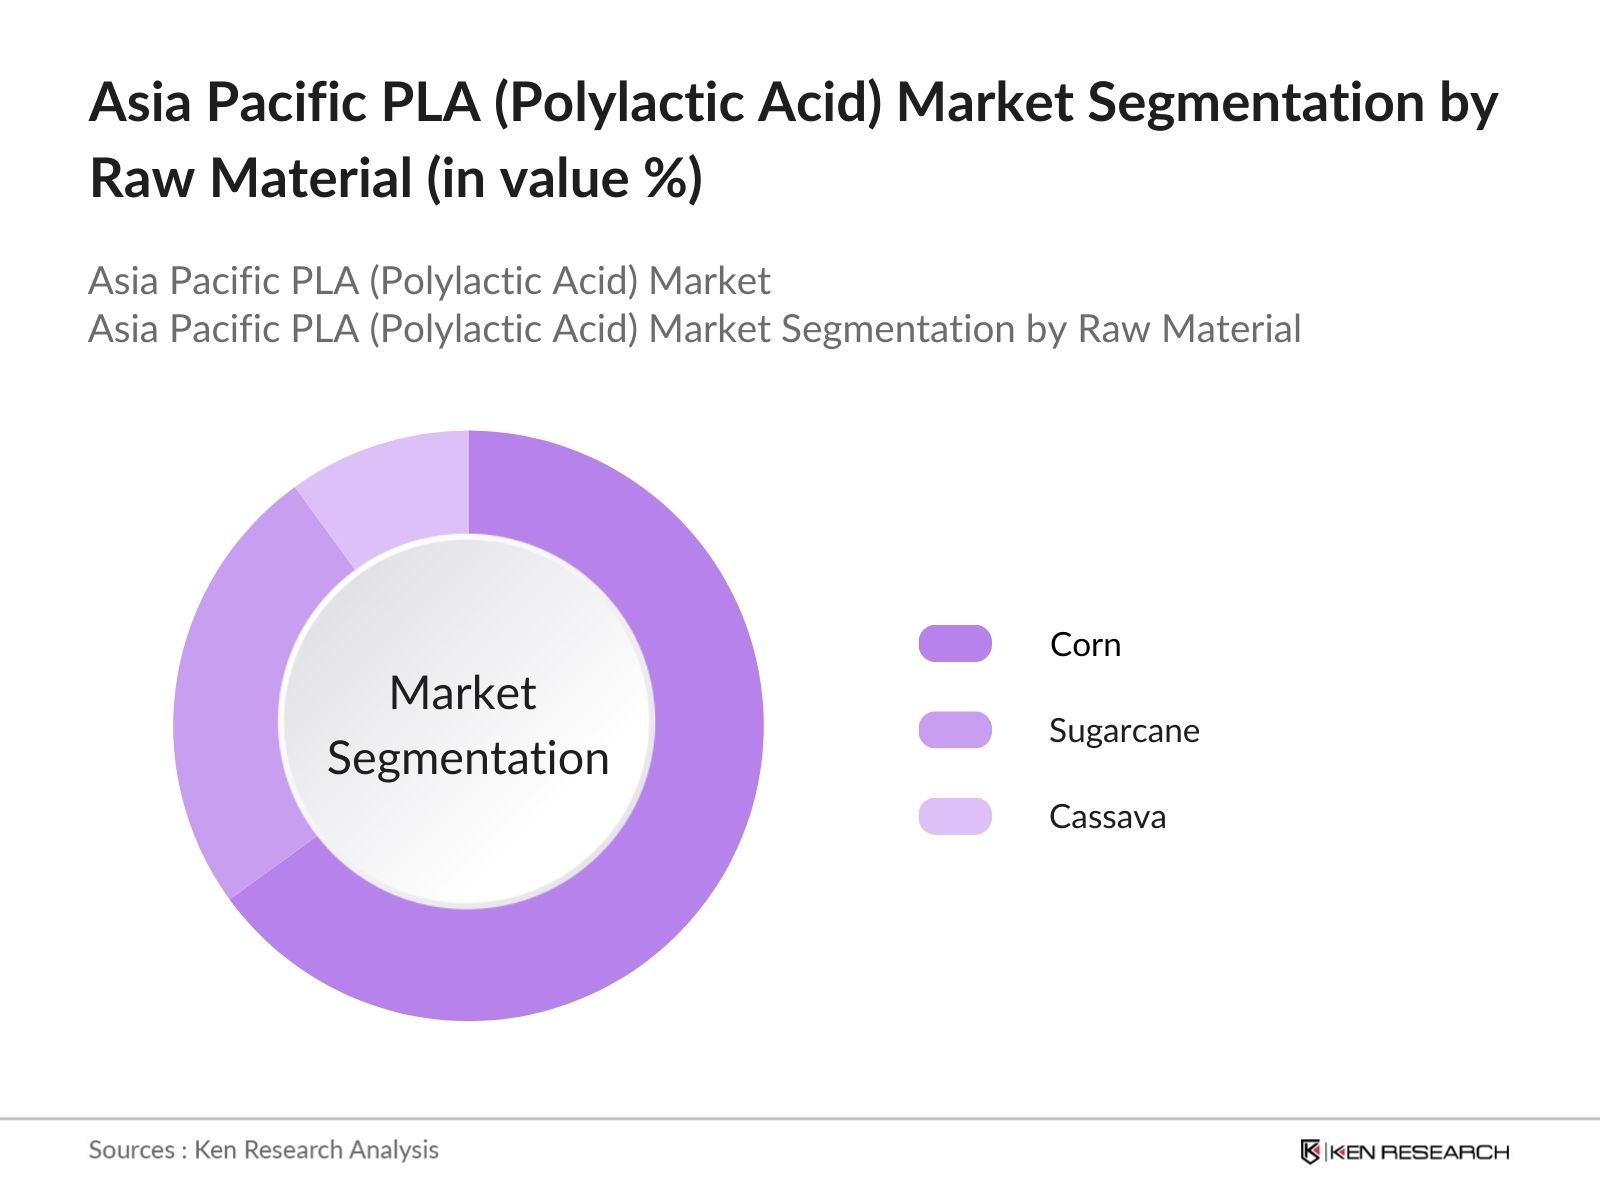
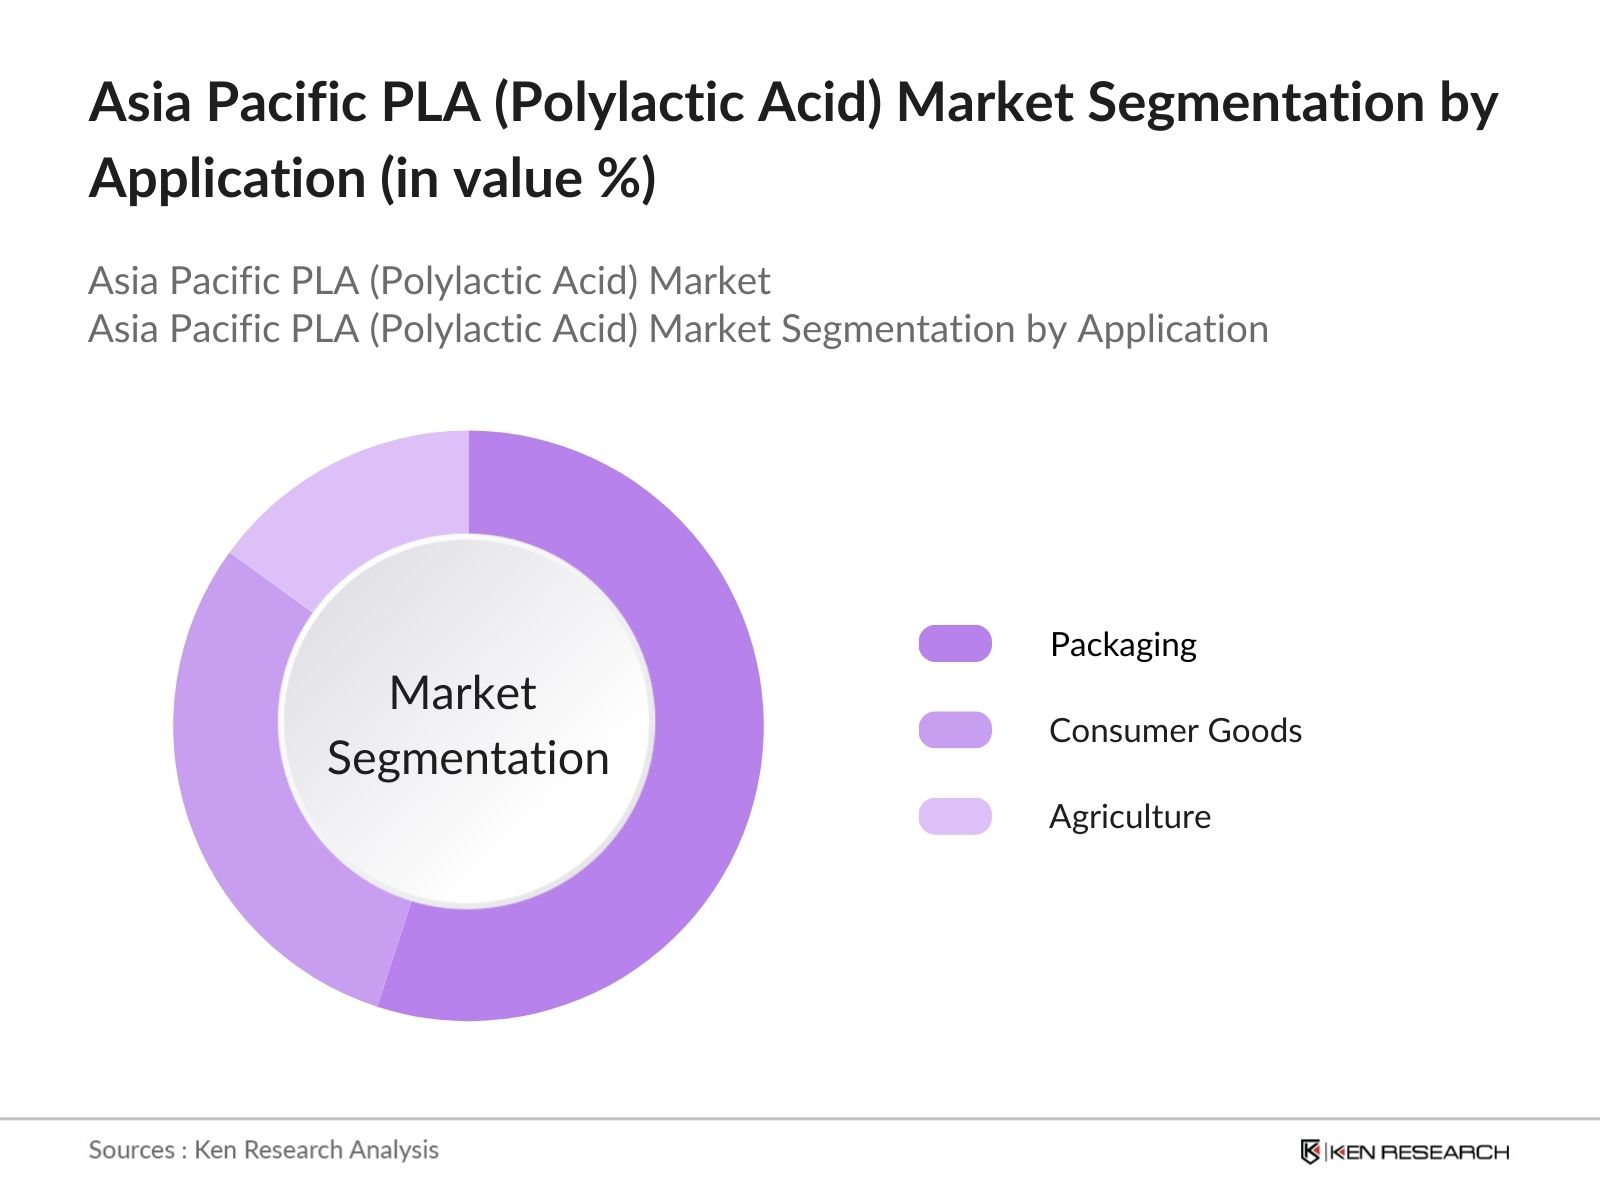
By Application: The Asia Pacific PLA market is segmented by application into packaging, consumer goods, and agriculture. Packaging holds the largest share due to rising demand for biodegradable packaging solutions in industries such as food and beverages. The ban on single-use plastics has accelerated the use of PLA in sustainable packaging, especially in countries like China and Japan where government regulations are strict.
Asia Pacific PLA (Polylactic Acid) Market Competitive Landscape
The Asia Pacific PLA market is dominated by a few major players with strong production capacities, advanced R&D, and a commitment to sustainability. The competitive landscape is shaped by a few major players, such as NatureWorks LLC and Total Corbion PLA, who dominate the Asia Pacific PLA market. These companies are investing heavily in innovation and have strong production capabilities to meet the growing demand for sustainable materials. Regional players, like Hisun BioChemicals, leverage their proximity to raw material sources and lower production costs, adding competitive pressure.
|
Company |
Establishment Year |
Headquarters |
Production Capacity |
R&D Investment |
Sustainability Initiatives |
Partnerships |
Product Portfolio |
Geographical Reach |
|
NatureWorks LLC |
1997 |
Minnesota, USA |
- |
- |
- |
- |
- |
- |
|
Total Corbion PLA |
2017 |
Gorinchem, Netherlands |
- |
- |
- |
- |
- |
- |
|
Hisun BioChemicals |
2000 |
Zhejiang, China |
- |
- |
- |
- |
- |
- |
|
Futerro |
1992 |
Wallonia, Belgium |
- |
- |
- |
- |
- |
- |
|
Zhejiang Hisun Biomaterials |
2005 |
Zhejiang, China |
- |
- |
- |
- |
- |
- |
Asia Pacific PLA (Polylactic Acid) Market Analysis
Growth Drivers
- Circular Economy Initiatives: The Asia Pacific region has been at the forefront of implementing circular economy policies to reduce plastic waste. Countries like Japan and South Korea are pushing for 50% of all plastics to be recyclable or reusable. China has implemented its Circular Economy Promotion Law to decrease plastic waste. These government-led efforts are bolstering the growth of Polylactic Acid (PLA) as it fits well within these circular economy frameworks.
- Corporate Sustainability Goals: Corporates in the Asia Pacific region are increasingly adopting sustainability goals, driving the demand for biodegradable materials like PLA. Companies such as Toyota and Unilever have pledged to achieve carbon neutrality by 2035 and are already increasing the use of biodegradable plastics. The World Bank estimates that sustainability-driven industries in Asia could collectively reduce over 40 million tons of plastic waste per year by 2025. This demand for eco-friendly materials is encouraging manufacturers to opt for PLA-based products.
- Plastics Bans and Regulations: Many Asia Pacific countries have introduced strict regulations to phase out single-use plastics. For instance, India's Plastic Waste Management Rules aim to eliminate certain plastic products entirely. South Korea and Taiwan have implemented bans on plastic straws and bags, impacting over 100 million consumers annually. The International Monetary Fund (IMF) has noted that countries with plastic bans will reduce plastic waste generation by over 30 million tons per year by 2025, which is directly boosting the demand for biodegradable alternatives like PLA.
Market Challenges
- High Production Costs: PLA production costs remain high compared to conventional plastics, which hampers its broader adoption. PLA production can cost up to $2,500 per ton, while conventional plastics like polyethylene cost as little as $1,500 per ton. The IMF highlights that this cost disparity is a significant barrier to scaling PLA production in Asia. Many manufacturers are reluctant to transition due to the cost disadvantage, despite governmental subsidies and tax benefits in countries like Japan and South Korea aimed at leveling this cost imbalance.
- Limited Feedstock Availability: PLA is derived from renewable biomass sources such as corn starch and sugarcane, but the availability of these feedstocks in Asia Pacific is limited. The World Bank reports that agricultural land allocated for non-food biomass production in the region is constrained, contributing to supply chain bottlenecks. According to a 2024 report from the IMF, the PLA industry in the Asia Pacific region faces a shortfall of around 3 million tons of biomass feedstock annually, slowing down production.
Asia Pacific PLA (Polylactic Acid) Market Future Outlook
Over the next five years, the Asia Pacific PLA market is expected to experience significant growth, driven by sustainability initiatives, technological advancements in bioplastics, and increasing demand from various industries. Companies are focusing on expanding their production capacities and developing cost-effective processes to meet growing consumer demand for eco-friendly alternatives. Government policies, particularly in China and Japan, will continue to support the growth of PLA in packaging and other applications.
Market Opportunities
- Expansion in Packaging and Automotive: PLA is gaining traction in sectors like packaging and automotive. In 2024, the automotive industry in Japan and South Korea alone is expected to consume around 200,000 tons of bio-based materials, including PLA, due to increasing regulatory pressures. The food packaging industry in India and China is expected to adopt PLA products, replacing 500,000 tons of plastic annually. These sectors represent substantial growth opportunities as sustainability becomes a top priority for industry players.
- Opportunities in Textile and Electronics: New applications of PLA in textiles and electronics are emerging across the Asia Pacific region. In the textile industry, the IMF projects that over 100,000 tons of PLA-based fibers will be produced annually by 2025, as consumers demand eco-friendly clothing options. Additionally, electronics manufacturers in China and Japan are exploring the use of PLA in biodegradable casings for devices, driven by government regulations requiring eco-friendly components. These growing applications highlight the untapped potential in these markets.
Scope of the Report
|
By Raw Material |
Corn Sugarcane Cassava |
|
By Application |
Packaging Consumer Goods Agriculture |
|
By End-User Industry |
Food & Beverages Healthcare Textiles |
|
By Form |
Fiber Film & Sheets Coating |
|
By Region |
China Japan South Korea India Southeast Asia |
Products
Key Target Audience
PLA Manufacturers
Packaging Companies
Consumer Goods Manufacturers
Agriculture Industry Players
Bioplastics Manufacturers
Consumer Goods Manufacturers
Investors and Venture Capitalist Firms
Government and Regulatory Bodies (Ministry of Environment, China, Japan Environment Agency)
Companies
Major Players
NatureWorks LLC
Total Corbion PLA
Hisun BioChemicals
Futerro
Zhejiang Hisun Biomaterials
Mitsubishi Chemical Corporation
Synbra Technology
Sulzer Chemtech
Teijin Limited
BASF SE
Table of Contents
1. Asia Pacific PLA Market Overview
1.1. Definition and Scope
1.2. Market Taxonomy
1.3. Market Growth Rate
1.4. Market Segmentation Overview
2. Asia Pacific PLA Market Size (In USD Mn)
2.1. Historical Market Size
2.2. Year-On-Year Growth Analysis
2.3. Key Market Developments and Milestones
3. Asia Pacific PLA Market Analysis
3.1. Growth Drivers (Government Policies, Biodegradability Demand, Sustainability)
3.1.1. Circular Economy Initiatives
3.1.2. Corporate Sustainability Goals
3.1.3. Plastics Bans and Regulations
3.1.4. Increasing Awareness of Environmental Impact
3.2. Market Challenges (Cost Competitiveness, Feedstock Supply)
3.2.1. High Production Costs
3.2.2. Limited Feedstock Availability
3.2.3. Competition with Conventional Plastics
3.3. Opportunities (Innovation, End-User Expansion)
3.3.1. R&D in Bio-based Plastics
3.3.2. Expansion in Packaging and Automotive
3.3.3. Opportunities in Textile and Electronics
3.4. Trends (Eco-friendly Packaging, Recycling Innovations)
3.4.1. Emergence of Closed-Loop Systems
3.4.2. Bio-compostable Packaging Solutions
3.4.3. Blended Polymers in Consumer Goods
3.5. Government Regulation (Biodegradability Standards, Bans on Single-use Plastics)
3.5.1. Green Procurement Policies
3.5.2. PLA Certification Requirements
3.5.3. Regional Bans on Plastic Waste
4. Asia Pacific PLA Market Segmentation
4.1. By Raw Material (In Value %)
4.1.1. Corn
4.1.2. Sugarcane
4.1.3. Cassava
4.2. By Application (In Value %)
4.2.1. Packaging
4.2.2. Consumer Goods
4.2.3. Agriculture
4.3. By End-User Industry (In Value %)
4.3.1. Food & Beverages
4.3.2. Healthcare
4.3.3. Textiles
4.4. By Form (In Value %)
4.4.1. Fiber
4.4.2. Film & Sheets
4.4.3. Coating
4.5. By Region (In Value %)
4.5.1. China
4.5.2. Japan
4.5.3. South Korea
4.5.4. India
4.5.5. Southeast Asia
5. Asia Pacific PLA Market Competitive Analysis
5.1. Detailed Profiles of Major Companies
5.1.1. NatureWorks LLC
5.1.2. Total Corbion PLA
5.1.3. Futerro
5.1.4. Hisun BioChemicals
5.1.5. Mitsubishi Chemical Corporation
5.1.6. Zhejiang Hisun Biomaterials
5.1.7. Synbra Technology
5.1.8. Sulzer Chemtech
5.1.9. Teijin Limited
5.1.10. BASF SE
5.2. Cross Comparison Parameters (Product Portfolio, Sustainability Initiatives, Geographical Reach, Production Capacity, Innovation Capabilities, Raw Material Sourcing, Strategic Partnerships, R&D Investment)
5.3. Market Share Analysis
5.4. Strategic Initiatives
5.5. Mergers and Acquisitions
5.6. Investment Analysis
5.7. Joint Ventures and Collaborations
5.8. Government Grants and Subsidies
6. Asia Pacific PLA Market Regulatory Framework
6.1. Environmental Standards for PLA Production
6.2. Compliance with Bioplastics Regulations
6.3. Certification Processes for Biodegradability
7. Asia Pacific PLA Future Market Size (In USD Bn)
7.1. Future Market Size Projections
7.2. Key Factors Driving Future Market Growth
8. Asia Pacific PLA Future Market Segmentation
8.1. By Raw Material (In Value %)
8.2. By Application (In Value %)
8.3. By End-User Industry (In Value %)
8.4. By Form (In Value %)
8.5. By Region (In Value %)
9. Asia Pacific PLA Market Analysts Recommendations
9.1. Total Addressable Market (TAM), Serviceable Addressable Market (SAM), and Share of Market (SOM)
9.2. Key Consumer Insights and Preferences
9.3. Strategic Marketing Initiatives
9.4. White Space Opportunities
Research Methodology
Step 1: Identification of Key Variables
The research began with identifying the key stakeholders in the Asia Pacific PLA market, focusing on manufacturers, suppliers, and end-users. We conducted extensive desk research, gathering information from secondary sources and proprietary databases to map the market ecosystem.
Step 2: Market Analysis and Construction
In this phase, historical data from 2018 to 2023 was analyzed to assess market penetration, application segmentation, and revenue generation. An in-depth analysis of production capacities and supply chain dynamics was also performed.
Step 3: Hypothesis Validation and Expert Consultation
Hypotheses regarding market growth and demand drivers were validated through expert interviews with industry professionals from leading PLA manufacturers. Insights on market challenges, technological advancements, and future trends were collected.
Step 4: Research Synthesis and Final Output
Finally, data was synthesized through direct engagement with manufacturers, ensuring accuracy and comprehensiveness. The report presents a complete analysis of the Asia Pacific PLA market, verified through a bottom-up approach.
Frequently Asked Questions
01. How big is the Asia Pacific PLA Market?
The Asia Pacific PLA market is valued at USD 610 million, driven by the rising demand for sustainable and biodegradable materials, particularly in packaging and consumer goods sectors.
02. What are the challenges in the Asia Pacific PLA Market?
Challenges of Asia Pacific PLA Market include high production costs and limited availability of raw materials like corn and sugarcane. Additionally, competition from conventional plastics presents a significant barrier to market growth.
03. Who are the major players in the Asia Pacific PLA Market?
Key players in Asia Pacific PLA Market include NatureWorks LLC, Total Corbion PLA, Hisun BioChemicals, Futerro, and Zhejiang Hisun Biomaterials. These companies dominate due to their production capabilities, technological advancements, and strategic partnerships.
04. What are the growth drivers of the Asia Pacific PLA Market?
Asia Pacific PLA Market is driven by increasing consumer demand for sustainable packaging solutions, government regulations banning single-use plastics, and corporate sustainability initiatives aimed at reducing environmental impact.
Why Buy From Us?
 Framework")
What makes us stand out is that our consultants follows Robust, Refine and Result (RRR) methodology. i.e. Robust for clear definitions, approaches and sanity checking, Refine for differentiating respondents facts and opinions and Result for presenting data with story

We have set a benchmark in the industry by offering our clients with syndicated and customized market research reports featuring coverage of entire market as well as meticulous research and analyst insights.

While we don't replace traditional research, we flip the method upside down. Our dual approach of Top Bottom & Bottom Top ensures quality deliverable by not just verifying company fundamentals but also looking at the sector and macroeconomic factors.

With one step in the future, our research team constantly tries to show you the bigger picture. We help with some of the tough questions you may encounter along the way: How is the industry positioned? Best marketing channel? KPI's of competitors? By aligning every element, we help maximize success.

Our report gives you instant access to the answers and sources that other companies might choose to hide. We elaborate each steps of research methodology we have used and showcase you the sample size to earn your trust.

If you need any support, we are here! We pride ourselves on universe strength, data quality, and quick, friendly, and professional service.