
Asia Pacific Power Supply Market Outlook to 2030
Region:Asia
Author(s):Abhinav kumar
Product Code:KROD6108
November 2024
85
About the Report
Asia Pacific Power Supply Market Overview
- The Asia Pacific Power Supply Market is valued at USD 5.2 billion, reflecting robust growth driven by escalating energy consumption and technological advancements in power generation and distribution. This growth is primarily fueled by the increasing demand for electricity in residential, commercial, and industrial sectors, alongside significant investments in renewable energy projects. As energy demands surge, countries are pivoting towards cleaner energy solutions, leading to a dynamic shift in the power supply landscape.

- Dominating the market are countries like China, India, and Japan, characterized by their substantial industrial bases and urbanization rates. China leads due to its massive manufacturing sector and commitment to renewable energy targets, while India is experiencing rapid urban growth and infrastructure development, further bolstering its energy requirements. Japan remains a key player with its focus on technological innovation and energy efficiency post-Fukushima disaster, positioning itself as a leader in clean energy technologies.
- Stringent emission standards are reshaping the Asia Pacific power supply market. Chinas 2024 emission standards mandate that coal-fired plants reduce sulfur dioxide and nitrogen oxide emissions by 80% from 2010 levels. India has also implemented strict emission norms for power plants, requiring reductions in particulate matter and greenhouse gas emissions, enforced by the Central Pollution Control Board. These regulations, while driving up compliance costs, are accelerating the shift toward cleaner energy alternatives.
Asia Pacific Power Supply Market Segmentation
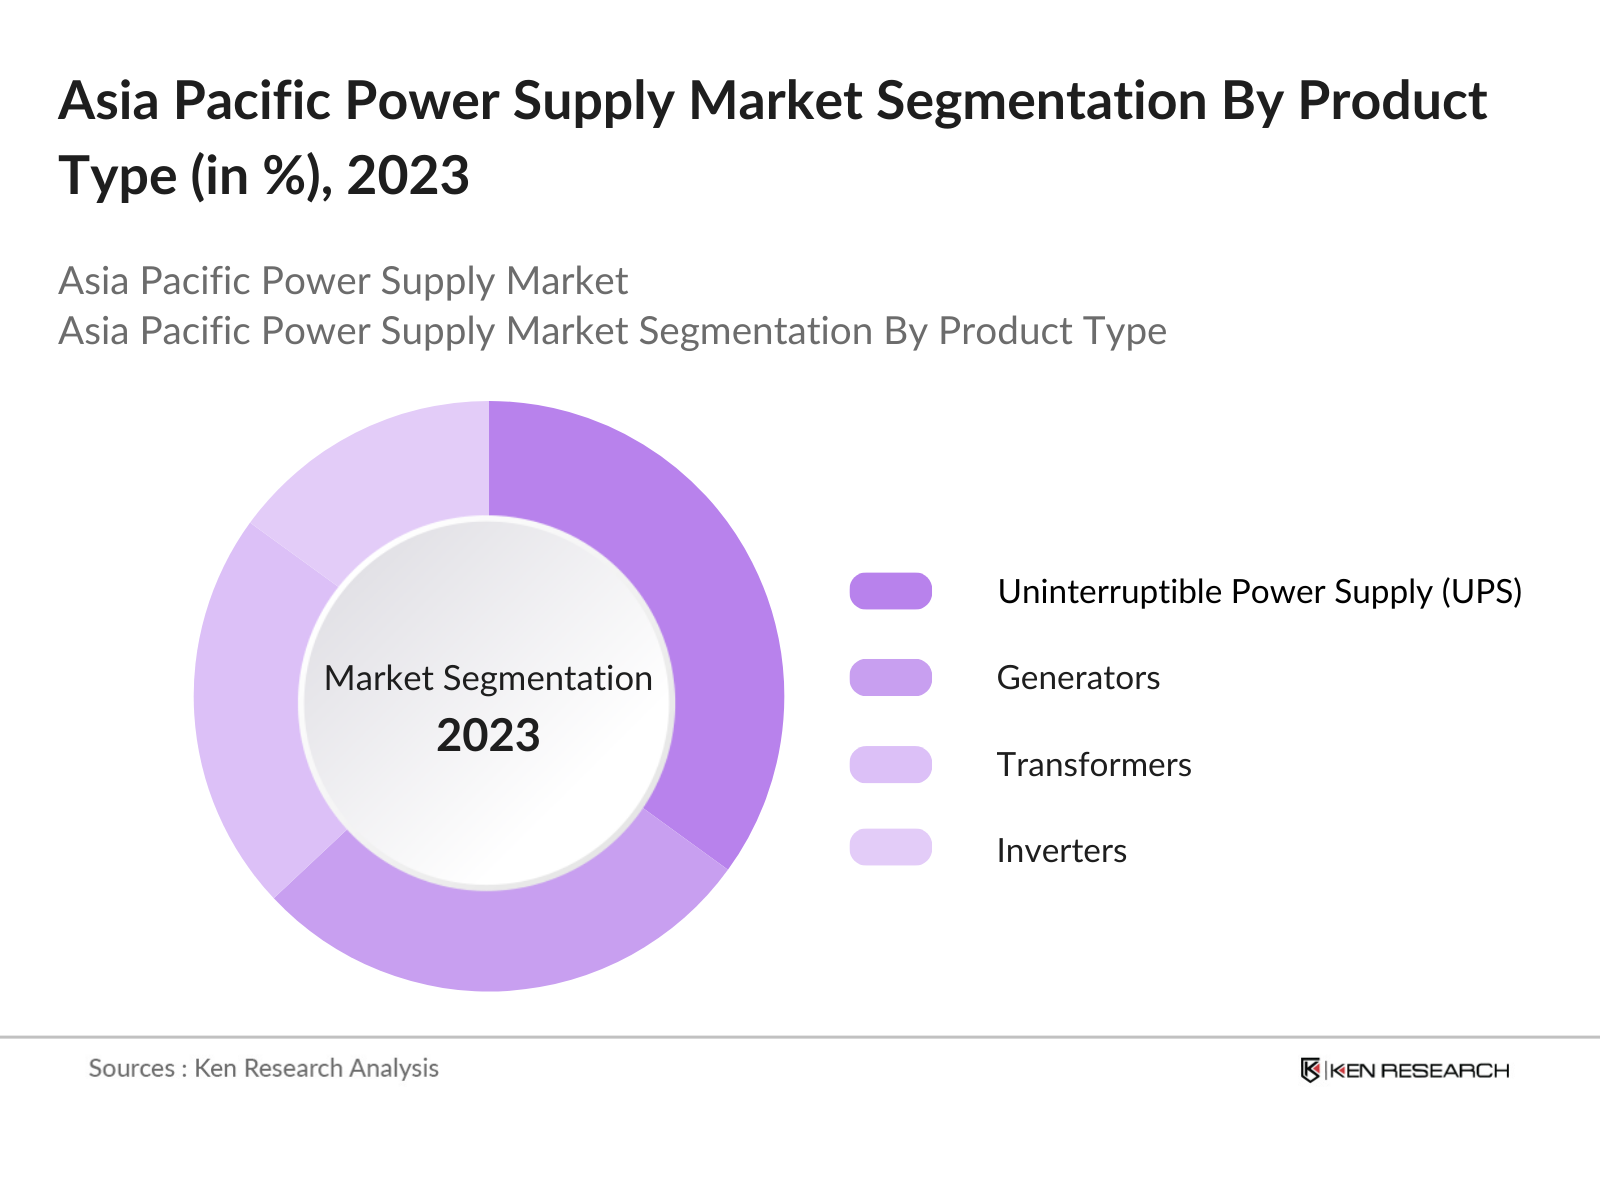
By Product Type: The Asia Pacific Power Supply Market is segmented by product type into generators, transformers, uninterruptible power supply (UPS) systems, and inverters. Among these, the UPS systems segment is witnessing significant dominance due to the increasing need for uninterrupted power supply across various industries and households. The rise in digital infrastructure and dependency on technology necessitates reliable power solutions, making UPS systems a critical investment for businesses aiming to maintain operational continuity. With the ongoing digitization trends, UPS systems are expected to capture a larger market share, driven by consumer preference for high-quality, uninterrupted power supply solutions.
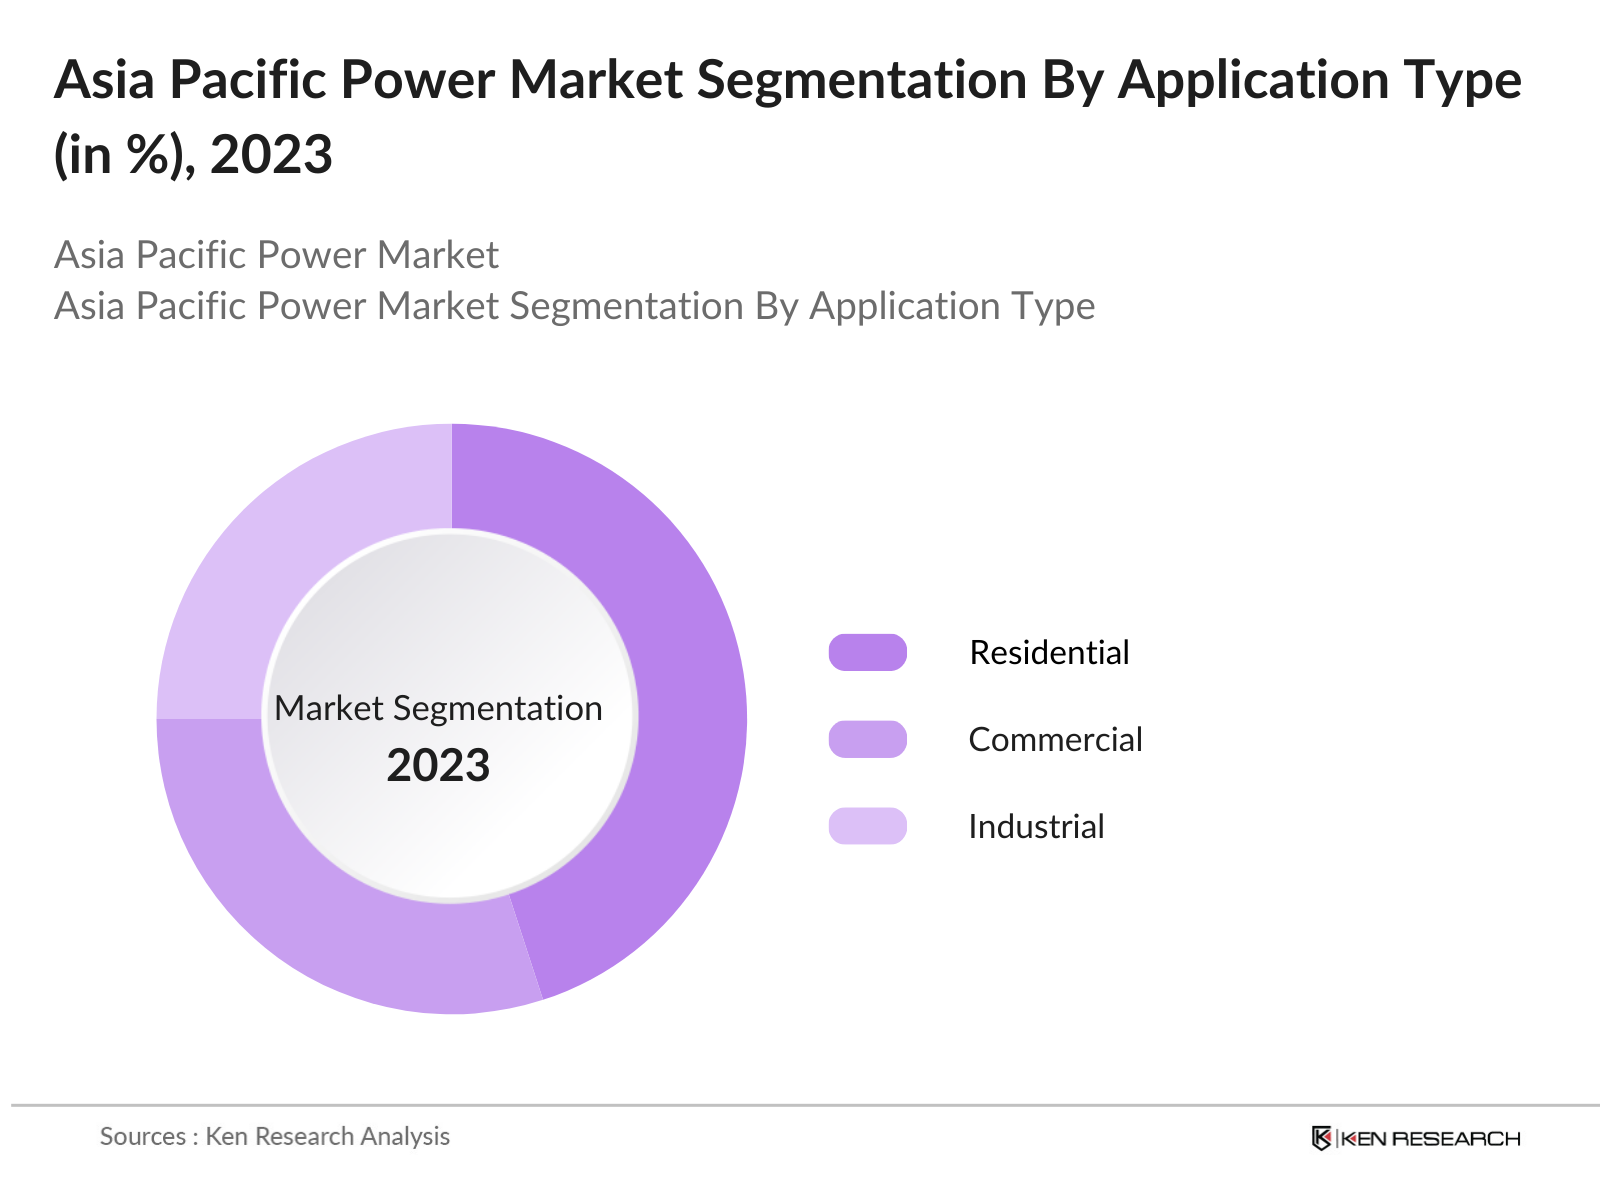
By Application: The market is further segmented by application into residential, commercial, and industrial sectors. The residential segment is currently leading the market due to increasing electrification and rising disposable incomes, enabling households to invest in reliable power solutions. As more consumers acquire electronic appliances and smart home technologies, the demand for efficient power supply systems is expected to grow. This shift towards energy-efficient solutions in households is significantly contributing to the segment's growth, reflecting changing consumer lifestyles and the growing emphasis on sustainable energy consumption.
Asia Pacific Power Supply Market Competitive Landscape
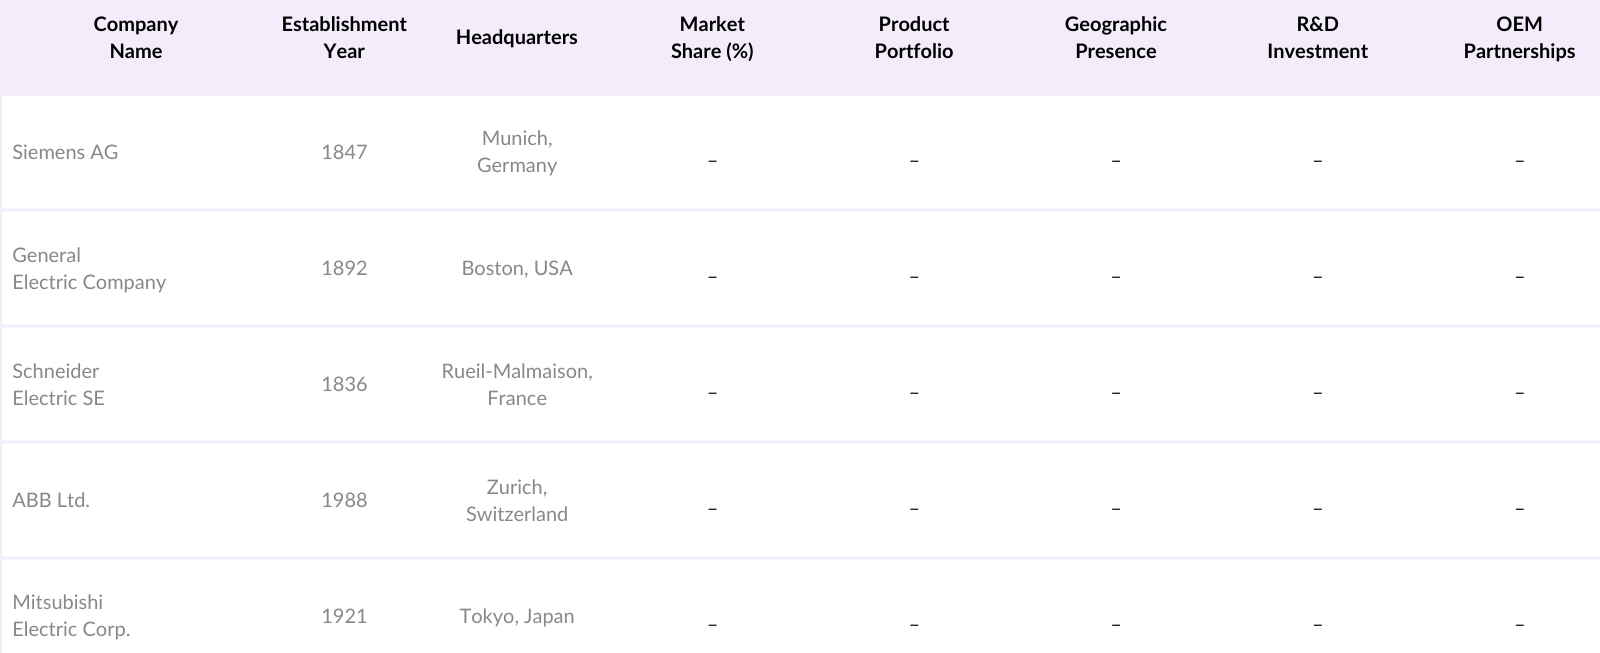
The Asia Pacific Power Supply Market is dominated by several major players, including multinational corporations and regional power supply firms. Key competitors include Siemens AG, General Electric Company, Schneider Electric SE, ABB Ltd., and Mitsubishi Electric Corporation. This consolidation underscores the competitive nature of the market, with established players leveraging advanced technologies and strong distribution networks to maintain their market positions.
Asia Pacific Power Supply Industry Analysis
Growth Drivers
- Increasing Energy Demand: The Asia Pacific region is witnessing an unprecedented rise in energy consumption, driven by growing populations and industrial expansions. For example, China, India, and Southeast Asia have seen their combined energy consumption increase by nearly 2,000 TWh in the last decade. In 2024, China's primary energy consumption reached over 155,000 petajoules, primarily fueled by coal and oil. India's energy demand is projected to increase as it works toward its 2025 target of becoming a $5 trillion economy, increasing industrial demand. The International Energy Agency (IEA) also reports that Asia will account for 50% of global energy demand by 2025.
- Renewable Energy Integration: The region has made strides in integrating renewable energy, a trend accelerated by government mandates. China leads the world in renewable energy deployment, with installed renewable capacity surpassing 1,100 GW in 2024, according to data from Chinas National Energy Administration. India added over 15,000 MW of solar and wind capacity in 2023. These shifts are supported by favorable government policies, including the promotion of large-scale wind and solar farms across the region, particularly in countries like Australia and Vietnam, whose renewable energy capacity increased by over 30% from 2022 to 2024.
- Government Policies and Incentives: Governments across the region are implementing aggressive policies to encourage clean energy. In 2024, China continued its "14th Five-Year Plan," focusing on capping coal use and advancing renewable power projects, with $400 billion allocated to clean energy investments. Meanwhile, India's renewable energy goals are underpinned by policies such as the Production-Linked Incentive (PLI) scheme, which provided nearly $3 billion to encourage solar panel manufacturing by 2024. Japan also aims to achieve carbon neutrality by 2050, driven by renewable subsidies and its Green Growth Strategy.
Market Challenges
- Regulatory Compliance: Stringent regulatory frameworks are often a significant hurdle in the power supply market. Countries like India and China have tightened environmental regulations to curb emissions. China, under its 2024 guidelines, penalized coal-fired power plants that exceeded set emission limits, requiring $5 billion in compliance costs across the sector. Indias Central Pollution Control Board mandates emission caps for thermal power plants, creating a regulatory burden that power suppliers need to navigate, while simultaneously adhering to renewable energy quotas.
- Infrastructure Limitations: Infrastructure in emerging economies like Bangladesh, Myanmar, and parts of India still lags behind their growing energy needs. According to the World Bank, in 2023, nearly 100 million people in South Asia had limited access to reliable electricity, impacting businesses and daily life. Existing transmission systems, especially in rural regions, are often outdated, leading to frequent power outages and losses. In 2024, Southeast Asia lost about 8% of its total electricity due to transmission inefficiencies. These infrastructure gaps present a formidable challenge for ensuring consistent energy supply.
Asia Pacific Power Supply Market Future Outlook
Over the next five years, the Asia Pacific Power Supply Market is expected to demonstrate significant growth driven by continuous government support for renewable energy initiatives, advancements in power supply technologies, and rising consumer demand for reliable and efficient energy solutions. The transition towards cleaner energy sources, coupled with urbanization and industrialization trends, will further propel the market. As countries implement stricter regulations on emissions and invest in sustainable energy infrastructure, the power supply landscape is poised for transformation.
Opportunities
- Technological Innovations: Technological advancements, particularly in smart grid and energy storage solutions, present significant opportunities. As of 2024, China invested over $35 billion in upgrading its grid infrastructure with smart grid technology to enhance efficiency and reduce losses. India has also been focusing on deploying smart meters, with 150 million units set for installation by 2025 under the "National Smart Grid Mission." These developments allow for better load management and energy distribution, presenting growth opportunities for companies in the power supply industry.
- Strategic Partnerships: Strategic alliances between global energy companies and local entities offer an avenue for technological exchange and market expansion. In 2024, partnerships between Indian and Japanese firms facilitated the deployment of advanced hydrogen-based power solutions, driven by shared expertise and investment worth over $10 billion. Similarly, cross-border collaborations, such as
Scope of the Report
|
Product Type |
Power Inverters Voltage Regulators Power Supplies for Industrial Applications |
|
Technology |
Solar Power Solutions Wind Energy Solutions Conventional Power Supply Technologies |
|
Application |
Residential Commercial Industrial |
|
Region |
East Asia Southeast Asia South Asia |
|
End-User |
Utilities Independent Power Producers Government and Public Sector |
Products
Key Target Audience Organizations and Entities Who Can Benefit by Subscribing This Report:
Investor and Venture Capitalist Firms
Government and Regulatory Bodies (e.g., Ministry of Energy, Government of India)
Utility Companies
Industrial Manufacturing Industries
Renewable Energy Development Companies
Construction and Infrastructure Companies
Real Estate Industries
Technology Provider Companies
Companies
Players Mentioned in the Report
Siemens AG
General Electric Company
Schneider Electric SE
ABB Ltd.
Mitsubishi Electric Corporation
Toshiba Corporation
Hitachi Ltd.
Eaton Corporation PLC
Nidec Corporation
Enphase Energy, Inc.
Table of Contents
1. Asia Pacific Power Supply Market Overview
1.1. Definition and Scope
1.2. Market Taxonomy
1.3. Market Growth Rate (CAGR)
1.4. Market Segmentation Overview
2. Asia Pacific Power Supply Market Size (In USD Mn)
2.1. Historical Market Size
2.2. Year-On-Year Growth Analysis
2.3. Key Market Developments and Milestones
3. Asia Pacific Power Supply Market Analysis
3.1. Growth Drivers
3.1.1. Increasing Energy Demand
3.1.2. Renewable Energy Integration
3.1.3. Government Policies and Incentives
3.1.4. Urbanization and Industrialization
3.2. Market Challenges
3.2.1. Regulatory Compliance
3.2.2. Infrastructure Limitations
3.2.3. Competition from Alternative Energy Sources
3.3. Opportunities
3.3.1. Technological Innovations
3.3.2. Strategic Partnerships
3.3.3. Expanding Electric Vehicle Infrastructure
3.4. Trends
3.4.1. Smart Grid Technology Adoption
3.4.2. Energy Storage Solutions
3.4.3. Decentralized Power Generation
3.5. Government Regulation
3.5.1. Emission Standards
3.5.2. Renewable Energy Mandates
3.5.3. Energy Efficiency Programs
3.6. SWOT Analysis
3.7. Stakeholder Ecosystem
3.8. Porters Five Forces Analysis
3.9. Competition Ecosystem
4. Asia Pacific Power Supply Market Segmentation
4.1. By Product Type (In Value %)
4.1.1. Power Inverters
4.1.2. Voltage Regulators
4.1.3. Power Supplies for Industrial Applications
4.2. By Technology (In Value %)
4.2.1. Solar Power Solutions
4.2.2. Wind Energy Solutions
4.2.3. Conventional Power Supply Technologies
4.3. By Application (In Value %)
4.3.1. Residential
4.3.2. Commercial
4.3.3. Industrial
4.4. By Region (In Value %)
4.4.1. East Asia
4.4.2. Southeast Asia
4.4.3. South Asia
4.5. By End-User (In Value %)
4.5.1. Utilities
4.5.2. Independent Power Producers
4.5.3. Government and Public Sector
5. Asia Pacific Power Supply Market Competitive Analysis
5.1. Detailed Profiles of Major Companies
5.1.1. Siemens AG
5.1.2. General Electric Company
5.1.3. Schneider Electric SE
5.1.4. ABB Ltd.
5.1.5. Mitsubishi Electric Corporation
5.1.6. Emerson Electric Co.
5.1.7. Eaton Corporation PLC
5.1.8. Toshiba Corporation
5.1.9. Hitachi Ltd.
5.1.10. Nidec Corporation
5.1.11. Kyocera Corporation
5.1.12. Enphase Energy, Inc.
5.1.13. First Solar, Inc.
5.1.14. Canadian Solar Inc.
5.1.15. SunPower Corporation
5.2. Cross Comparison Parameters (Market Share, Revenue, R&D Spending, Employee Count, Geographic Presence, Product Portfolio, Customer Segments, Sustainability Initiatives)
5.3. Market Share Analysis
5.4. Strategic Initiatives
5.5. Mergers and Acquisitions
5.6. Investment Analysis
5.7. Venture Capital Funding
5.8. Government Grants
5.9. Private Equity Investments
6. Asia Pacific Power Supply Market Regulatory Framework
6.1. Environmental Standards
6.2. Compliance Requirements
6.3. Certification Processes
7. Asia Pacific Power Supply Market Future Size (In USD Mn)
7.1. Future Market Size Projections
7.2. Key Factors Driving Future Market Growth
8. Asia Pacific Power Supply Market Future Segmentation
8.1. By Product Type (In Value %)
8.2. By Technology (In Value %)
8.3. By Application (In Value %)
8.4. By Region (In Value %)
8.5. By End-User (In Value %)
9. Asia Pacific Power Supply Market Analysts Recommendations
9.1. TAM/SAM/SOM Analysis
9.2. Customer Cohort Analysis
9.3. Marketing Initiatives
9.4. White Space Opportunity Analysis
Disclaimer Contact UsResearch Methodology
Step 1: Identification of Key Variables
The initial phase involves constructing an ecosystem map encompassing all major stakeholders within the Asia Pacific Power Supply Market. This step is underpinned by extensive desk research, utilizing a combination of secondary and proprietary databases to gather comprehensive industry-level information. The primary objective is to identify and define the critical variables that influence market dynamics.
Step 2: Market Analysis and Construction
In this phase, we will compile and analyze historical data pertaining to the Asia Pacific Power Supply Market. This includes assessing market penetration, the ratio of marketplaces to service providers, and the resultant revenue generation. Furthermore, an evaluation of service quality statistics will be conducted to ensure the reliability and accuracy of the revenue estimates.
Step 3: Hypothesis Validation and Expert Consultation
Market hypotheses will be developed and subsequently validated through computer-assisted telephone interviews (CATIs) with industry experts representing a diverse array of companies. These consultations will provide valuable operational and financial insights directly from industry practitioners, which will be instrumental in refining and corroborating the market data.
Step 4: Research Synthesis and Final Output
The final phase involves direct engagement with multiple power supply manufacturers to acquire detailed insights into product segments, sales performance, consumer preferences, and other pertinent factors. This interaction will serve to verify and complement the statistics derived from the bottom-up approach, thereby ensuring a comprehensive, accurate, and validated analysis of the Asia Pacific Power Supply Market.
Frequently Asked Questions
01. How big is the Asia Pacific Power Supply Market?
The Asia Pacific Power Supply Market is valued at USD 5.2 billion, reflecting strong growth driven by increasing energy consumption and advancements in renewable energy technologies.
02. What are the challenges in the Asia Pacific Power Supply Market?
Challenges include regulatory compliance, infrastructure limitations, and competition from alternative energy sources. These factors can impact market growth and profitability for companies operating in this sector.
03. Who are the major players in the Asia Pacific Power Supply Market?
Key players in the market include Siemens AG, General Electric Company, Schneider Electric SE, ABB Ltd., and Mitsubishi Electric Corporation. These companies dominate due to their strong brand presence and comprehensive product offerings.
04. What are the growth drivers of the Asia Pacific Power Supply Market?
The market is propelled by increasing energy demand across residential, commercial, and industrial sectors, alongside significant investments in renewable energy and smart grid technologies.
Why Buy From Us?
 Framework")
What makes us stand out is that our consultants follows Robust, Refine and Result (RRR) methodology. i.e. Robust for clear definitions, approaches and sanity checking, Refine for differentiating respondents facts and opinions and Result for presenting data with story

We have set a benchmark in the industry by offering our clients with syndicated and customized market research reports featuring coverage of entire market as well as meticulous research and analyst insights.

While we don't replace traditional research, we flip the method upside down. Our dual approach of Top Bottom & Bottom Top ensures quality deliverable by not just verifying company fundamentals but also looking at the sector and macroeconomic factors.

With one step in the future, our research team constantly tries to show you the bigger picture. We help with some of the tough questions you may encounter along the way: How is the industry positioned? Best marketing channel? KPI's of competitors? By aligning every element, we help maximize success.

Our report gives you instant access to the answers and sources that other companies might choose to hide. We elaborate each steps of research methodology we have used and showcase you the sample size to earn your trust.

If you need any support, we are here! We pride ourselves on universe strength, data quality, and quick, friendly, and professional service.