
Asia Pacific Smart Displays Market Outlook to 2030
Region:Asia
Author(s):Yogita Sahu
Product Code:KROD7096
Region:Asia
Author(s):Yogita Sahu
Product Code:KROD7096
December 2024
81
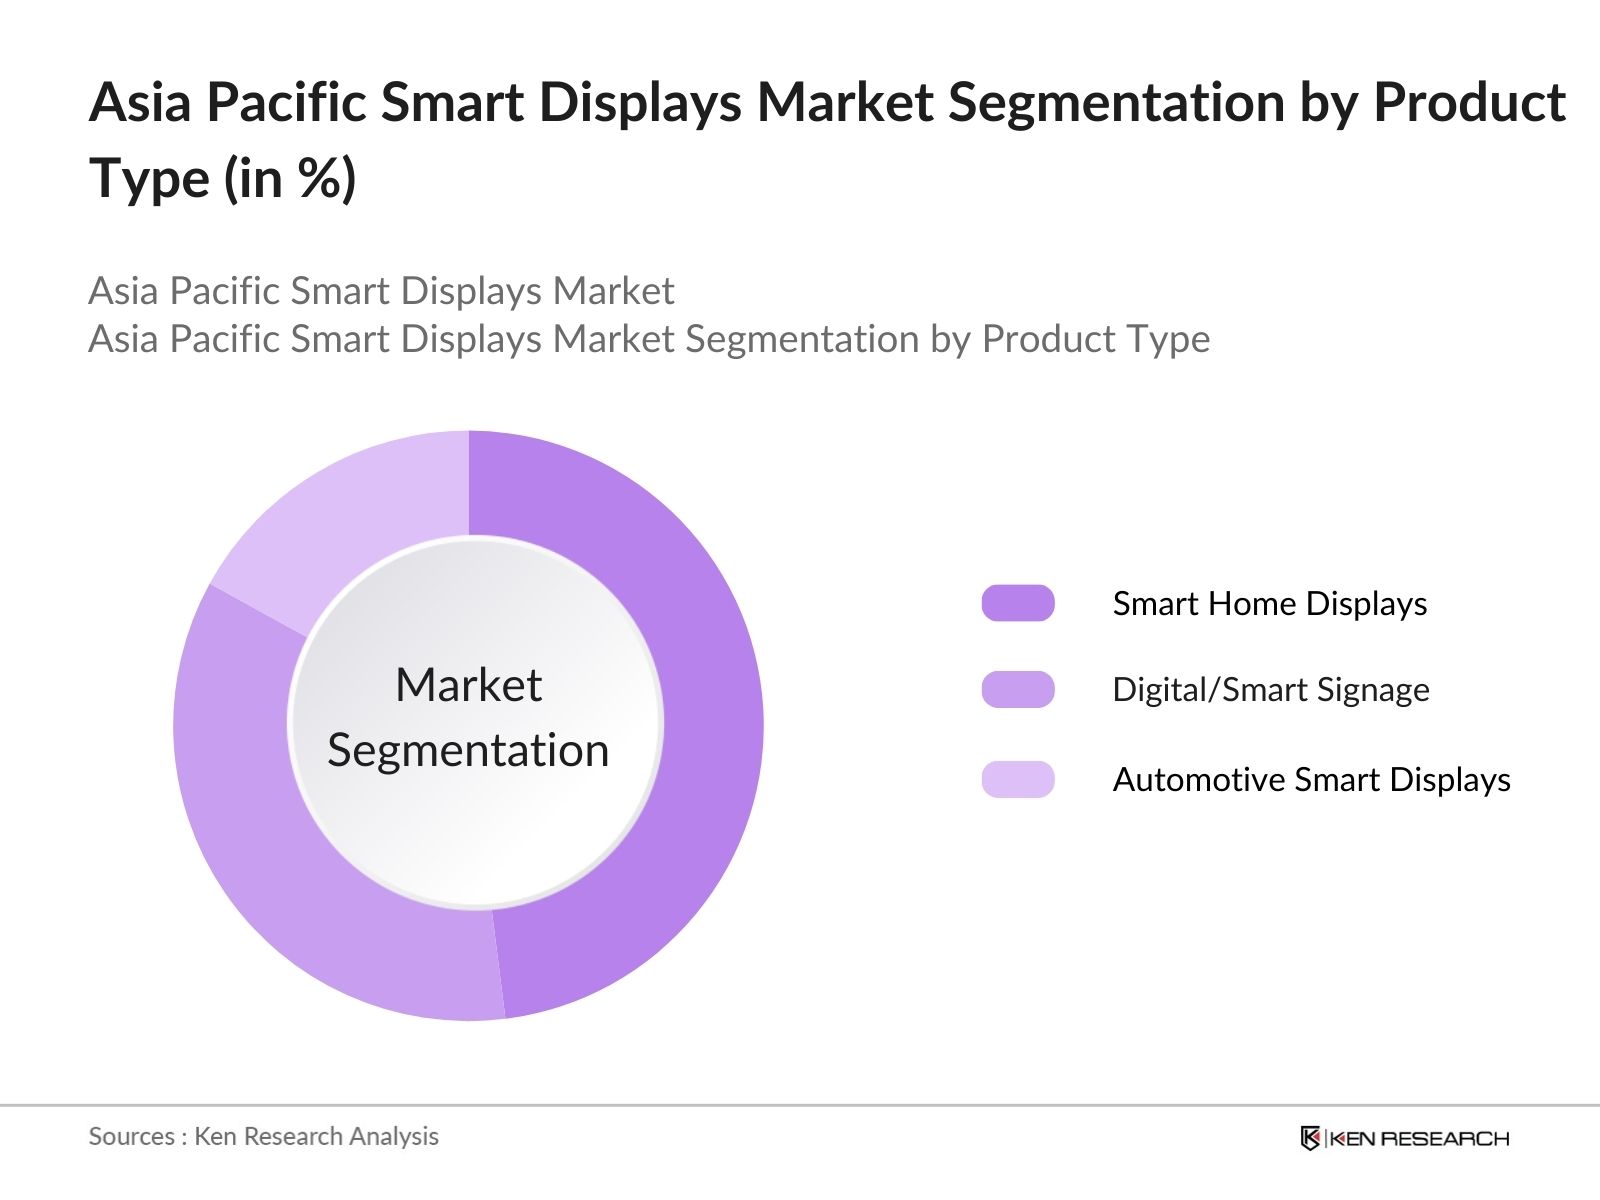
By Product Type: The market is categorized by product type into Smart Home Displays, Digital/Smart Signage, and Automotive Smart Displays. Currently, Smart Home Displays lead this segment due to their increased utility within smart homes, providing multifunctional displays that offer real-time information, security controls, and connectivity with other smart home devices. This segments dominance is attributed to the rapid adoption of smart homes across urban areas, with prominent brands integrating high-quality displays that cater to modern consumers demands for functionality and design aesthetics.
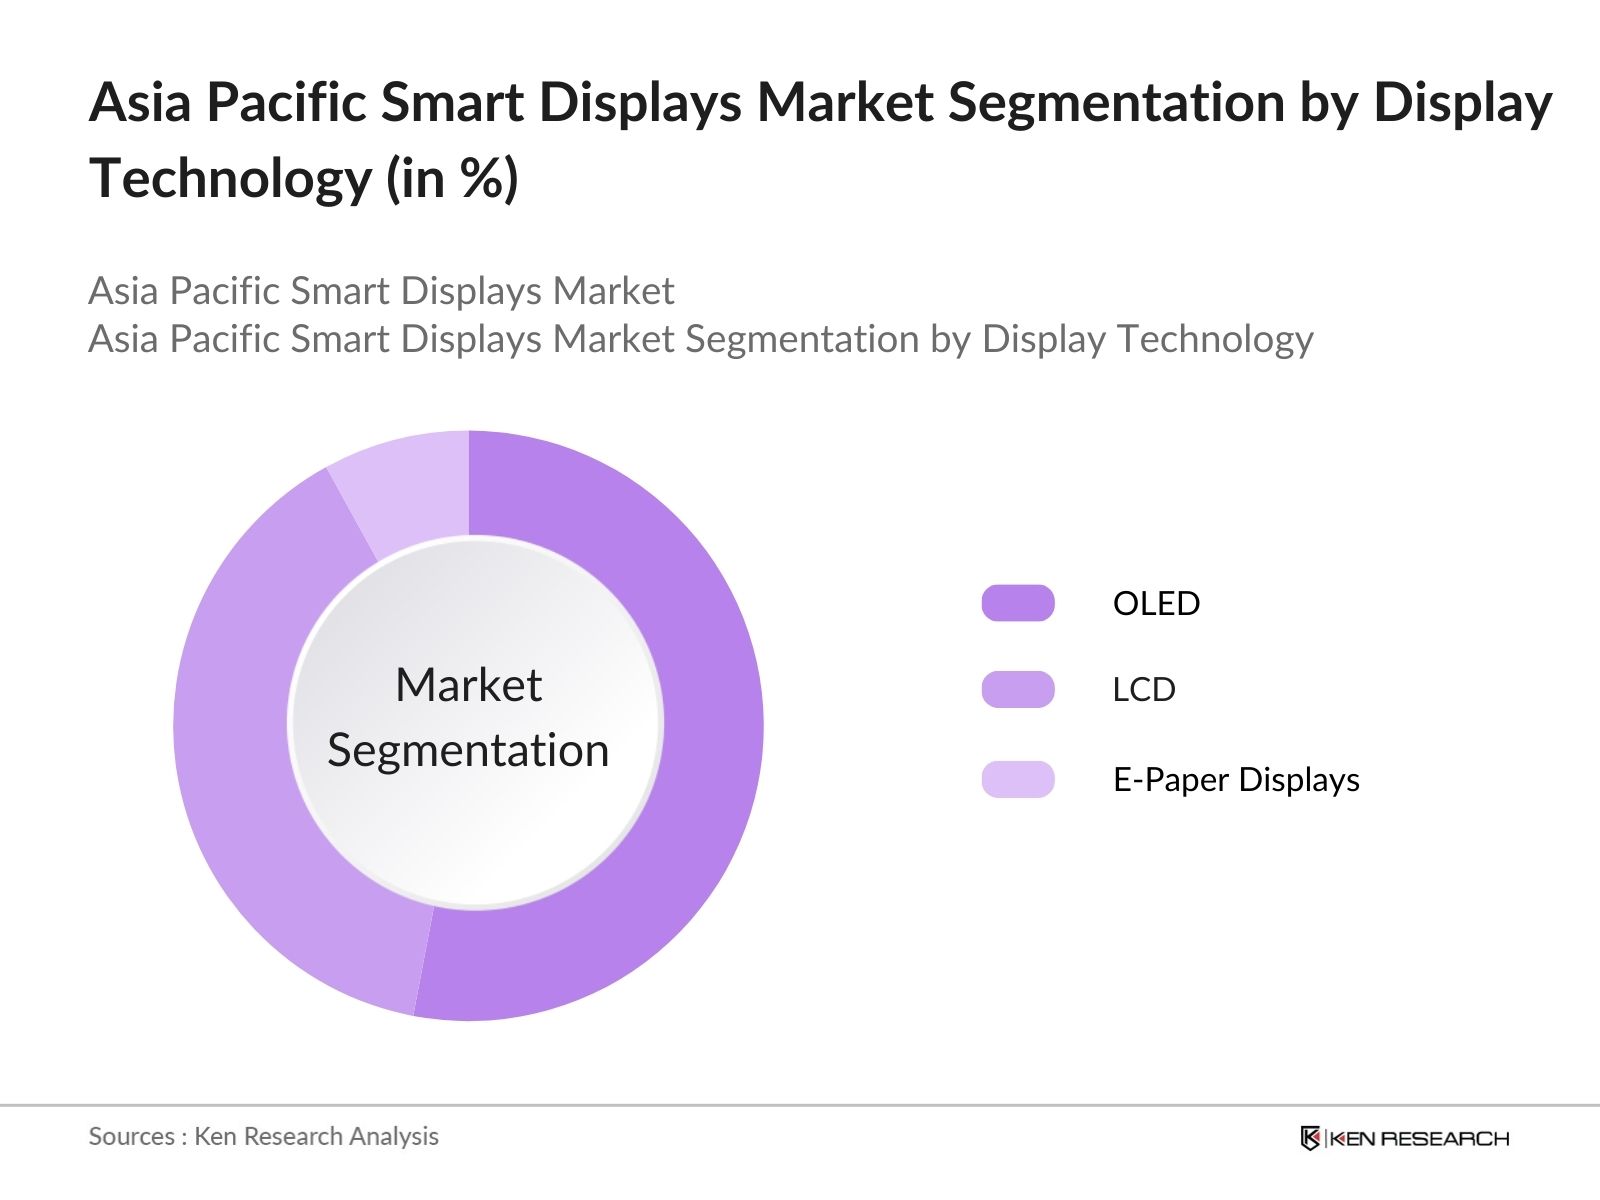
By Display Technology: The market is also segmented by display technology, including LCD, OLED, and E-Paper Displays. OLED displays dominate due to their superior image quality, flexible display options, and energy efficiency, which appeal to both residential and commercial consumers. These displays are particularly popular among brands focusing on premium product lines, as they allow for sleek, high-contrast visuals and lower energy consumption compared to traditional LCDs.
The market is characterized by a mix of local and global players, contributing to a competitive environment. Leading companies like Samsung, Sony, and LG dominate due to their advanced R&D capabilities, large-scale production, and extensive distribution networks across the region.
Over the next five years, the Asia Pacific Smart Displays industry is anticipated to experience robust growth, propelled by widespread integration of AI, IoT enhancements, and the growing adoption of smart home systems.
|
Product Type |
Smart Home Displays Smart Display Mirrors Digital Signage Other Displays |
|
Display Technology |
LCD OLED Other Technologies |
|
Display Size |
Below 32 Inch 32-52 Inch Above 52 Inch |
|
Resolution |
HD FHD UHD |
|
Application |
Residential Commercial Automotive Healthcare Other Applications |
|
Region |
China India Japan South Korea Rest of APAC |
1.1 Definition and Scope
1.2 Market Taxonomy
1.3 Key Market Dynamics
1.4 Market Segmentation Overview
2.1 Historical Market Size
2.2 Year-on-Year Growth Analysis
2.3 Key Milestones and Developments
3.1 Growth Drivers (Market Demand, Consumer Adoption, Technological Integration)
3.2 Market Challenges (Cost Constraints, Technical Barriers, Compliance Issues)
3.3 Opportunities (Regional Expansion, Niche Applications, Smart Home Integration)
3.4 Trends (AI in Displays, IoT Integration, Increased Display Quality)
3.5 Government Regulations
3.5.1 Import-Export Policies
3.5.2 Environmental Compliance
3.5.3 Data Privacy Standards
3.6 SWOT Analysis
3.7 Stakeholder Ecosystem
3.8 Porters Five Forces Analysis (Market Competition, New Entrants)
3.9 Competitive Landscape Overview
4.1 By Product Type (Revenue % Share)
4.1.1 Smart Home Displays
4.1.2 Smart Display Mirrors
4.1.3 Digital/Smart Signage
4.2 By Display Technology (Revenue % Share)
4.2.1 LCD
4.2.2 OLED
4.3 By Display Size (Revenue % Share)
4.3.1 Below 32 Inch
4.3.2 32 - 52 Inch
4.3.3 Above 52 Inch
4.4 By Resolution (Revenue % Share)
4.4.1 HD
4.4.2 FHD
4.4.3 UHD
4.5 By Application (Revenue % Share)
4.5.1 Residential
4.5.2 Commercial
4.5.3 Healthcare
4.5.4 Automotive & Transportation
4.6 By Region (Revenue % Share)
China
India
Japan
South Korea
Rest of APAC
5.1 Profiles of Major Companies
5.1.1 Samsung Electronics
5.1.2 Sony Corporation
5.1.3 LG Corporation
5.1.4 Google, LLC
5.1.5 Panasonic Corp.
5.1.6 Xiaomi Technology
5.1.7 Lenovo Group Limited
5.1.8 Apple Inc.
5.1.9 TPV Technology
5.1.10 Sharp Corp.
5.1.11 Visteon Corp.
5.1.12 BOE Technology Group
5.1.13 Leyard Optoelectronics
5.1.14 Magna International
5.1.15 Newline Interactive
5.2 Cross Comparison Parameters (Revenue, Employees, Key Partnerships, Product Innovation)
5.3 Market Share Analysis
5.4 Strategic Initiatives
5.5 Mergers & Acquisitions
5.6 Venture Capital Funding
5.7 Investment Trends
5.8 Government Incentives & Grants
6.1 Industry Standards
6.2 Certification Processes
6.3 Compliance and Licensing Requirements
7.1 Future Market Size Projections
7.2 Key Drivers for Future Growth
8.1 By Product Type
8.2 By Display Technology
8.3 By Display Size
8.4 By Resolution
8.5 By Application
8.6 By Region
9.1 Target Market Analysis
9.2 Strategic Market Entry Recommendations
9.3 White Space Opportunity Analysis
9.4 Marketing and Promotion Strategy
Disclaimer Contact Us
The initial phase involved mapping all primary stakeholders in the Asia Pacific Smart Displays Market. Extensive desk research was conducted to identify the key influencing variables, utilizing secondary databases to compile comprehensive data on industry trends, competitive factors, and growth drivers.
This stage involved aggregating historical data on market penetration rates, the ratio of smart displays across various applications, and revenue generation to construct an accurate market analysis. A detailed review of quality and customer preference statistics was also undertaken to validate revenue estimations.
Hypotheses were developed and subsequently validated through computer-assisted telephone interviews (CATIs) with industry experts. These consultations provided insights into operational and financial aspects, enabling further refinement of market data.
The concluding phase included direct interactions with key manufacturers to gather specific data on product categories, sales performance, and consumer preferences, complementing bottom-up data for an accurate analysis of the Asia Pacific Smart Displays Market.
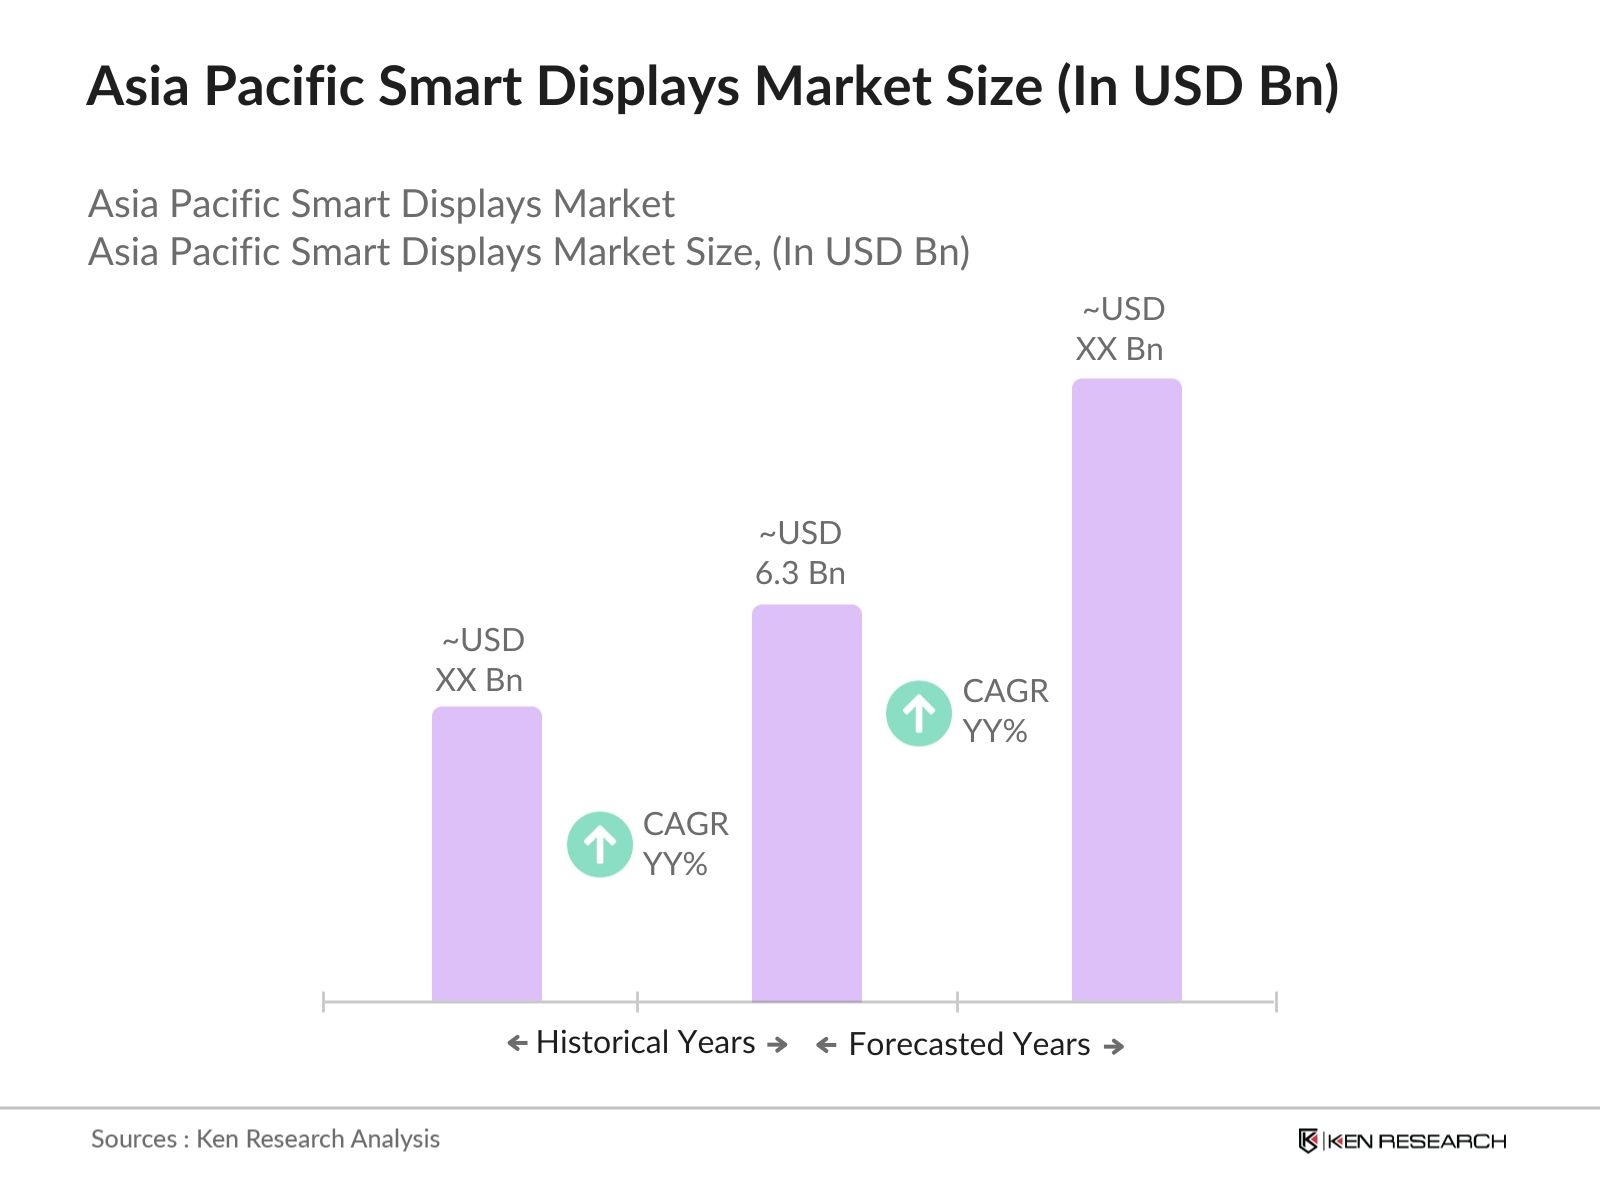
The Asia Pacific Smart Displays Market is valued at USD 6.3 billion, driven by the increasing demand for smart home and IoT-integrated devices that enhance consumer convenience and connectivity.
Key challenges in the Asia Pacific Smart Displays Market include high manufacturing costs for advanced displays, regulatory requirements for data protection, and the need for technological upgrades to keep up with global standards in smart displays.
Prominent companies in the Asia Pacific Smart Displays Market include Samsung, Sony, LG, Xiaomi, and Panasonic, which dominate due to their extensive distribution networks, cutting-edge R&D, and innovative product portfolios.
The Asia Pacific Smart Displays Market is propelled by factors such as the growing consumer shift towards smart home devices, government initiatives supporting smart city development, and advances in AI and IoT technology.
 Framework")
What makes us stand out is that our consultants follows Robust, Refine and Result (RRR) methodology. i.e. Robust for clear definitions, approaches and sanity checking, Refine for differentiating respondents facts and opinions and Result for presenting data with story

We have set a benchmark in the industry by offering our clients with syndicated and customized market research reports featuring coverage of entire market as well as meticulous research and analyst insights.

While we don't replace traditional research, we flip the method upside down. Our dual approach of Top Bottom & Bottom Top ensures quality deliverable by not just verifying company fundamentals but also looking at the sector and macroeconomic factors.

With one step in the future, our research team constantly tries to show you the bigger picture. We help with some of the tough questions you may encounter along the way: How is the industry positioned? Best marketing channel? KPI's of competitors? By aligning every element, we help maximize success.

Our report gives you instant access to the answers and sources that other companies might choose to hide. We elaborate each steps of research methodology we have used and showcase you the sample size to earn your trust.

If you need any support, we are here! We pride ourselves on universe strength, data quality, and quick, friendly, and professional service.