


Asia Pacific Snack Bar Market Outlook to 2030
Region:Asia
Author(s):Vijay Kumar
Product Code:KROD9217
November 2024
82
About the Report
Asia Pacific Snack Bar Market Overview
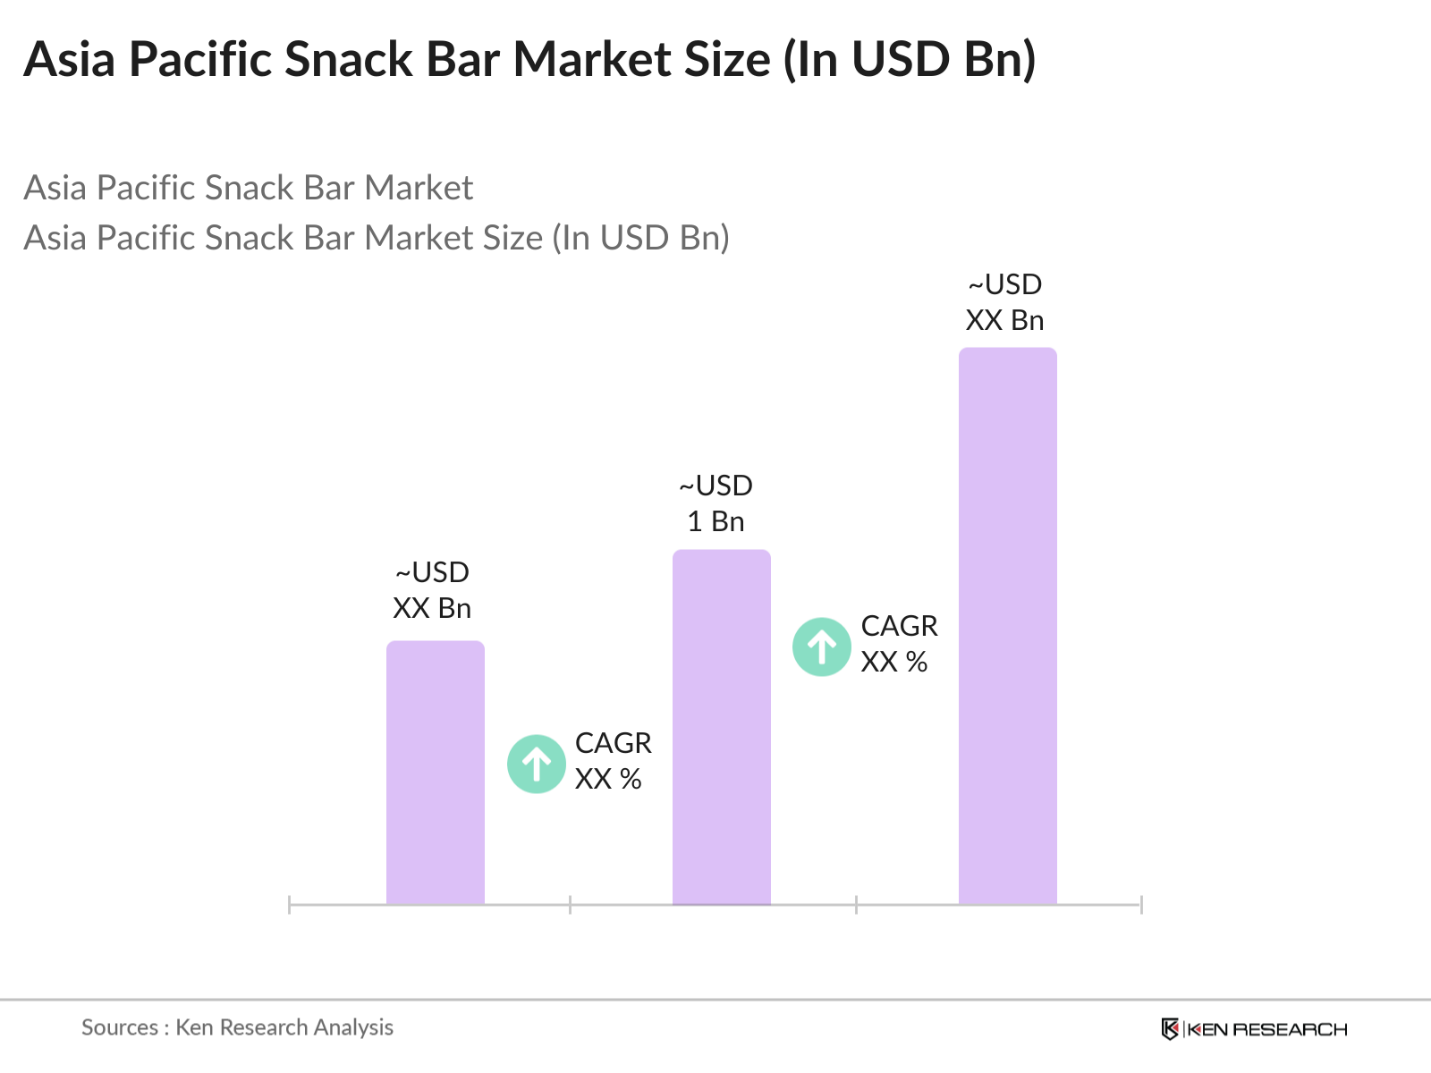
- The Asia Pacific snack bar market is valued at USD 1 billion, based on a five-year historical analysis. This market is primarily driven by increasing health consciousness and the demand for convenient, nutritious on-the-go snacks. As consumers become more health-aware, the shift towards snacks that offer nutritional benefits rather than empty calories is evident. Factors such as urbanization and busy lifestyles are also propelling this growth, as consumers seek quick yet healthy food options to fit their fast-paced lives.
- Countries like Japan and Australia dominate the market due to their established health and wellness cultures, high disposable incomes, and widespread availability of snack bars through various retail channels. These nations have a mature market with consumers who prioritize healthy snacking options, contributing to their leading positions in the Asia Pacific snack bar market.
- Asia Pacific nations have established strict food safety standards, with countries like Japan and South Korea requiring rigorous inspections and certifications. Japans Ministry of Health, Labor, and Welfare reports over 95,000 routine inspections annually on food imports, affecting snack bar compliance. These standards ensure that only products meeting stringent health and safety requirements reach consumers, influencing the operations of domestic and international brands.
Asia Pacific Snack Bar Market Segmentation
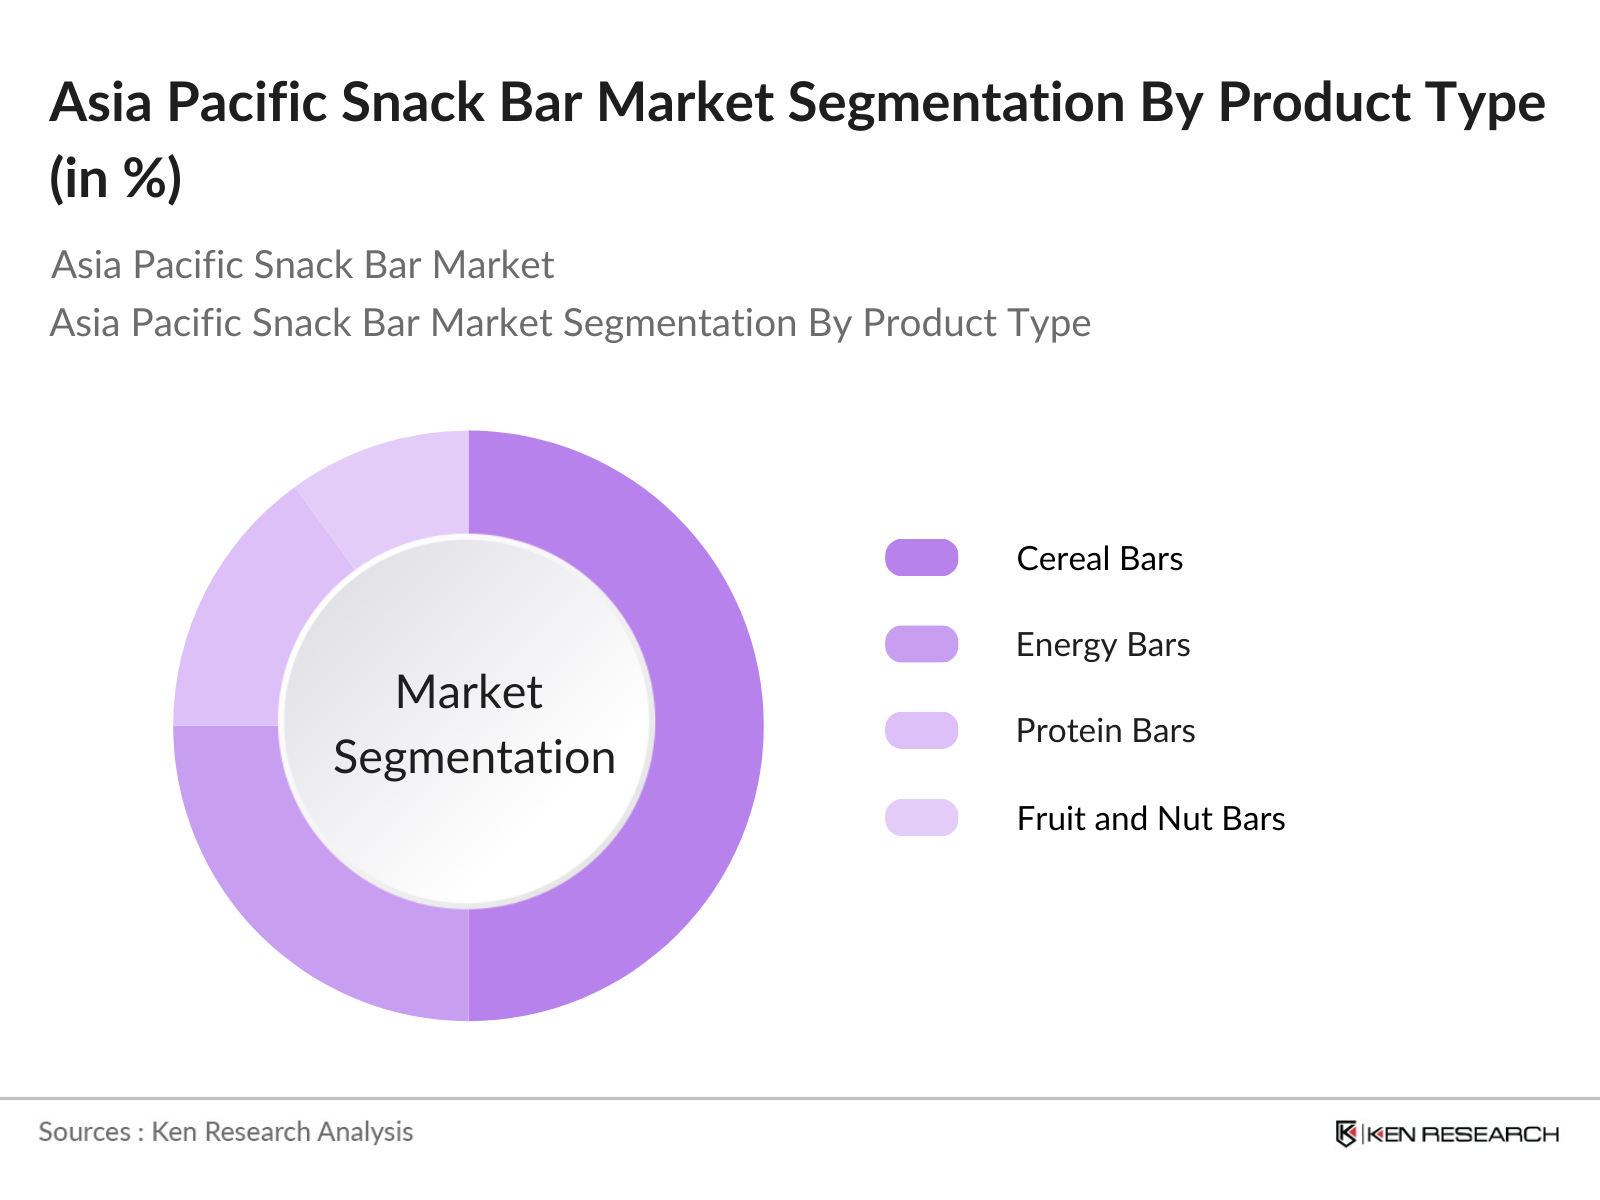
By Product Type: The market is segmented by product type into cereal bars, energy bars, protein bars, fruit and nut bars, and others. Cereal bars hold a dominant market share due to their versatility and appeal as a healthy snack option. They are often perceived as a convenient breakfast alternative, especially among urban consumers seeking quick yet nutritious options. The inclusion of whole grains, nuts, and dried fruits in cereal bars enhances their health appeal, further driving their popularity.
By Distribution Channel: The market is also segmented by distribution channel into supermarkets and hypermarkets, convenience stores, online retail, specialty stores, and others. Supermarkets and hypermarkets dominate the distribution channels, offering a wide variety of snack bars and attracting consumers with competitive pricing and promotional offers. Their extensive reach and the convenience of one-stop shopping make them the preferred choice for consumers purchasing snack bars.

Asia Pacific Snack Bar Market Competitive Landscape
The Asia Pacific snack bar market is characterized by the presence of both global and regional players, leading to intense competition. Major companies focus on product innovation, expanding distribution networks, and strategic partnerships to strengthen their market positions. The competitive landscape is dynamic, with companies continuously adapting to changing consumer preferences and market trends.

Asia Pacific Snack Bar Industry Analysis
Growth Drivers
- Rising Health Consciousness: Health consciousness has risen significantly in the Asia Pacific region, driven by a sharp increase in awareness of lifestyle-related diseases. According to the World Health Organization, non-communicable diseases such as diabetes and cardiovascular illnesses now account for approximately 17 million deaths in the region annually, pushing consumers toward healthier snacks. In 2024, Japan, South Korea, and Singapore reported a 30% surge in the demand for healthy snack bars, such as low-sugar or high-protein options.
- Urbanization and Busy Lifestyles: Urbanization has intensified across Asia Pacific, with over 1.5 billion people residing in urban areas as of 2024, based on data from the United Nations. Countries like China, with an urban population surpassing 900 million, are seeing a rise in snack bar consumption as residents seek convenient and portable food options. The Philippines, Indonesia, and Vietnam also reported an increase of over 20% in single-serving snack purchases among urban dwellers in the last year. This trend underscores the demand for quick and nutritious snack options, making snack bars a favorable choice.
- Expansion of Retail Channels: The retail landscape in the Asia Pacific is undergoing rapid transformation, with over 30,000 new convenience stores established across China, Japan, and South Korea in 2024 alone. According to the Asia Pacific Retail Association, these stores offer accessible points of purchase for snack bars, aligning with the needs of the modern consumer. E-commerce platforms report a 40% uptick in snack bar sales compared to last year, highlighting the growth potential in online distribution.
Market Challenges
- Intense Market Competition: Intense competition among local and international brands is a primary challenge in the Asia Pacific snack bar market. With over 500 established brands vying for consumer attention in China alone, according to the Chinese Ministry of Commerce, market fragmentation remains high. Emerging domestic brands are capturing market share by offering niche flavors and locally relevant products, while established global brands maintain significant influence.
- Price Sensitivity Among Consumers: In Asia Pacific, price sensitivity is significant due to income disparities across the region. According to the World Bank, over 250 million people in South Asia live below the international poverty line, making affordability a key concern for snack bars. As a result, lower-income countries like India and Indonesia see high demand for economical snack options, often limiting the reach of premium products. Data from 2024 highlights that 65% of snack bar consumers in Indonesia prioritize price over other factors, influencing brand strategies to offer smaller, more affordable packages.
Asia Pacific Snack Bar Market Future Outlook
Over the next five years, the Asia Pacific snack bar market is expected to experience significant growth, driven by increasing health awareness, urbanization, and the expansion of retail channels. The demand for convenient, nutritious snacks is anticipated to rise, with consumers seeking products that align with their health and wellness goals. Additionally, the growth of e-commerce platforms is likely to provide new avenues for market expansion, offering consumers greater accessibility to a variety of snack bar options.
Market Opportunities
- Growth in E-commerce Platforms: E-commerce in Asia Pacific is rapidly expanding, with online retail sales reaching $3.8 trillion in 2024, according to the IMF. This growth offers snack bar brands significant access to consumers who prefer online shopping, especially in countries like China and South Korea, where online transactions account for over 30% of total retail sales. Additionally, rural areas in India and the Philippines are seeing increased digital penetration, making e-commerce a key channel for rural snack bar distribution and growth.
- Demand for Organic and Natural Products: Demand for organic and natural snack bars is on the rise as consumers prioritize health. According to the Organic Trade Association, Asia Pacific recorded a 28% increase in organic snack sales in 2024, led by markets such as Australia, Japan, and South Korea. This shift aligns with data showing that over 70 million people in the region actively seek non-GMO and organic certifications on food products. The demand creates a profitable avenue for brands focused on natural ingredient sourcing and organic certification.
Scope of the Report
|
Product Type |
Cereal Bars |
|
Distribution Channel |
Supermarkets and Hypermarkets |
|
Ingredient Type |
Organic |
|
Flavor |
Chocolate |
|
Country |
China |
Products
Key Target Audience
Snack Bar Manufacturers
Retailers and Distributors
Health and Wellness Centers
Fitness and Sports Nutrition Companies
Food and Beverage Investors
Government and Regulatory Bodies (e.g., Food Safety and Standards Authority)
Packaging and Supply Chain Companies
Marketing and Advertising Agencies
Companies
Players Mentioned in the Report
Nestl S.A.
General Mills Inc.
Kellogg Company
PepsiCo Inc.
Mondelez International
Clif Bar & Company
Mars, Incorporated
The Hershey Company
Nature Valley
Atkins Nutritionals
Table of Contents
1. Asia Pacific Snack Bar Market Overview
1.1. Definition and Scope
1.2. Market Taxonomy
1.3. Market Growth Rate
1.4. Market Segmentation Overview
2. Asia Pacific Snack Bar Market Size (In USD Billion)
2.1. Historical Market Size
2.2. Year-On-Year Growth Analysis
2.3. Key Market Developments and Milestones
3. Asia Pacific Snack Bar Market Analysis
3.1. Growth Drivers
3.1.1. Rising Health Consciousness
3.1.2. Urbanization and Busy Lifestyles
3.1.3. Expansion of Retail Channels
3.1.4. Product Innovation and Diversification
3.2. Market Challenges
3.2.1. Intense Market Competition
3.2.2. Price Sensitivity Among Consumers
3.2.3. Regulatory Compliance and Standards
3.3. Opportunities
3.3.1. Growth in E-commerce Platforms
3.3.2. Demand for Organic and Natural Products
3.3.3. Untapped Rural Markets
3.4. Trends
3.4.1. Preference for Plant-Based and Vegan Options
3.4.2. Adoption of Sustainable Packaging
3.4.3. Introduction of Functional Ingredients
3.5. Government Regulations
3.5.1. Food Safety Standards
3.5.2. Labeling and Nutritional Information Requirements
3.5.3. Import and Export Regulations
3.6. SWOT Analysis
3.7. Stakeholder Ecosystem
3.8. Porters Five Forces Analysis
3.9. Competitive Landscape
4. Asia Pacific Snack Bar Market Segmentation
4.1. By Product Type (In Value %)
4.1.1. Cereal Bars
4.1.2. Energy Bars
4.1.3. Protein Bars
4.1.4. Fruit and Nut Bars
4.1.5. Others
4.2. By Distribution Channel (In Value %)
4.2.1. Supermarkets and Hypermarkets
4.2.2. Convenience Stores
4.2.3. Online Retail
4.2.4. Specialty Stores
4.2.5. Others
4.3. By Ingredient Type (In Value %)
4.3.1. Organic
4.3.2. Conventional
4.4. By Flavor (In Value %)
4.4.1. Chocolate
4.4.2. Fruit
4.4.3. Nut
4.4.4. Mixed Flavors
4.4.5. Others
4.5. By Country (In Value %)
4.5.1. China
4.5.2. India
4.5.3. Japan
4.5.4. Australia
4.5.5. South Korea
4.5.6. Rest of Asia Pacific
Asia Pacific Snack Bar Market Competitive Analysis
5.1. Detailed Profiles of Major Companies
5.1.1. Nestl S.A.
5.1.2. General Mills Inc.
5.1.3. Kellogg Company
5.1.4. PepsiCo Inc.
5.1.5. Mondelez International
5.1.6. Clif Bar & Company
5.1.7. Mars, Incorporated
5.1.8. The Hershey Company
5.1.9. Nature Valley
5.1.10. Atkins Nutritionals
5.1.11. Kind LLC
5.1.12. Quest Nutrition
5.1.13. Abbott Laboratories
5.1.14. Premier Nutrition Corporation
5.1.15. Otsuka Pharmaceutical Co., Ltd.
5.2. Cross Comparison Parameters (Revenue, Market Share, Product Portfolio, Geographic Presence, R&D Investment, Strategic Initiatives, Number of Employees, Year of Establishment)
5.3. Market Share Analysis
5.4. Strategic Initiatives
5.5. Mergers and Acquisitions
5.6. Investment Analysis
5.6.1. Venture Capital Funding
5.6.2. Government Grants
5.6.3. Private Equity Investments
6. Asia Pacific Snack Bar Market Regulatory Framework
6.1. Food Safety and Standards Authority Regulations
6.2. Import and Export Policies
6.3. Labeling and Packaging Requirements
6.4. Nutritional Claims and Certifications
7. Asia Pacific Snack Bar Future Market Size (In USD Billion)
7.1. Future Market Size Projections
7.2. Key Factors Driving Future Market Growth
8. Asia Pacific Snack Bar Future Market Segmentation
8.1. By Product Type (In Value %)
8.2. By Distribution Channel (In Value %)
8.3. By Ingredient Type (In Value %)
8.4. By Flavor (In Value %)
8.5. By Country (In Value %)
9. Asia Pacific Snack Bar Market Analysts Recommendations
9.1. Total Addressable Market (TAM), Serviceable Available Market (SAM), and Serviceable Obtainable Market (SOM) Analysis
9.2. Customer Segmentation and Cohort Analysis
9.3. Marketing and Branding Strategies
9.4. Identification of White Space Opportunities
Disclaimer Contact UsResearch Methodology
Step 1: Identification of Key Variables
The initial phase involves constructing an ecosystem map encompassing all major stakeholders within the Asia Pacific Snack Bar Market. This step is underpinned by extensive desk research, utilizing a combination of secondary and proprietary databases to gather comprehensive industry-level information. The primary objective is to identify and define the critical variables that influence market dynamics.
Step 2: Market Analysis and Construction
In this phase, we compile and analyze historical data pertaining to the Asia Pacific Snack Bar Market. This includes assessing market penetration, the ratio of marketplaces to service providers, and the resultant revenue generation. Furthermore, an evaluation of service quality statistics is conducted to ensure the reliability and accuracy of the revenue estimates.
Step 3: Hypothesis Validation and Expert Consultation
Market hypotheses are developed and subsequently validated through computer-assisted telephone interviews (CATIs) with industry experts representing a diverse array of companies. These consultations provide valuable operational and financial insights directly from industry practitioners, which are instrumental in refining and corroborating the market data.
Step 4: Research Synthesis and Final Output
In this final stage, direct engagement with multiple snack bar manufacturers provides detailed insights into product segments, sales performance, consumer preferences, and other pertinent factors. This interaction is crucial for verifying and complementing data derived from the bottom-up approach, ensuring a comprehensive, accurate, and validated analysis of the Asia Pacific Snack Bar Market.
Frequently Asked Questions
01. How big is the Asia Pacific Snack Bar Market?
The Asia Pacific snack bar market is valued at USD 1 billion, based on a five-year historical analysis. This market is primarily driven by increasing health consciousness and the demand for convenient, nutritious on-the-go snacks.
02. What are the key growth drivers of the Asia Pacific Snack Bar Market?
The markets growth is propelled by factors such as rising health awareness, increasing preference for on-the-go snacking, and the growing influence of e-commerce, which allows easy access to a variety of snack options.
03. Who are the major players in the Asia Pacific Snack Bar Market?
Major players include Nestl S.A., General Mills Inc., Kellogg Company, PepsiCo Inc., and Mondelez International, each with strong brand portfolios and extensive distribution networks.
04. Which countries dominate the Asia Pacific Snack Bar Market?
Japan and Australia are key players in this market, largely due to high disposable incomes, a strong culture of health and wellness, and the widespread availability of snack bars through various retail channels.
Why Buy From Us?
 Framework")
What makes us stand out is that our consultants follows Robust, Refine and Result (RRR) methodology. i.e. Robust for clear definitions, approaches and sanity checking, Refine for differentiating respondents facts and opinions and Result for presenting data with story

We have set a benchmark in the industry by offering our clients with syndicated and customized market research reports featuring coverage of entire market as well as meticulous research and analyst insights.

While we don't replace traditional research, we flip the method upside down. Our dual approach of Top Bottom & Bottom Top ensures quality deliverable by not just verifying company fundamentals but also looking at the sector and macroeconomic factors.

With one step in the future, our research team constantly tries to show you the bigger picture. We help with some of the tough questions you may encounter along the way: How is the industry positioned? Best marketing channel? KPI's of competitors? By aligning every element, we help maximize success.

Our report gives you instant access to the answers and sources that other companies might choose to hide. We elaborate each steps of research methodology we have used and showcase you the sample size to earn your trust.

If you need any support, we are here! We pride ourselves on universe strength, data quality, and quick, friendly, and professional service.