
Asia Pacific Snacks Food Market Outlook to 2030
Region:Asia
Author(s):Naman Rohilla
Product Code:KROD5204
Region:Asia
Author(s):Naman Rohilla
Product Code:KROD5204
December 2024
93
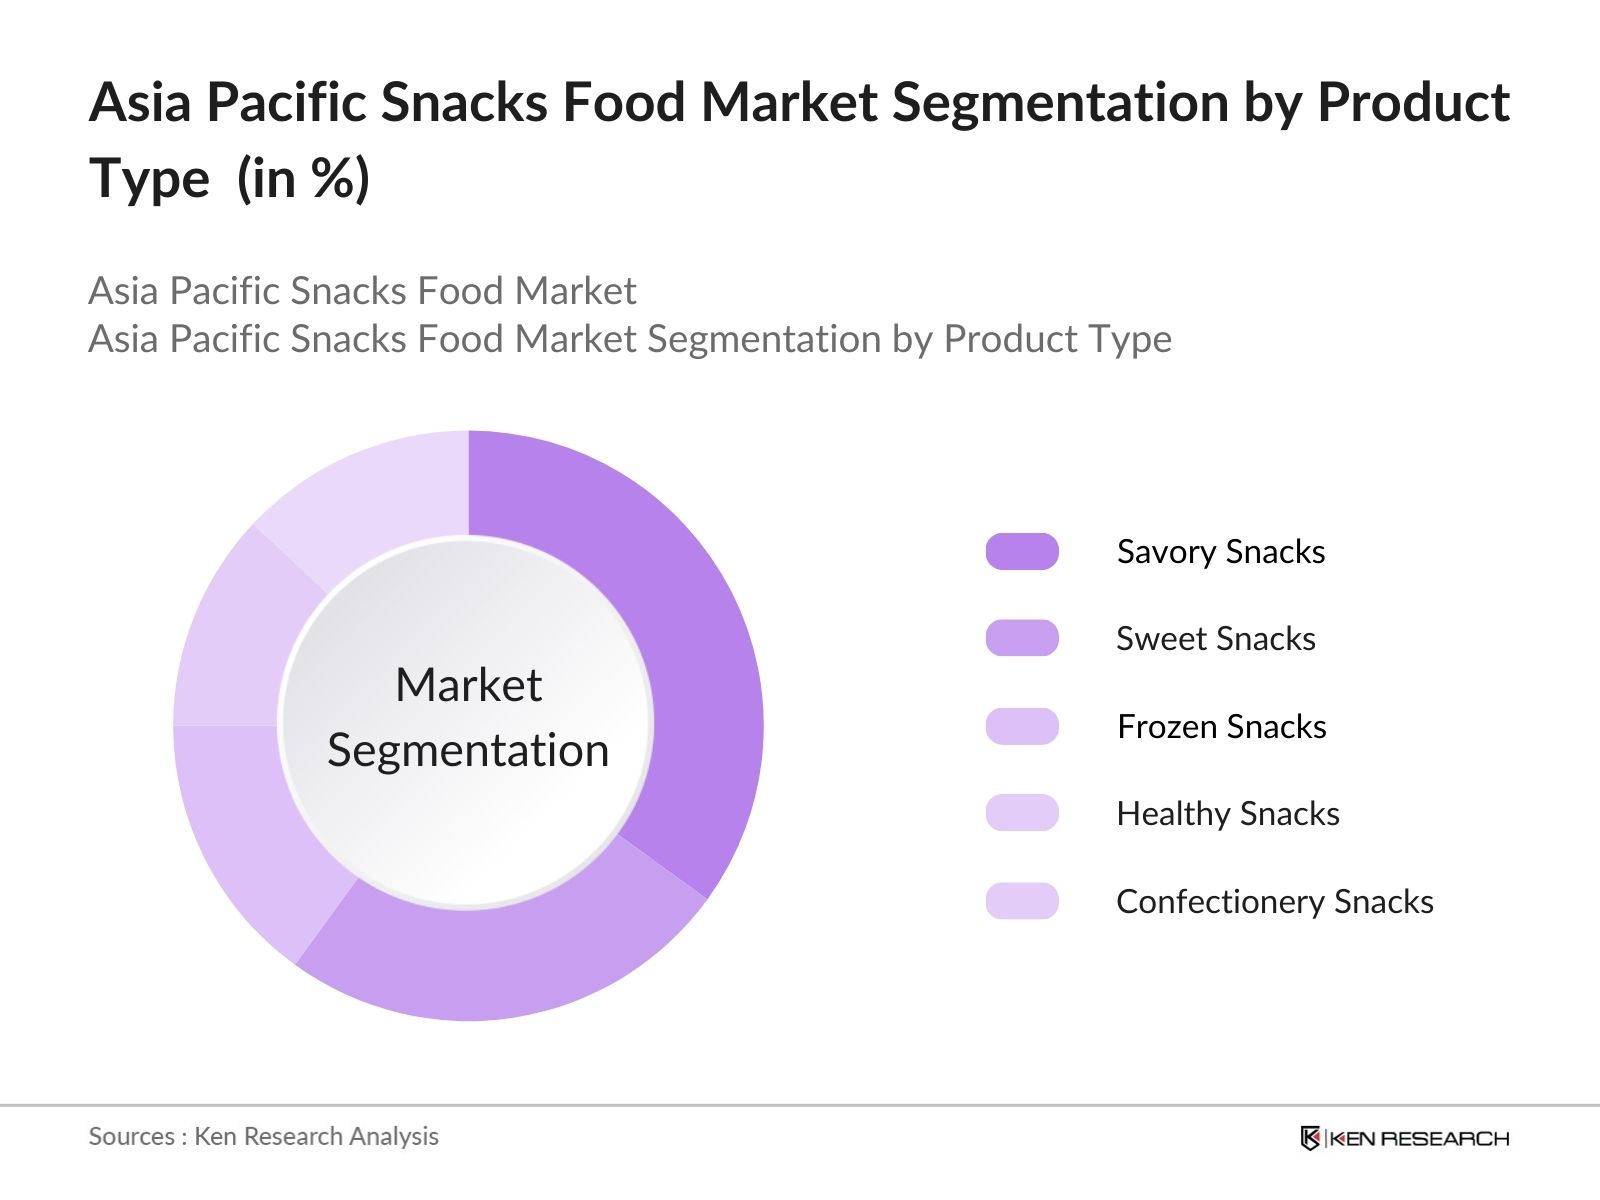
By Product Type: The Asia Pacific snacks food market is segmented by product type into savory snacks, sweet snacks, frozen snacks, healthy snacks, and confectionery snacks. Recently, savory snacks have maintained a dominant market share under the product type segmentation due to their widespread consumption across all age groups and their convenience for on-the-go snacking. Popular choices include chips, crackers, and nuts, with brands like Lays and Pringles enjoying strong consumer loyalty. The savory snacks category's versatility in flavor offerings and continued innovation in healthier options, such as baked and low-sodium snacks, further contribute to its leading position.
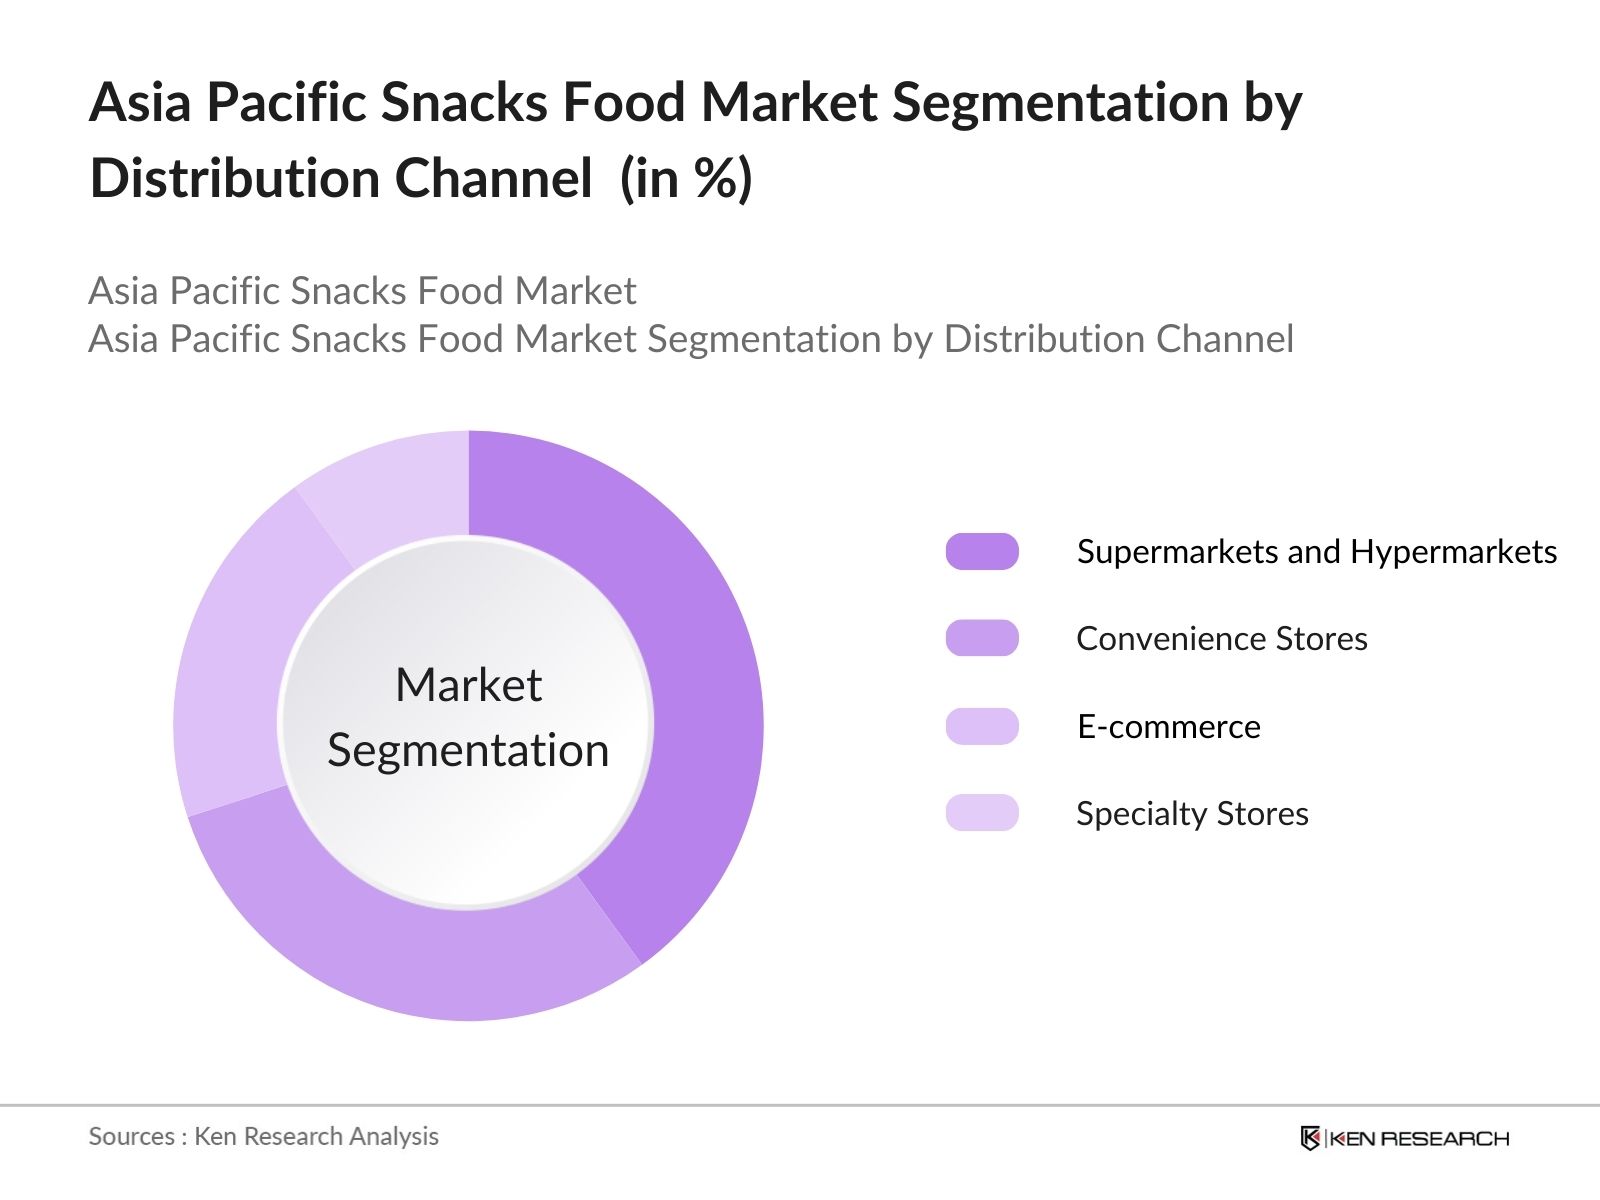
By Distribution Channel: The market is segmented by distribution channel into supermarkets and hypermarkets, convenience stores, e-commerce, and specialty stores. Supermarkets and hypermarkets lead the distribution channel market share due to their widespread presence and the convenience of one-stop shopping experiences. These channels allow consumers to easily access a wide variety of snack options, supported by frequent promotions and bulk purchasing opportunities. With major retail chains such as Walmart and Tesco expanding their operations across Asia Pacific, supermarkets have become the go-to option for a large percentage of the population.
The Asia Pacific snacks food market is dominated by both global and local players, leading to a highly competitive landscape. The presence of well-established brands ensures consolidation of market power among key players. These companies leverage their strong distribution networks, innovative product offerings, and extensive marketing campaigns to maintain their market positions. Major players such as PepsiCo, Mondelez International, and Nestl hold market influence, continuously launching new products to cater to shifting consumer preferences towards healthier snack options.
|
Company |
Establishment Year |
Headquarters |
Revenue (USD Bn) |
No. of Employees |
Market Penetration |
Product Range |
Sustainability Initiatives |
Brand Loyalty |
|
PepsiCo |
1965 |
Purchase, USA |
- |
- |
- |
- |
- |
- |
|
Mondelez International |
2012 |
Chicago, USA |
- |
- |
- |
- |
- |
- |
|
Nestl S.A. |
1867 |
Vevey, Switzerland |
- |
- |
- |
- |
- |
- |
|
Calbee Inc. |
1949 |
Tokyo, Japan |
- |
- |
- |
- |
- |
- |
|
The Kellogg Company |
1906 |
Michigan, USA |
- |
- |
- |
- |
- |
- |
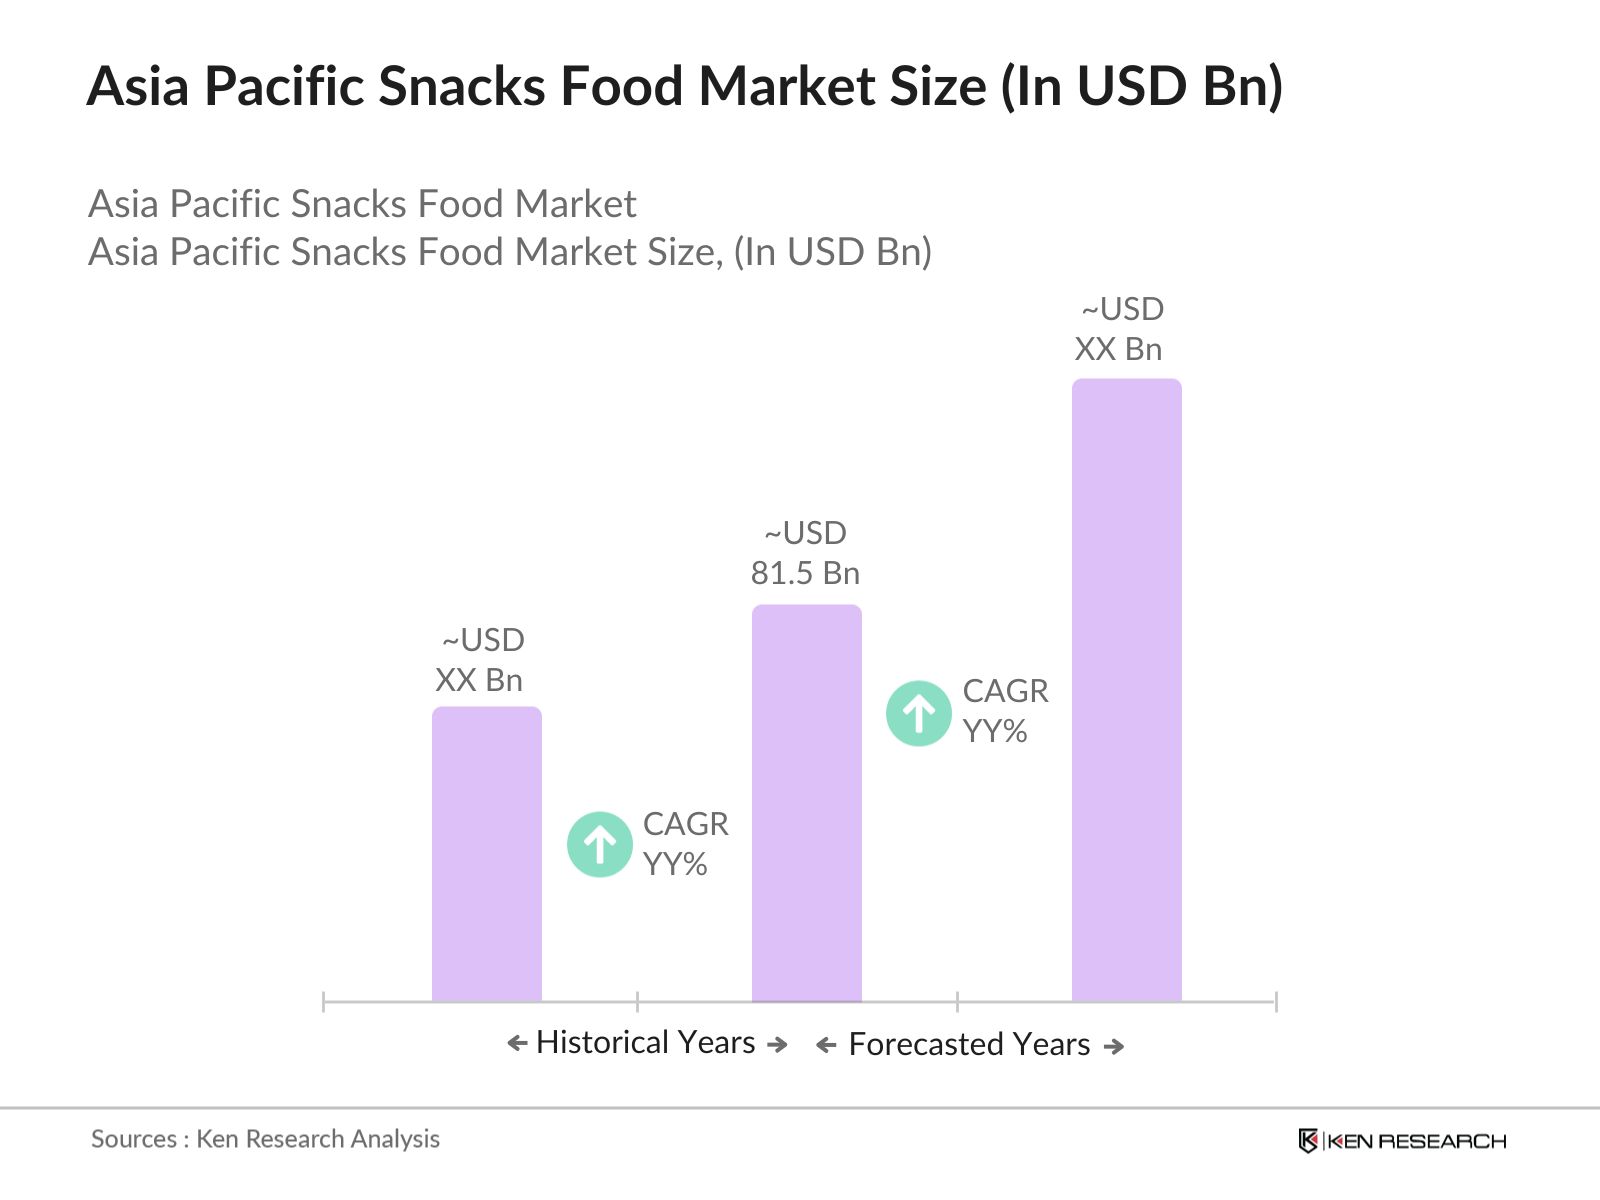
Over the next five years, the Asia Pacific snacks food market is expected to experience growth driven by evolving consumer preferences, technological advancements in food production, and increased demand for convenient, healthy, and sustainable snack options. The markets expansion will be supported by the continuous rise of e-commerce channels, enabling wider product accessibility, as well as investments in product innovation by major companies focusing on healthier and sustainable snack alternatives. Government initiatives promoting healthy diets and sustainable consumption will also contribute to market growth.
|
By Product Type |
Savory Snacks Sweet Snacks Frozen Snacks Healthy Snacks Confectionery Snacks |
|
By Distribution Channel |
Supermarkets and Hypermarkets Convenience Stores E-commerce Specialty Stores |
|
By Ingredient Type |
Plant-based Ingredients Dairy-based Ingredients Meat-based Ingredients Grains and Pulses |
|
By Packaging Type |
Pouches Boxes Flexible Packaging Rigid Packaging |
|
By Region |
China India Japan Australia Southeast Asia |
1.1. Definition and Scope
1.2. Market Taxonomy
1.3. Market Growth Rate
1.4. Market Segmentation Overview
2.1. Historical Market Size
2.2. Year-On-Year Growth Analysis
2.3. Key Market Developments and Milestones
3.1. Growth Drivers
3.1.1. Changing Consumer Preferences (towards healthy snacks, plant-based ingredients)
3.1.2. Increased Disposable Income
3.1.3. Rapid Urbanization
3.1.4. Expanding Retail Channels (e-commerce growth)
3.2. Market Challenges
3.2.1. Stringent Regulatory Environment (food safety standards)
3.2.2. Fluctuating Raw Material Prices (ingredient cost variability)
3.2.3. Supply Chain Disruptions (post-pandemic logistics)
3.3. Opportunities
3.3.1. Rise in Health-Conscious Consumers (demand for functional snacks)
3.3.2. Expansion into Emerging Markets (growth in Southeast Asia)
3.3.3. Development of Innovative Products (organic, low-calorie snacks)
3.4. Trends
3.4.1. Adoption of Sustainable Packaging (eco-friendly materials)
3.4.2. Growth in Plant-Based Snacks (vegan-friendly options)
3.4.3. Popularity of Convenient, On-the-Go Snacks
3.5. Government Regulations
3.5.1. Food Labeling Standards (nutrition information requirements)
3.5.2. Import-Export Regulations (regional trade agreements)
3.5.3. Health and Safety Regulations (contaminant control)
3.6. SWOT Analysis
3.7. Stake Ecosystem
3.8. Porters Five Forces
3.9. Competitive Landscape
4.1. By Product Type (In Value %)
4.1.1. Savory Snacks
4.1.2. Sweet Snacks
4.1.3. Frozen Snacks
4.1.4. Healthy Snacks
4.1.5. Confectionery Snacks
4.2. By Distribution Channel (In Value %)
4.2.1. Supermarkets and Hypermarkets
4.2.2. Convenience Stores
4.2.3. E-commerce
4.2.4. Specialty Stores
4.3. By Ingredient Type (In Value %)
4.3.1. Plant-based Ingredients
4.3.2. Dairy-based Ingredients
4.3.3. Meat-based Ingredients
4.3.4. Grains and Pulses
4.4. By Packaging Type (In Value %)
4.4.1. Pouches
4.4.2. Boxes
4.4.3. Flexible Packaging
4.4.4. Rigid Packaging
4.5. By Region (In Value %)
4.5.1. China
4.5.2. India
4.5.3. Japan
4.5.4. Australia
4.5.5. Southeast Asia
5.1. Detailed Profiles of Major Companies
5.1.1. PepsiCo
5.1.2. Mondelez International
5.1.3. The Kellogg Company
5.1.4. Calbee Inc.
5.1.5. Meiji Holdings Co., Ltd.
5.1.6. Nestl S.A.
5.1.7. Suntory Beverage & Food Limited
5.1.8. General Mills
5.1.9. Orion Corp.
5.1.10. Lotte Corporation
5.1.11. Tata Consumer Products
5.1.12. Kameda Seika Co., Ltd.
5.1.13. Britannia Industries Limited
5.1.14. Want Want China Holdings Limited
5.1.15. Nongshim Co., Ltd.
5.2. Cross Comparison Parameters (Market Share %, Revenue, Product Range, Innovation Index, Sustainability Initiatives, Distribution Network, Market Penetration, Pricing Strategy)
5.3. Market Share Analysis
5.4. Strategic Initiatives
5.5. Mergers and Acquisitions
5.6. Investment Analysis
5.7. Venture Capital Funding
5.8. Private Equity Investments
6.1. Regional Trade and Tariff Regulations
6.2. Health and Safety Certifications
6.3. Packaging and Labeling Requirements
7.1. Future Market Size Projections
7.2. Key Factors Driving Future Market Growth
8.1. By Product Type (In Value %)
8.2. By Distribution Channel (In Value %)
8.3. By Ingredient Type (In Value %)
8.4. By Packaging Type (In Value %)
8.5. By Region (In Value %)
9.1. TAM/SAM/SOM Analysis
9.2. Product Portfolio Optimization
9.3. Regional Market Expansion Strategies
9.4. Emerging Consumer Trends and Preferences
The first step in this research involves constructing a comprehensive ecosystem map of stakeholders in the Asia Pacific Snacks Food Market. We conducted desk research using proprietary and secondary databases to gather key industry data. The goal was to identify major variables affecting the market, such as consumer preferences, ingredient sourcing, and regulatory influences.
This phase involved collecting and analysing historical data to assess market penetration and the performance of different product segments. We reviewed the ratio of snack manufacturers to distributors and evaluated revenue generation and service quality metrics to ensure data reliability and accuracy.
We developed market hypotheses, which were validated through structured interviews with industry experts, including product managers from leading snack brands. Their insights helped refine the market estimates and offered practical insights into operational and financial dynamics in the industry.
In the final step, we engaged directly with key snack manufacturers to obtain detailed insights into product performance, consumer behaviour, and sales data. This information was used to verify the market data and enhance the accuracy of our bottom-up analysis for the Asia Pacific Snacks Food Market.
The Asia Pacific Snacks Food Market is valued at USD 81.5 billion, driven by increasing demand for healthy and convenient snacks and growth in e-commerce platforms across the region.
Challenges in the Asia Pacific Snacks Food Market include fluctuating raw material prices, particularly for key ingredients like nuts and grains, along with stringent regulatory requirements for food safety and labelling across various countries in the region.
The Asia Pacific Snacks Food market is dominated by global giants like PepsiCo, Mondelez International, and Nestl S.A., alongside local powerhouses such as Calbee Inc. and Britannia Industries Limited, all of which have brand loyalty and extensive product portfolios.
Key growth drivers Asia Pacific Snacks Food market include the rise in health-conscious consumers seeking nutritious and plant-based snacks, the expansion of retail and e-commerce channels, and increasing urbanization across major countries like China, India, and Japan.
 Framework")
What makes us stand out is that our consultants follows Robust, Refine and Result (RRR) methodology. i.e. Robust for clear definitions, approaches and sanity checking, Refine for differentiating respondents facts and opinions and Result for presenting data with story

We have set a benchmark in the industry by offering our clients with syndicated and customized market research reports featuring coverage of entire market as well as meticulous research and analyst insights.

While we don't replace traditional research, we flip the method upside down. Our dual approach of Top Bottom & Bottom Top ensures quality deliverable by not just verifying company fundamentals but also looking at the sector and macroeconomic factors.

With one step in the future, our research team constantly tries to show you the bigger picture. We help with some of the tough questions you may encounter along the way: How is the industry positioned? Best marketing channel? KPI's of competitors? By aligning every element, we help maximize success.

Our report gives you instant access to the answers and sources that other companies might choose to hide. We elaborate each steps of research methodology we have used and showcase you the sample size to earn your trust.

If you need any support, we are here! We pride ourselves on universe strength, data quality, and quick, friendly, and professional service.