


Asia Pacific Streaming Analytics Market Overview to 2030
Region:Asia
Author(s):Yogita Sahu
Product Code:KROD1537
October 2024
99
About the Report
Asia Pacific Streaming Analytics Market Overview
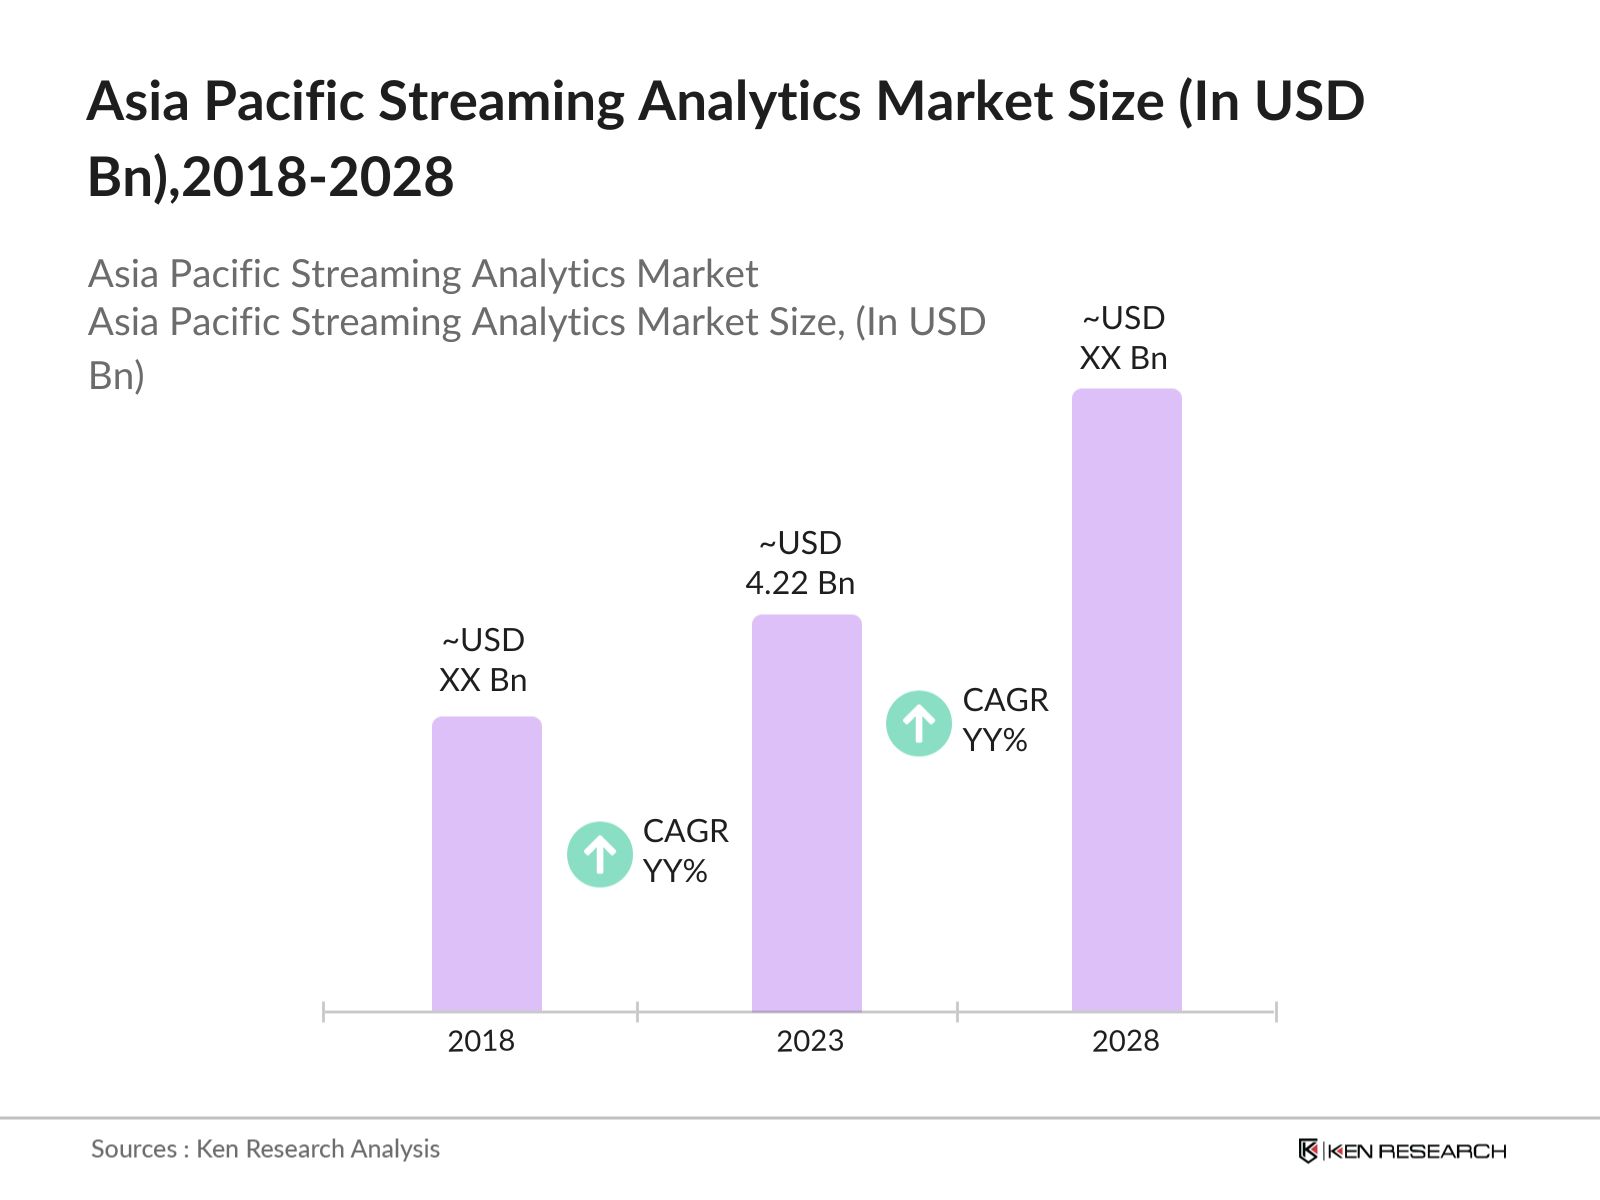
- The Asia Pacific Streaming Analytics Market size was valued at USD 4.22 billion in 2023. The growth is primarily driven by the surge in big data generation, the adoption of IoT, and the increasing need for advanced data analytics to derive actionable insights in real-time.
- Key players in this market include IBM Corporation, Microsoft Corporation, Oracle Corporation, SAP SE, and Software AG. These companies have established a strong presence in the region by offering innovative solutions, strategic partnerships, and acquisitions to enhance their streaming analytics capabilities.
- Oracle Corporation is expanding its presence in the Asia Pacific Streaming Analytics Market through its Oracle Stream Analytics platform, which enables real-time data processing and analysis. This initiative aims to enhance business agility and operational insights, aligning with the growing demand for advanced analytics solutions in the region.
- China dominates the market with its massive population, the proliferation of smart cities, and the government's strong support for digital transformation initiatives. Cities like Shanghai and Beijing are leading the charge with large-scale implementations of real-time analytics in sectors such as transportation, healthcare, and public safety.
Asia Pacific Streaming Analytics Market Segmentation
The market can be segmented into various factors like deployment, industry vertical, and region.
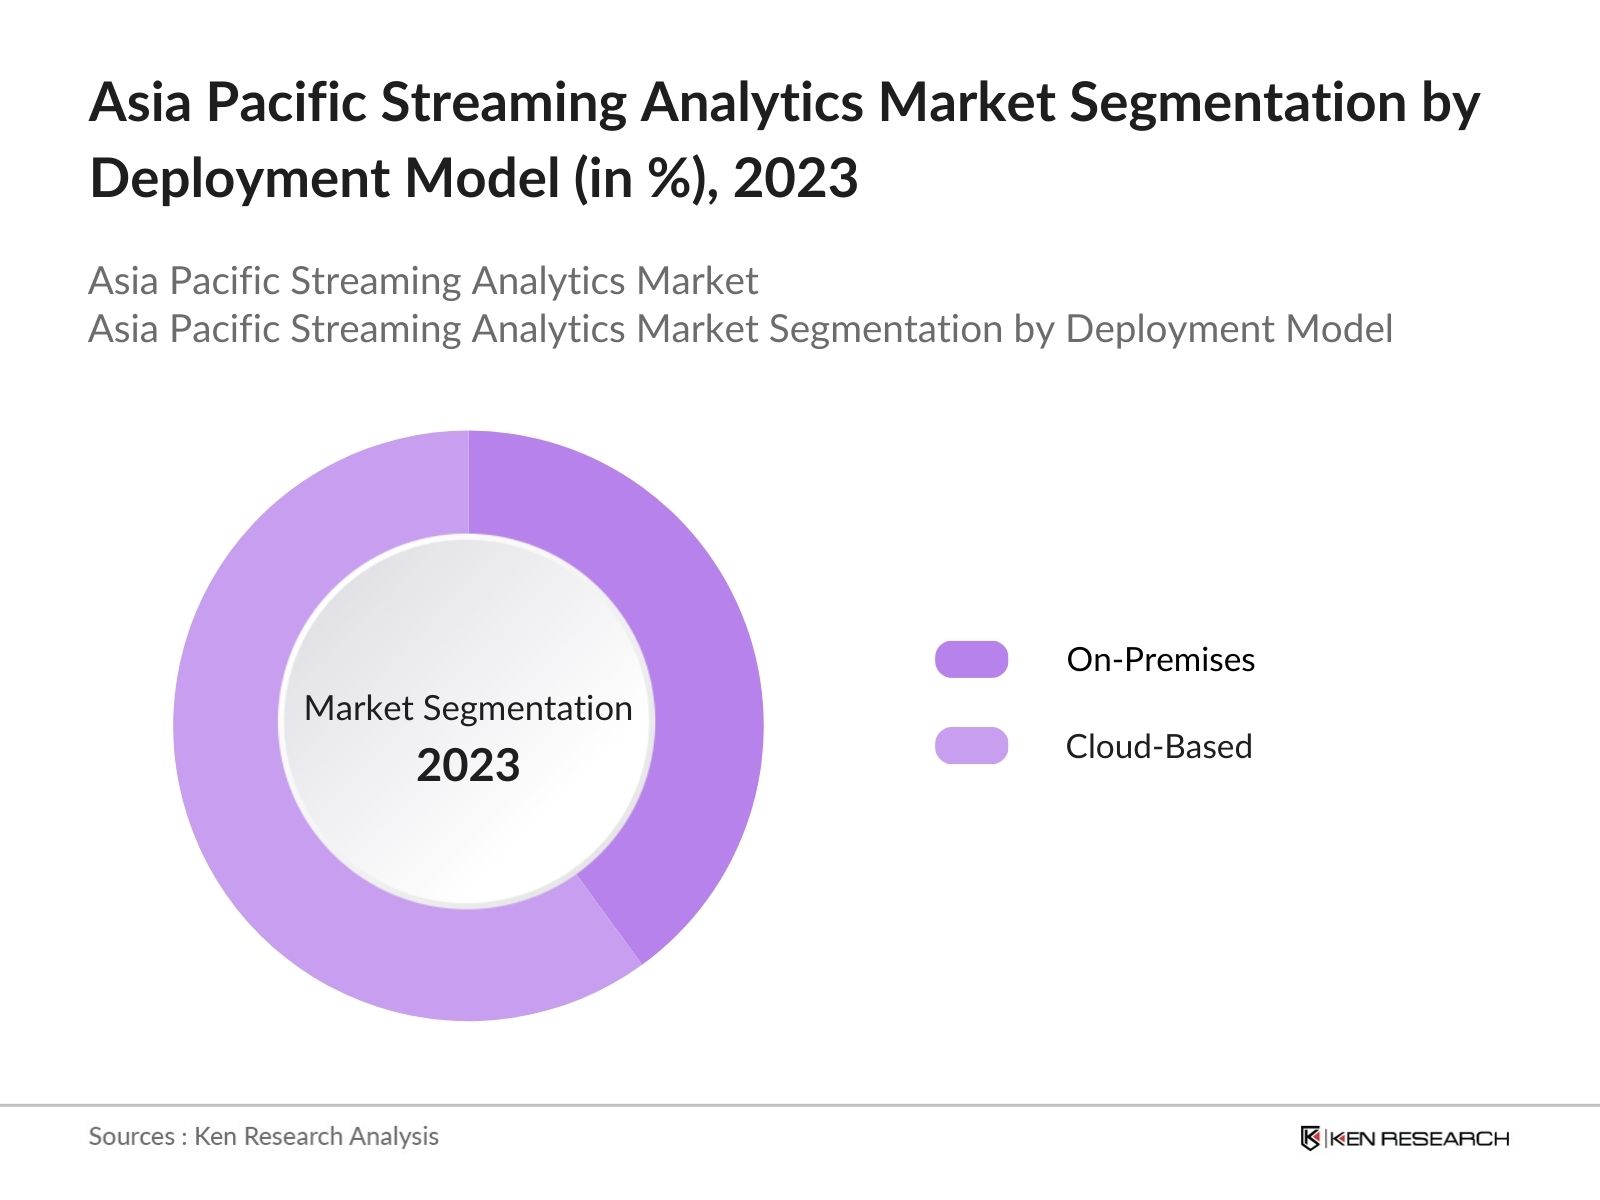
By Deployment: The market is segmented by deployment into on-premise and cloud-based. In 2023, the Cloud-Based segment held a dominant market share by the growing preference for cloud-based solutions due to their scalability, cost-effectiveness, and ease of deployment.
By Region: The market is segmented by region into China, South Korea, Japan, India, Australia, and the Rest of APAC. In 2023, China led the market with its rapid technological advancements, extensive digital infrastructure. Japan and South Korea's market shares are driven by their advanced economies, high internet penetration, and significant investments in IoT and smart city projects.
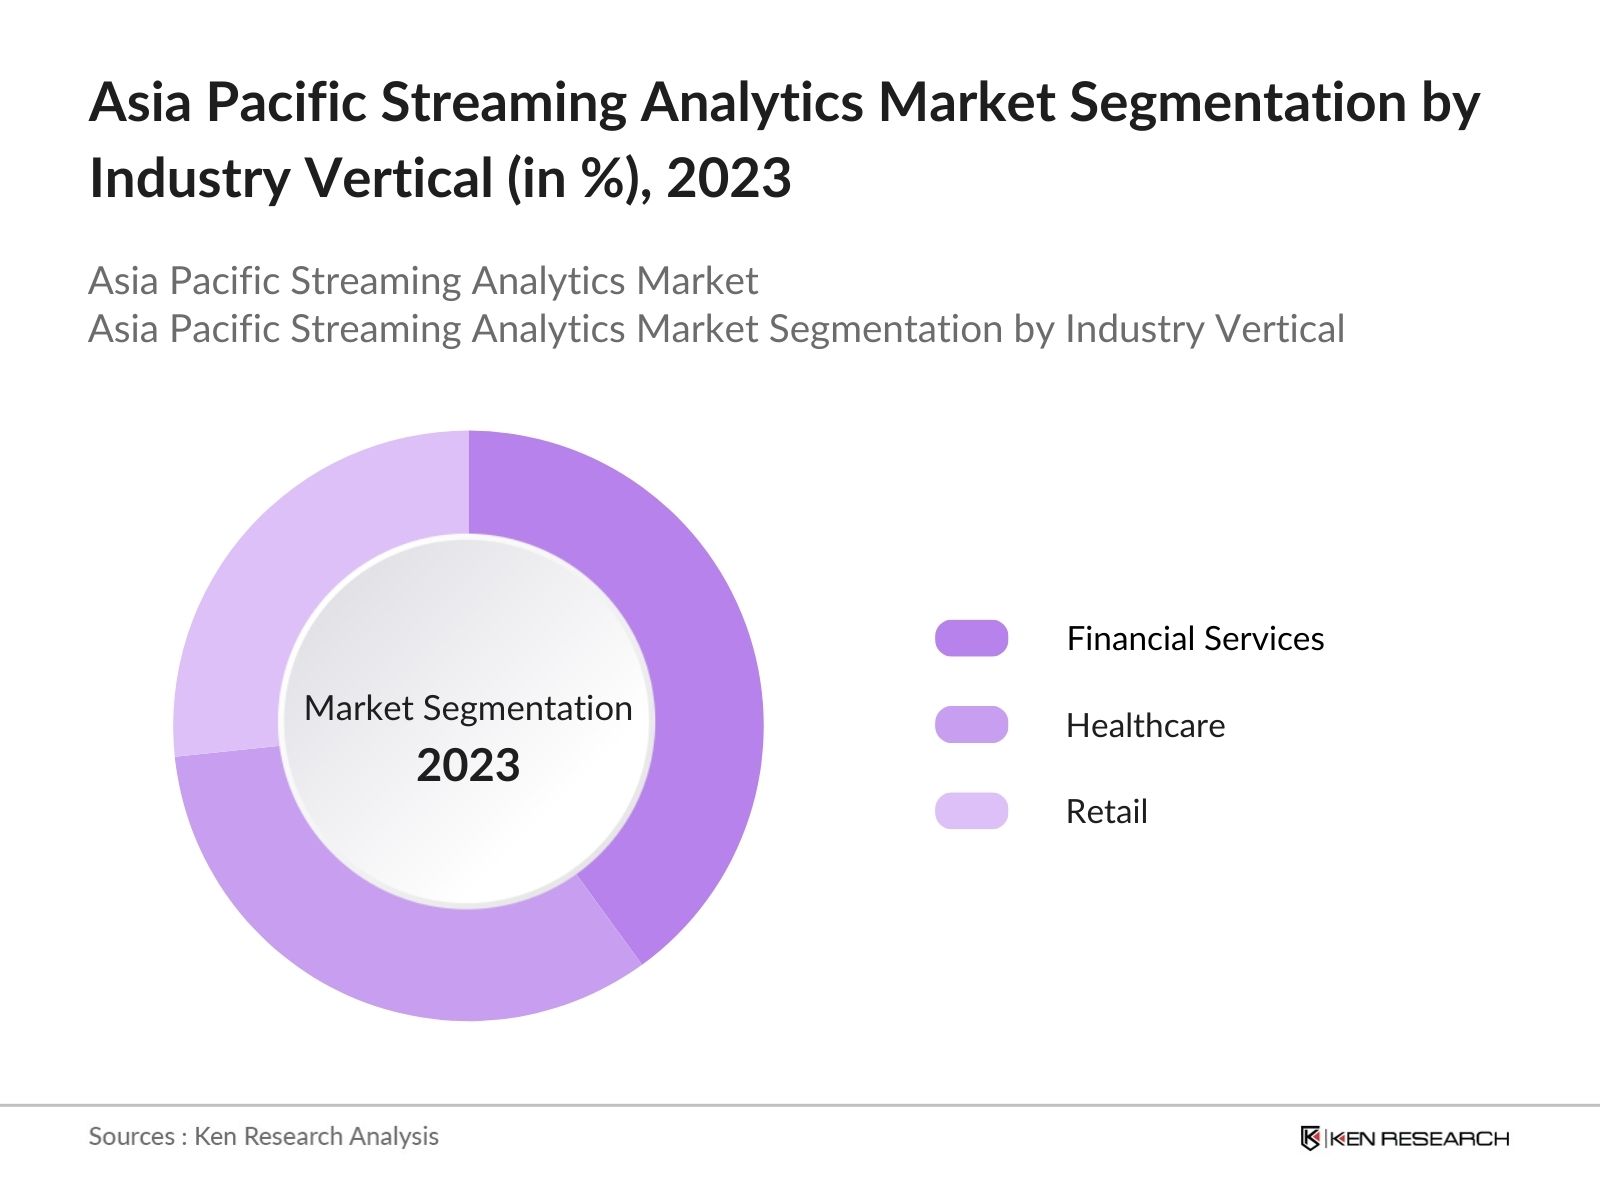
By Industry Vertical: The market is segmented by industry vertical into finance, healthcare, retail, and manufacturing. In 2023, the Finance segment dominated the market by the increasing adoption of real-time analytics for risk management, fraud detection, and algorithmic trading.
Asia Pacific Streaming Analytics Market Competitive Landscape
|
Company Name |
Establishment Year |
Headquarters |
|
IBM Corporation |
1911 |
Armonk, New York, USA |
|
Microsoft Corporation |
1975 |
Redmond, Washington, USA |
|
Oracle Corporation |
1977 |
Redwood City, California, USA |
|
SAP SE |
1972 |
Walldorf, Germany |
|
Software AG |
1969 |
Darmstadt, Germany |
- Oracle Corporation: In 2024, Oracle Corporation announced the expansion of its Oracle Stream Analytics service in the Asia Pacific region.The company launched its second cloud region in Singapore in 2022, followed by a third data center in August of that year.In June 2024, Oracle completed another expansion of its cloud region in Singapore.
- SAP SE: In 2023, SAP SE announced a strategic partnership with Alibaba Cloud to enhance its streaming analytics capabilities in the Asia Pacific region. This partnership aims to integrate SAP's advanced analytics solutions with Alibaba Cloud's robust infrastructure, enabling businesses to leverage real-time data processing and analytics at scale.
Asia Pacific Streaming Analytics Market Analysis
Market Growth Drivers
- Adoption of Real-Time Analytics in Financial Services: The financial services industry in the Asia Pacific region is increasingly relying on real-time analytics to enhance operational efficiency, detect fraudulent activities, and improve customer service. In 2024, the region's banking sector processed over 500 million real-time transactions daily, up from 450 million in 2023, driven by the growing use of digital payment platforms and mobile banking.
- Surge in IoT Device Connectivity: The proliferation of IoT devices across industries such as manufacturing, healthcare, and smart cities is a key growth driver for the streaming analytics market in Asia Pacific. In 2024, the number of connected IoT devices in the region exceeded 10 billion, generating an immense amount of data that requires real-time analysis for actionable insights. Industries are leveraging streaming analytics to process this data, enabling predictive maintenance, real-time monitoring, and optimization of operations.
- Increased Investment in AI and Machine Learning: The Asia Pacific streaming analytics market is set to benefit from the region's AI spending surge, projected to reach USD 78 billion by 2027. This increased investment, particularly in AI infrastructure and generative AI technologies, will drive the adoption of advanced real-time data processing solutions across industries, enhancing operational efficiency and customer engagement.
Market challenges
- Data Privacy and Security Concerns: As the adoption of streaming analytics grows in the Asia Pacific region, data privacy and security concerns are becoming more pronounced. In 2024, over 1,000 data breaches were reported across various industries, compromising sensitive information and leading to significant financial losses. The increasing volume of real-time data being processed by analytics platforms has made them a target for cyberattacks.
- Shortage of Skilled Analytics Professionals: The Asia Pacific streaming analytics market is facing a significant challenge due to the shortage of skilled professionals capable of managing and analyzing real-time data. In 2024, the region had a shortfall of over 600,000 data scientists and analytics experts, leading to a talent crunch that has hindered the widespread adoption of streaming analytics solutions.
Government Initiatives
- Australia's Smart Cities Program: The Smart Cities and Suburbs Program aims to enhance the liveability, productivity, and sustainability of urban areas in Australia. It provides grants ranging from USD 250,000 to USD 5 million to local governments for innovative technology-based solutions to urban challenges. The program aims to enhance the management of traffic, energy, and public safety through real-time data analysis, improving the quality of life in urban areas.
- Singapore's Digital Government Blueprint: In 2024, Singapores government continued to implement its Digital Government Blueprint, with a focus on enhancing the use of data and analytics in public services. The initiative, emphasizes the integration of streaming analytics to improve the efficiency and responsiveness of government operations. The blueprint aims to make Singapore a leader in digital governance, and the adoption of real-time analytics is a critical component of this strategy.
Asia Pacific Streaming Analytics Market Future Outlook
The future trends in the market include the widespread adoption of 5G-enabled streaming analytics, the growth of edge analytics, the integration of AI and ML with streaming analytics, and the expansion of smart city initiatives across the region.
Future Market Trends
- Widespread Adoption of 5G-Enabled Streaming Analytics: Over the next five years, the deployment of 5G networks across the Asia Pacific region will revolutionize the streaming analytics market. By 2028, it is estimated that over 2 billion 5G connections will be active in the region, providing the low latency and high-speed data transmission required for real-time analytics.
- Growth of Edge Analytics in Streaming Solutions: The future of the streaming analytics market in Asia Pacific will be increasingly dominated by edge analytics, where data processing occurs at the edge of the network, close to the source of data generation. By 2028, it is projected that over 50% of all streaming analytics deployments in the region will incorporate edge computing, enabling faster and more efficient data processing.
Scope of the Report
|
By Industry Vertical |
Financial Services Healthcare Retail |
|
By Deployment Model |
On-Premises Cloud-Based |
|
By Type |
Software Services |
|
By Region |
China South Korea Japan India Australia Rest of APAC |
Products
Key Target Audience Organizations and Entities Who Can Benefit by Subscribing This Report:
- Banks and Financial Institutions
- Telecommunications Companies
- Manufacturing Companies
- Government Regulatory Bodies (specifically those involved in digital transformation and smart city initiatives)
- Cybersecurity Firms
- Utility Companies
- Media and Entertainment Firms
- Logistics and Supply Chain Companies
Companies
Players Mentioned in the Report:
- IBM Corporation
- Microsoft Corporation
- SAP SE
- Oracle Corporation
- TIBCO Software Inc.
- Alibaba Cloud
- Google Cloud
- Amazon Web Services (AWS)
- Cisco Systems, Inc.
- Splunk Inc.
- SAS Institute Inc.
- Informatica
- Software AG
- Cloudera, Inc.
- Databricks
Table of Contents
1. Asia Pacific Streaming Analytics Market Overview
1.1. Definition and Scope
1.2. Market Taxonomy
1.3. Market Growth Rate
1.4. Market Segmentation Overview
2. Asia Pacific Streaming Analytics Market Size (in USD Bn), 2018-2023
2.1. Historical Market Size
2.2. Year-on-Year Growth Analysis
2.3. Key Market Developments and Milestones
3. Asia Pacific Streaming Analytics Market Analysis
3.1. Growth Drivers
3.1.1. Adoption in Financial Services
3.1.2. IoT Device Connectivity
3.1.3. AI and ML Integration
3.1.4. Government Initiatives
3.2. Restraints
3.2.1. Data Privacy Concerns
3.2.2. High Implementation Costs
3.2.3. Skills Gap
3.2.4. Legacy System Integration
3.3. Opportunities
3.3.1. Edge Computing Growth
3.3.2. Smart City Projects
3.3.3. 5G Network Deployment
3.3.4. Expansion in Emerging Markets
3.4. Trends
3.4.1. AI-Powered Analytics
3.4.2. Increased Cloud Adoption
3.4.3. Real-Time Customer Insights
3.4.4. Predictive Maintenance Adoption
3.5. Government Regulation
3.5.1. Data Protection Laws
3.5.2. Digital Economy Policies
3.5.3. AI and Analytics Support Programs
3.5.4. Public-Private Partnerships
3.6. SWOT Analysis
3.7. Stake Ecosystem
3.8. Competition Ecosystem
4. Asia Pacific Streaming Analytics Market Segmentation, 2023
4.1. By Industry Vertical (in Value %)
4.1.1. Financial Services
4.1.2. Healthcare
4.1.3. Retail
4.1.4. Telecommunications
4.1.5. Manufacturing
4.2. By Deployment Model (in Value %)
4.2.1. On-Premises
4.2.2. Cloud-Based
4.3. By Region (in Value %)
4.3.1. China
4.3.2. Japan
4.3.3. India
4.3.4. South Korea
4.3.5. Australia
4.3.6. Rest of APAC
4.4. By Type (in Value %)
4.4.1. Software
4.4.2. Services
5. Asia Pacific Streaming Analytics Market Cross Comparison
5.1. Detailed Profiles of Major Companies
5.1.1. IBM Corporation
5.1.2. Microsoft Corporation
5.1.3. SAP SE
5.1.4. Oracle Corporation
5.1.5. TIBCO Software Inc.
5.2. Cross Comparison Parameters (No. of Employees, Headquarters, Inception Year, Revenue)
6. Asia Pacific Streaming Analytics Market Competitive Landscape
6.1. Market Share Analysis
6.2. Strategic Initiatives
6.3. Mergers and Acquisitions
6.4. Investment Analysis
6.4.1. Venture Capital Funding
6.4.2. Government Grants
6.4.3. Private Equity Investments
7. Asia Pacific Streaming Analytics Market Regulatory Framework
7.1. Data Protection Regulations
7.2. Compliance Requirements
7.3. Certification Processes
8. Asia Pacific Streaming Analytics Market Future Market Size (in USD Bn), 2023-2028
8.1. Future Market Size Projections
8.2. Key Factors Driving Future Market Growth
9. Asia Pacific Streaming Analytics Market Future Market Segmentation, 2028
9.1. By Industry Vertical (in Value %)
9.2. By Deployment Model (in Value %)
9.3. By Type (in Value %)
9.4. By Region (in Value %)
10. Asia Pacific Streaming Analytics Market Analysts Recommendations
10.1. TAM/SAM/SOM Analysis
10.2. Customer Cohort Analysis
10.3. Marketing Initiatives
10.4. White Space Opportunity Analysis
Disclaimer
Contact Us
Research Methodology
Step:1 Identifying Key Variables:
Ecosystem creation for all the major entities and referring to multiple secondary and proprietary databases to perform desk research around market to collate industry level information.
Step:2 Market Building:
Collating statistics on this industry over the years, penetration of marketplaces and service providers ratio to compute revenue generated for Asia Pacific Streaming Analytics industry. We will also review service quality statistics to understand revenue generated which can ensure accuracy behind the data points shared.
Step:3 Validating and Finalizing:
Building market hypothesis and conducting CATIs with industry experts belonging to different companies to validate statistics and seek operational and financial information from company representatives.
Step:4 Research output:
Our team will approach multiple telecommunication companies and understand nature of product segments and sales, consumer preference and other parameters, which will support us validate statistics derived through bottom to top approach from such telecommunication companies.
Frequently Asked Questions
01 How big is the Asia Pacific Streaming Analytics market?
The Asia Pacific streaming analytics market size was valued at USD 4.22 billion in 2023. The market's growth is primarily driven by the increasing adoption of real-time analytics across various industries, including finance, healthcare, and retail.
02 What are the challenges in the Asia Pacific Streaming Analytics market?
The challenges in the Asia Pacific streaming analytics market include data privacy and security concerns, a shortage of skilled professionals, high implementation and operational costs, and integration issues with legacy systems.
03 Who are the major players in the Asia Pacific Streaming Analytics market?
Key players in the Asia pacific streaming analytics market include IBM Corporation, Microsoft Corporation, SAP SE, Oracle Corporation, and TIBCO Software Inc., which lead the market with advanced analytics solutions and significant regional presence.
04 What are the main growth drivers of the Asia Pacific Streaming Analytics market?
The growth of the Asia Pacific streaming analytics market is driven by the increasing adoption of real-time analytics in financial services, the surge in IoT device connectivity, government support for digital transformation initiatives, and rising investments in AI and machine learning technologies.
Why Buy From Us?
 Framework")
What makes us stand out is that our consultants follows Robust, Refine and Result (RRR) methodology. i.e. Robust for clear definitions, approaches and sanity checking, Refine for differentiating respondents facts and opinions and Result for presenting data with story

We have set a benchmark in the industry by offering our clients with syndicated and customized market research reports featuring coverage of entire market as well as meticulous research and analyst insights.

While we don't replace traditional research, we flip the method upside down. Our dual approach of Top Bottom & Bottom Top ensures quality deliverable by not just verifying company fundamentals but also looking at the sector and macroeconomic factors.

With one step in the future, our research team constantly tries to show you the bigger picture. We help with some of the tough questions you may encounter along the way: How is the industry positioned? Best marketing channel? KPI's of competitors? By aligning every element, we help maximize success.

Our report gives you instant access to the answers and sources that other companies might choose to hide. We elaborate each steps of research methodology we have used and showcase you the sample size to earn your trust.

If you need any support, we are here! We pride ourselves on universe strength, data quality, and quick, friendly, and professional service.