CHAPTER 1 - MARKET SUMMARY
Market Overview
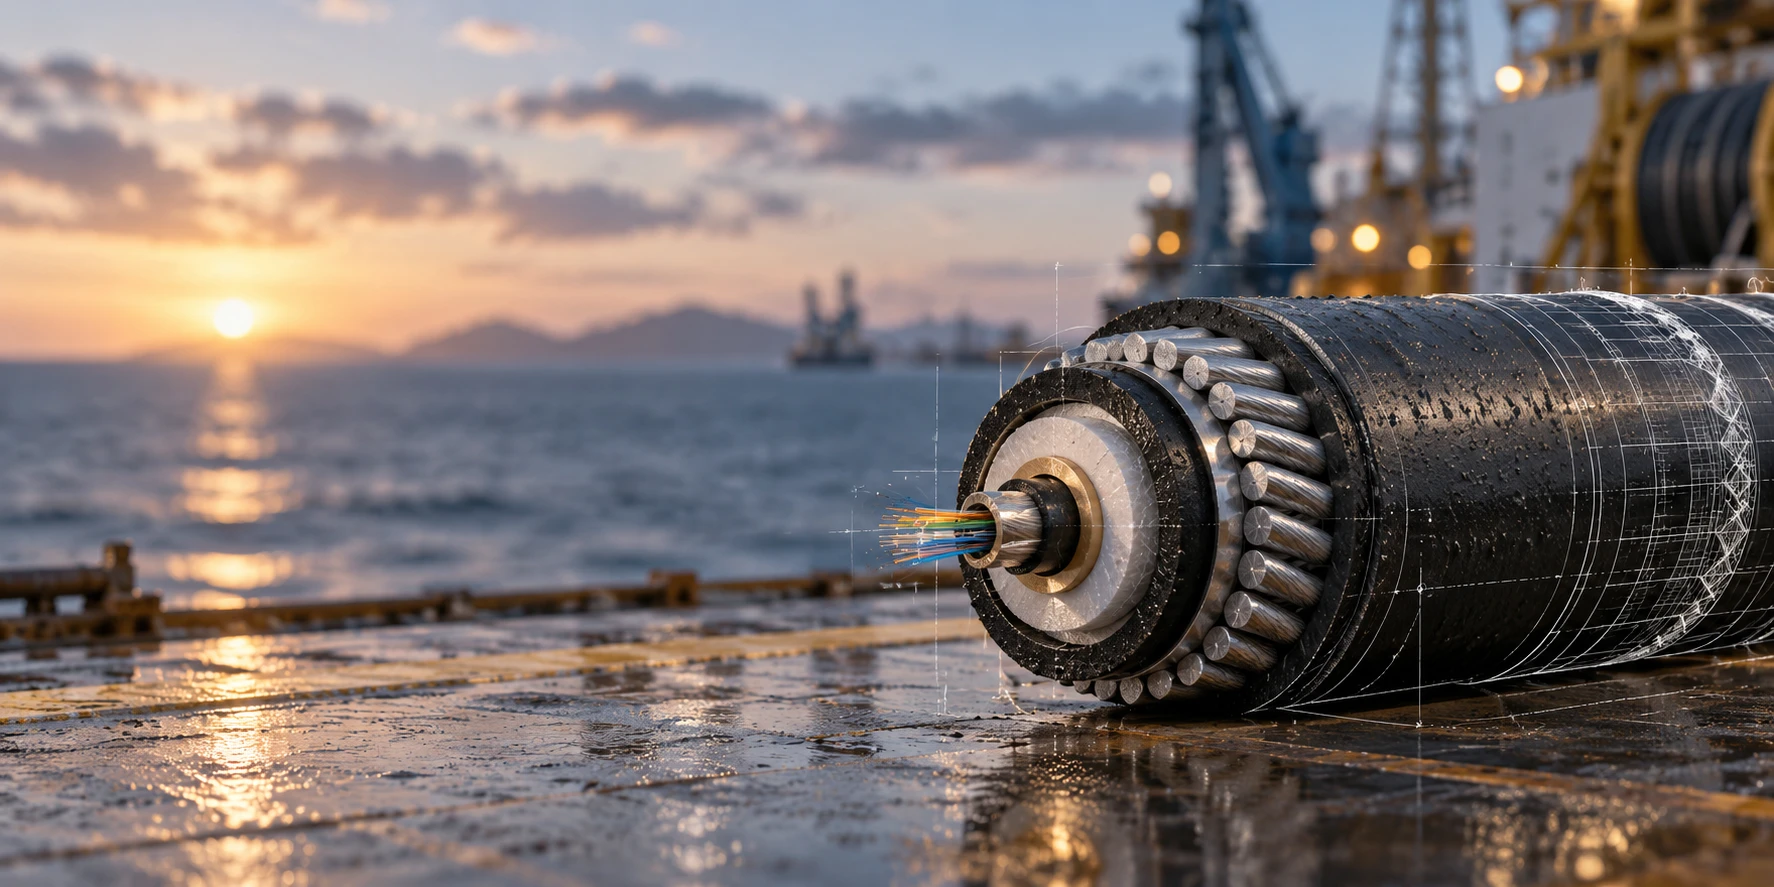
The Asia Pacific Submarine Cables Market combines submarine communication networks, power-transmission cables, marine installation and directly associated system-integration revenues. Commercial demand is structurally anchored by international data connectivity and offshore electricity transmission. Submarine telecommunications cables provide more than 99% of intercontinental connectivity, making route capacity, redundancy and landing access economically critical for carriers, cloud platforms and digital infrastructure investors.
China, Northeast Asia and Southeast Asian landing hubs form the market's principal concentration zones, while Australia and India are gaining strategic weight. China alone held more than half of the broader Asia Pacific submarine-cable benchmark in 2025, while its offshore wind fleet reached 48.4 GW at end-2025. This creates an unusually deep dual demand pool spanning both high-capacity communications and high-voltage subsea electricity transmission.
Market Value
USD 7,548 million
2025
Dominant Region
China and Hong Kong
2025
Dominant Segment
Submarine Power Cables
fastest growing, 2025-2031
Total Number of Players
48
Future Outlook
The Asia Pacific Submarine Cables Market is projected to increase from USD 7,548 million in 2025 to USD 11,595 million by 2031. Historical expansion averaged 7.57% during 2020-2025, supported by new intra-Asia systems, offshore wind construction and capacity additions at cloud and carrier landing hubs. The forecast CAGR moderates slightly to 7.42% during 2026-2031 as larger project pipelines scale from design into manufacturing and marine installation. Volume growth remains the principal value driver, while higher-specification HVDC, high-fiber-count and SDM systems gradually lift realized revenue per installed route-kilometer.
The 2026-2031 outlook is increasingly shaped by route resilience and the convergence of energy and data infrastructure demand. Singapore plans to double submarine cable landing capacity over a ten-year horizon, while India reported data-center capacity rising from 375 MW in 2020 to more than 1,500 MW by 2026. Offshore wind provides a parallel investment engine, with China adding 6.6 GW during 2025. Suppliers controlling cable manufacturing, turnkey engineering and dedicated installation assets should capture a larger share of the incremental profit pool as vessel availability, permitting and repair-response capability become strategic procurement criteria.
7.42%
Forecast CAGR
$11,595 Mn
2030 Projection
Base Year
2025
Historical Period
2020-2025
Forecast Period
2026-2031
Historical CAGR
7.57%
CHAPTER 2 - SCOPE OF REPORT
Scope of the Market
CHAPTER 3 - Key Stakeholders
Key Target Audience
Key stakeholders who can leverage from this market analysis for investment, strategy, and operational planning.
Investors
CAGR, backlog, capex intensity, vessel utilization, margins, risk
Corporates
capacity procurement, route diversity, landing access, supplier concentration, pricing
Government
resilience, landing permits, security, redundancy, digital sovereignty, interconnectivity
Operators
fiber pairs, route-km, repair time, utilization, latency, availability
Financial institutions
project finance, backlog visibility, counterparty quality, capex, covenants, returns
CHAPTER 4 - Market Size & Growth
Market Size, Growth Forecast and Trends
This section evaluates the historical market size, analyzes year-over-year growth dynamics, and presents forecast projections supported by market performance indicators and demand-side drivers.
Historical & Projected Market Size ($ Million)
Year-over-Year Growth Rate (%)
Market Value vs Volume Growth (%)
Historical Market Performance (2020-2025)
Historical performance accelerated after 2022 as postponed marine projects progressed, hyperscalers increased direct network investment and offshore wind construction absorbed additional power-cable capacity. Annual market growth strengthened from 5.50% in 2021 to a historical peak of 9.00% in 2024 before normalizing to 8.20% in 2025. Modeled installed cable volume increased from 24.0 thousand route-km equivalents in 2020 to 33.7 thousand in 2025, indicating that the majority of historical value expansion was driven by physical deployment rather than price escalation.
Forecast Market Outlook (2026-2031)
Forecast growth remains above 7% through most of the period, with value expansion supported by new greenfield systems, higher fiber-pair counts, HVDC projects and installation complexity. Modeled annual installed volume rises from 35.9 thousand route-km equivalents in 2026 to 48.9 thousand in 2031, a 6.40% volume CAGR from the base year. The difference between volume and value growth reflects gradual specification-led pricing uplift, while terminal-year growth moderates to 7.00% as a larger installed base and project phasing reduce percentage expansion.
CHAPTER 5 - Market Data
Market Breakdown
The Asia Pacific Submarine Cables Market is shifting toward larger-capacity communication systems and higher-value offshore power links. For CEOs and investors, the core issue is increasingly not demand visibility but manufacturing slots, marine execution capability and access to resilient landing corridors.
Year | Market Size (USD Mn) | YoY Growth (%) | Annual Installed Cable Volume (000 km) | Average Revenue per Installed km (USD 000/km) | Power Cable Revenue Share (%) | Period |
|---|---|---|---|---|---|---|
| 2020 | $5,240 Mn | +- | 24.0 | 218 | Forecast | |
| 2021 | $5,528 Mn | +5.50% | 25.1 | 220 | Forecast | |
| 2022 | $5,904 Mn | +6.80% | 26.8 | 220 | Forecast | |
| 2023 | $6,400 Mn | +8.40% | 28.9 | 221 | Forecast | |
| 2024 | $6,976 Mn | +9.00% | 31.3 | 223 | Forecast | |
| 2025 | $7,548 Mn | +8.20% | 33.7 | 224 | Forecast | |
| 2026 | $8,137 Mn | +7.80% | 35.9 | 227 | Forecast | |
| 2027 | $8,755 Mn | +7.59% | 38.2 | 229 | Forecast | |
| 2028 | $9,412 Mn | +7.50% | 40.7 | 231 | Forecast | |
| 2029 | $10,108 Mn | +7.39% | 43.3 | 233 | Forecast | |
| 2030 | $10,836 Mn | +7.20% | 46.0 | 236 | Forecast | |
| 2031 | $11,595 Mn | +7.00% | 48.9 | 237 | Forecast |
Annual Installed Cable Volume
35.9 thousand km equivalent (2026, Asia Pacific). Physical deployment remains the principal growth engine. SJC2 alone added an approximately 10,500 km high-capacity Asian optical system capable of more than 126 Tbps.
Average Revenue per Installed km
USD 227 thousand/km (2026, Asia Pacific). Higher-value engineering and cable specifications lift unit economics. Australia's SMAP system uses 16 fiber pairs and provides more than 400 Tbps of capacity across approximately 5,000 km.
Power Cable Revenue Share
61.3% (2026, Asia Pacific). Offshore power projects are structurally increasing cable intensity. China commissioned 6.6 GW of offshore wind during 2025 and reached 48.4 GW cumulative capacity.
CHAPTER 6 - Segmentation
Market Segmentation Framework
Comprehensive analysis across key dimensions providing insights into market structure, consumer preferences, and distribution patterns.
No of Segments
7
Dominant Segment
Asset Type
Fastest Growing Segment
Technology
Project Type
Asset Type
End-Use Sector
Ownership Model
Contracting Model
Technology
Geography
Key Segmentation Takeaways
Comprehensive analysis across all extracted segmentation dimensions providing insights into market structure, consumer preferences, and distribution patterns.
Asset Type
Asset economics are dominated by submarine power and communication cable systems because both require specialized manufacturing, route engineering and marine deployment. Submarine Power Cables represent the largest modeled revenue pool, supported by offshore wind export links and grid interconnectors, while communication assets retain strategic importance through hyperscaler investment, carrier consortia and high-capacity intra-Asia routes.
Technology
Technology is the fastest-evolving segmentation dimension as customers move toward high-count fiber-pair systems, space division multiplexing, coherent transmission and higher-voltage power architectures. SDM and High-Fiber-Count Optical Systems are expanding particularly quickly because operators can scale route capacity while controlling power consumption per transmitted bit, improving long-term economics for cloud and AI-driven traffic growth.
CHAPTER 7 - Regional Analysis
Regional Analysis
Asia Pacific is the largest broad regional revenue pool for submarine cables, but country economics are concentrated in China and a smaller group of digitally intensive or offshore-energy markets. China benefits from scale in cable manufacturing and offshore wind, while Japan, South Korea, Australia and India combine route-diversification needs with expanding data infrastructure.
Regional Ranking
1st
Regional Share vs Global (Asia Pacific)
38.7%
Asia Pacific CAGR (2026-2031)
7.42%
Regional Ranking
1st
Regional Share vs Global (Asia Pacific)
38.7%
Asia Pacific CAGR (2026-2031)
7.42%
Regional Analysis (Current Year)
Market Position
China ranks first among major Asia Pacific country markets and represents more than half of the broad regional benchmark, supported by manufacturing scale, telecom infrastructure and offshore wind leadership.
Growth Advantage
India's modeled 10.1% CAGR and Australia's 8.6% outpace mature Japan at 6.4%, reflecting lower starting bases, data-center investment and additional international route requirements.
Competitive Strengths
China's 48.4 GW offshore wind fleet, Australia's regulated protection zones and India's more than 1,500 MW data-center capacity create distinct power, resilience and digital-connectivity demand pools.
CHAPTER 8 - INDUSTRY ANALYSIS
Growth Drivers, Challenges & Opportunities
Comprehensive analysis of key factors shaping the Asia Pacific Submarine Cables Market, including growth catalysts, operational challenges, and emerging opportunities across production, distribution, and consumer segments.
Growth Drivers
AI, Cloud and Data-Center Connectivity Expansion
- India's installed data-center capacity increased from 375 MW (2020, India) to more than four times that level, strengthening business cases for new landing systems and direct cloud connectivity.
- The I-2SEA system is planned at approximately 3,600 km (2029 RFS, India-Southeast Asia), directly linking Indian, Malaysian and Singaporean data-center corridors and creating revenue for system integration, wet plant and marine installation suppliers.
- Singapore intends to enable submarine-cable landings to double within 10 years (policy horizon, Singapore), strengthening its position as an interconnection hub and creating additional landing-station and backhaul investment requirements.
Offshore Wind and Cross-Border Power Connections
- China reached 48.4 GW (2025, China) of cumulative offshore wind capacity, requiring export cables, array systems and grid connections that favor high-voltage cable manufacturers with regional production capability.
- Global offshore wind additions reached 9.3 GW (2025, global), with Asia Pacific accounting for the majority through China and additional commissioning in Taiwan and South Korea, improving addressable demand visibility for cable suppliers.
- The identified global offshore pipeline could add 327 GW (next decade, global), creating long-duration demand for HVDC systems, installation vessels, joints, accessories and maintenance capability beyond individual project cycles.
Route Diversification and Resilience Investment
- The 2025 global submarine-cable map identified 597 systems and 1,712 landings (2025, global), illustrating a progressively denser network in which new routes increasingly compete on diversity and resilience rather than basic connectivity alone.
- Forecast new builds exceed 1,010,000 km (2026-2035, global), expanding the obtainable market for cable, repeaters, terminal equipment, marine survey, installation and lifecycle services.
- The regional Candle system is designed with 24 fiber pairs and approximately 8,000 km (2028 RFS, Intra-Asia), showing how hyperscalers and carriers are adopting larger fiber-count architectures for AI-era capacity and route diversity.
Market Challenges
Complex Permitting and Cross-Border Approval Processes
- International resilience recommendations explicitly prioritize streamlined permitting, customs clearance and repair approvals because regulatory delay can extend outage exposure and increase vessel standby cost across multiple national jurisdictions (2026, global).
- Australia requires licensed carriers to obtain permits for international cable installation in specified waters, adding technical, environmental and consultation requirements before construction can proceed under the Telecommunications Act regime (2025, Australia).
- Sydney protection zones extend approximately 74 km and 55 km offshore (2025, Australia) for northern and southern zones respectively, illustrating the navigational and marine-use constraints that route engineering must incorporate.
Repair-Vessel and Marine Capacity Bottlenecks
- The global network experiences approximately 150-200 telecom cable faults annually (2025-2026, global), requiring continuous access to specialized ships, crews, grapnels, ROVs, splicing systems and port logistics.
- Dragged anchors account for around 60 faults annually (2025, global), while telecom repair costs average roughly GBP 0.5-1.0 million per incident, making rapid mobilization and preventative route management economically material.
- TeleGeography estimates approximately USD 3 billion (long-term requirement, global) is needed to sustain cable-repair ship capability as cable-kilometer deployment expands and legacy vessels age.
Physical Damage, Natural Hazards and Security Exposure
- Fishing and anchoring cause more than 80% of reported cable faults (2026, global), creating recurring repair expenditure and supporting demand for route monitoring, burial and protected corridor management.
- The worldwide submarine telecom network expanded by more than 70% in cable length over a decade (2016-2026, global), increasing the absolute infrastructure base exposed to earthquakes, currents, seabed movement and marine activity.
- The resilience advisory body includes 42 public and private leaders and experts (2024-2026, global), reflecting the increasing strategic-security relevance of route redundancy, faster repair and diversified landing locations.
Market Opportunities
High-Fiber-Count and SDM Network Upgrades
- Higher fiber counts create monetizable opportunities in wet plant, branching units, repeaters, terminal equipment and upgrade services because each system supports a larger long-term capacity inventory across multi-decade asset lives (2026-2031, Asia Pacific).
- Manufacturers and system integrators benefit as SJC2 demonstrates more than 126 Tbps design capability (2025, Asia), increasing the value of coherent optics, power-efficient transmission and scalable terminal architectures.
- Commercial realization requires operators to secure landing rights, spectrum engineering and interoperable terminal systems for deployments spanning approximately 8,000-10,500 km (2025-2028, Intra-Asia examples).
Lifecycle Maintenance, Monitoring and Resilience Services
- Marine operators can monetize multi-year maintenance-zone agreements, vessel standby and fault response as global cable length reached roughly 1.7 million km (2025, global telecom network).
- Cable owners benefit from improved uptime and lower disruption risk because accidental human activity causes approximately 70-80% of faults (2025, global), making preventative monitoring and burial economically actionable.
- Scaling the opportunity requires more repair capacity as approximately two-thirds of maintenance ships (by 2040, global) approach end-of-life, strengthening the investment case for new vessels and specialized marine-service platforms.
Next-Generation India, Southeast Asia and Pacific Routes
- Investors can target direct routes between data-center clusters as SCNX3 is designed to serve markets representing approximately 1.85 billion people (2026 project context, India-Southeast Asia).
- Pacific island economies benefit from second-route redundancy, exemplified by Vanuatu's planned second submarine cable (2026, Vanuatu), which can reduce single-route dependency and improve digital-service continuity.
- Future systems can add environmental-monitoring revenue and public-sector funding pathways because the Vanuatu project will use SMART technology (2026, Vanuatu) for ocean, sea-level and seismic monitoring alongside telecommunications.
CHAPTER 9 - Competitive Landscape
Competitive Landscape Overview
Competition is concentrated around a limited group of integrated cable manufacturers, turnkey system suppliers and marine installers, while high capex, qualification requirements, vessel access and project references create substantial barriers to entry.
Market Share Distribution
Top 5 Players
Market Dynamics
8 new entrants in the past 5 years, indicating strong market attractiveness and growth potential.
Company Name | Market Share | Headquarters | Founding Year | Core Market Focus |
|---|---|---|---|---|
NEC Corporation | - | Tokyo, Japan | 1899 | Turnkey optical submarine cable systems, repeaters, route engineering and marine installation |
Prysmian | - | Milan, Italy | 2005 | Submarine power cables, HVDC systems, telecom cables and marine installation |
Nexans | - | Paris, France | 2000 | High-voltage submarine power cables, offshore wind and interconnector systems |
SubCom | - | Newington, New Hampshire, United States | 1955 | End-to-end subsea communication systems, manufacturing, installation and maintenance |
HMN Technologies | - | Tianjin, China | 2008 | Turnkey submarine telecommunications networks, system design, manufacturing and marine installation |
Sumitomo Electric Industries | - | Osaka, Japan | 1897 | Power and optical cable technologies, offshore cable manufacturing and communications components |
ZTT Group | - | Nantong, China | 1992 | Marine systems, submarine power cables, optical communications and offshore renewable infrastructure |
LS Cable & System | - | Anyang, South Korea | 1962 | Submarine power cables, HVDC cables, offshore wind and marine cable solutions |
NKT | - | Copenhagen, Denmark | 1891 | High-voltage power cables, HVDC offshore links and turnkey power cable systems |
Taihan Cable & Solution | - | Anyang, South Korea | 1941 | Submarine power cable manufacturing, HVDC technology and cable-laying capability |
Cross Comparison Parameters
The report provides detailed cross-comparison of key players across 10 performance parameters to identify competitive strengths and weaknesses.
Submarine Cable Manufacturing Capacity
Cable-Laying and Installation Capability
Submarine Systems Revenue Growth
Project Backlog Conversion
Analysis Covered
Market Share Analysis:
Assesses relative competitive positioning across addressable regional submarine cable revenues.
Cross Comparison Matrix:
Benchmarks manufacturing, installation, growth and backlog execution across major suppliers.
SWOT Analysis:
Evaluates capabilities, vulnerabilities, expansion options and competitive threats by company.
Pricing Strategy Analysis:
Compares turnkey, supply-only and marine-service pricing structures across projects.
Company Profiles:
Reviews strategic focus, operating footprint, technology capability and market relevance.
CHAPTER 10 - REPORT TOC
Table of Contents
Market Assessment Phase
Supply-side and competitive intelligence covering market sizing, segmentation, competitive dynamics, regulatory landscape, and future forecasts.
Go-To-Market Strategy Phase
15 chapters
Entry strategy evaluation, execution roadmap, partner recommendations, and profitability outlook.
Survey Phase
8 chapters
Demand-side primary research conducted through structured interviews and online surveys with end users across priority metros and Tier 2/3 cities to capture consumption behavior, unmet needs, and purchase drivers.
Complete Report Coverage
201+ detailed sections covering every aspect of the market
143
Assessment Sections
58
Strategy Sections
CHAPTER 11 - Our Approach
Research Methodology
Desk Research
- Submarine project pipeline mapping
- Cable landing system benchmarking
- Offshore wind capacity assessment
- Marine installation economics review
Primary Research
- Subsea network planners interviewed
- Marine operations managers interviewed
- Cable commercial directors interviewed
- Offshore grid managers interviewed
Validation and Triangulation
- 320 respondent evidence checks completed
- Supplier revenue pools reconciled
- Route-kilometer assumptions cross-validated
- Project pipelines maturity-adjusted consistently
CHAPTER 12 - FAQ
FAQs
Still have questions?
Our research team is here to help you find the right solution
CHAPTER 13 - Related Research
Explore Related Reports
Expand your market intelligence with complementary research across regions and adjacent markets.
Regional/Country ReportsRelated market analysis across key regions
Related market analysis across key regions
- Indonesia Submarine Cables Market
- Middle East Submarine Cables Market
- Vietnam Submarine Cables Market
- Thailand Submarine Cables Market
- Malaysia Submarine Cables Market
Adjacent ReportsRelated markets and complementary research
Related markets and complementary research
- Philippines Submarine Power Cables Market
- Egypt Marine Installation Services Market
- Kuwait Data Center Infrastructure Market
- UAE Offshore Wind Energy Market
- Singapore Telecommunication Networks Market
500+
Market Research Reports
50+
Countries Covered
15+
Industry Verticals