


Asia Pacific Sustainable Aviation Fuel (SAF) Market Outlook to 2030
Region:Asia
Author(s):Abhinav kumar
Product Code:KROD7367
December 2024
94
About the Report
Asia Pacific Sustainable Aviation Fuel (SAF) Market Overview
- The Asia Pacific Sustainable Aviation Fuel (SAF) market is valued at USD 380 million, based on a five-year historical analysis. The market is driven by growing government mandates for carbon reduction, airline commitments to reducing their carbon footprint, and increased investments in renewable energy. SAF production has seen significant developments as airlines and aviation companies aim to meet emission targets, resulting in a push for greater SAF adoption.

- Countries such as Japan, Australia, and Singapore dominate the market due to their advanced infrastructure, supportive regulatory frameworks, and strong partnerships between government and private sectors. In Japan and Singapore, significant investments in SAF production have positioned these countries as leaders in SAF development, with Australia following closely behind due to its strong focus on biofuel research and governmental support for sustainable energy.
- Several countries in the Asia Pacific have adopted emission trading systems (ETS) and carbon taxes to encourage the use of SAF. In 2024, South Korea and Japan imposed carbon taxes of up to $50 per ton of CO emissions from aviation, pushing airlines to adopt SAF as a cost-effective alternative. These carbon pricing mechanisms are helping reduce the cost gap between SAF and conventional jet fuels, making SAF more competitive.
Asia Pacific Sustainable Aviation Fuel (SAF) Market Segmentation
By Fuel Type: The Asia Pacific SAF market is segmented by fuel type into Bio-SPK, FT-SPK, HEFA-SPK, and ATJ-SPK. HEFA-SPK dominates this segmentation, holding a significant market share of 65% in 2023. The dominance of HEFA-SPK is attributed to its technological maturity and compatibility with existing jet engines without the need for major modifications. This fuel type is also favored due to its ability to be produced from various feedstocks, including waste oils and fats, which are widely available in the region.

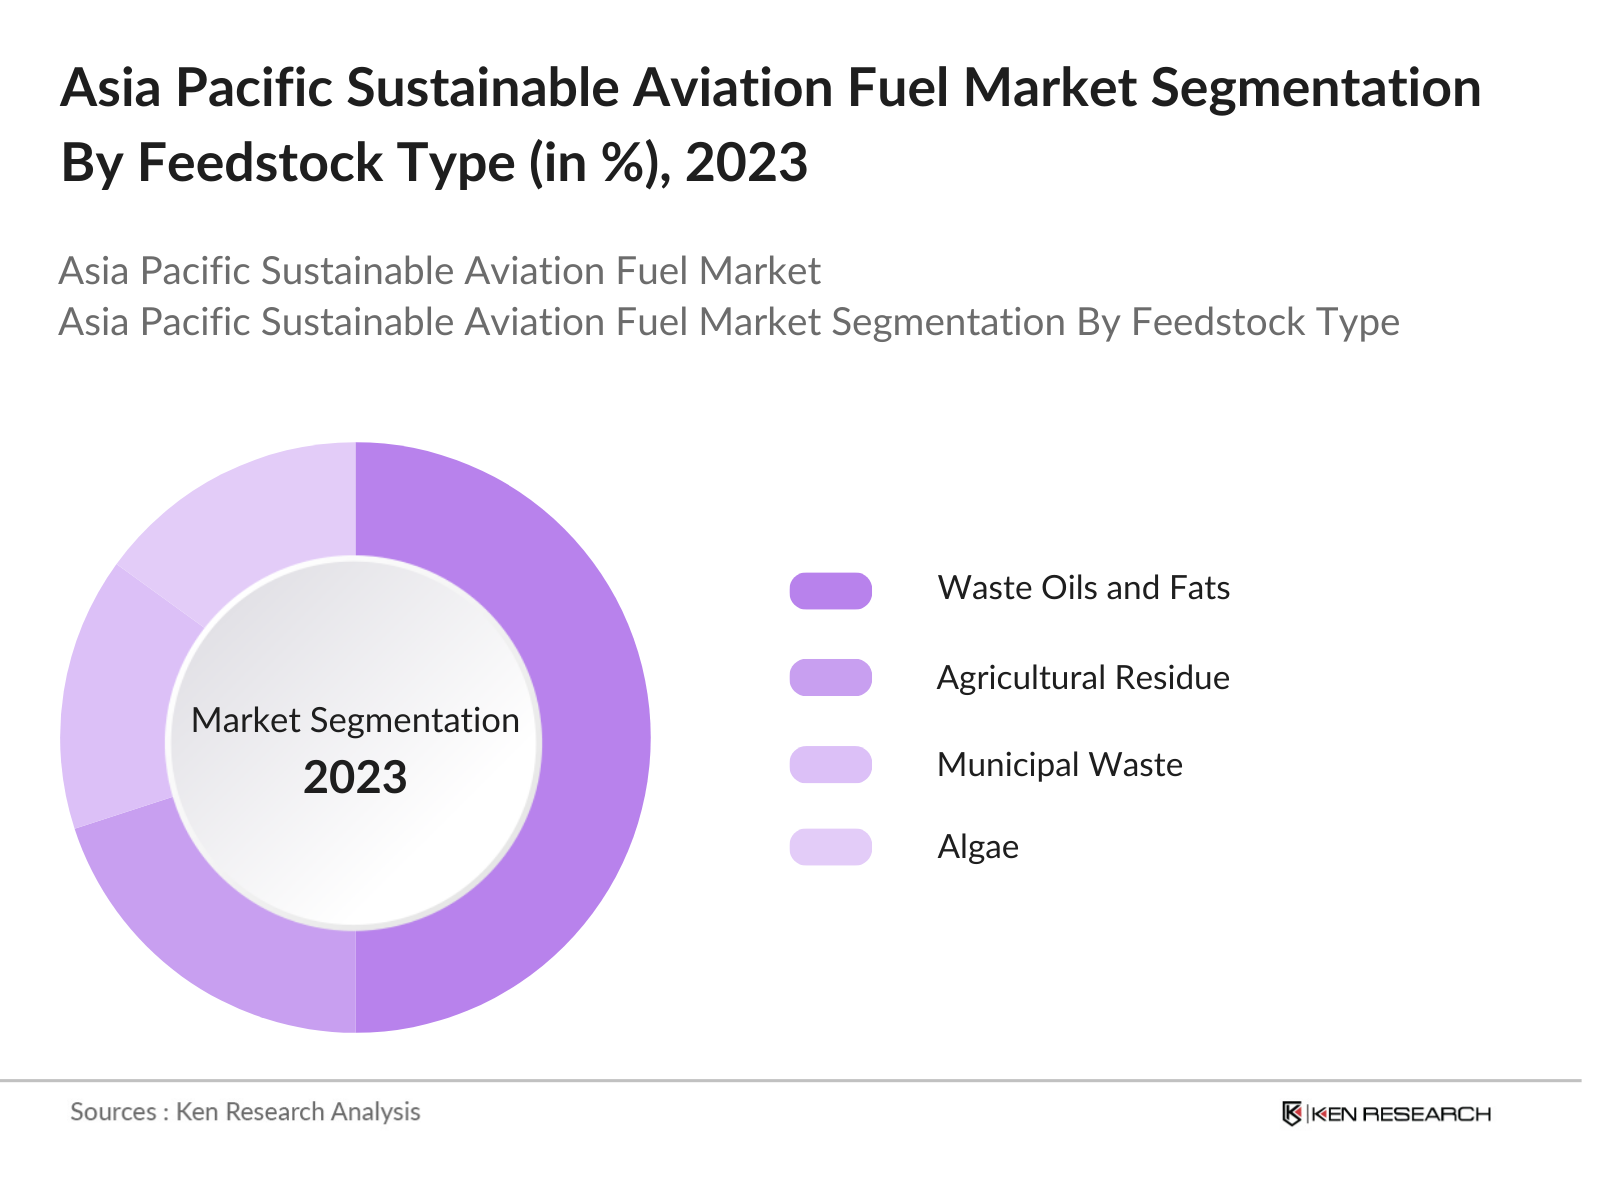
By Feedstock: The SAF market in the region is segmented by feedstock into municipal waste, algae, waste oils and fats, and agricultural residue. Waste oils and fats hold the dominant market share of 50% in 2023. This is because waste oils and fats are easily accessible and cost-effective feedstock options for SAF production, especially in countries like Australia and Singapore, where there is an ample supply of used cooking oil and other waste oils, making it a sustainable and viable source for SAF production.
Asia Pacific Sustainable Aviation Fuel (SAF) Market Competitive Landscape
The Asia Pacific SAF market is dominated by a combination of global fuel producers and regional energy companies. These companies are at the forefront of developing SAF technologies, forming strategic partnerships with airlines, and expanding SAF production capacity across the region. The competitive landscape highlights the concentration of these market leaders who possess advanced technology and production capabilities. The following table showcases five major players in the SAF market:
|
Company |
Establishment Year |
Headquarters |
Production Capacity |
Key Partnerships |
SAF Technology |
Feedstock Type |
SAF Blending Ratio |
Revenue |
Regional Presence |
|
Neste Corporation |
1948 |
Finland |
_ |
_ |
_ |
_ |
_ |
_ |
_ |
|
TotalEnergies SE |
1924 |
France |
_ |
_ |
_ |
_ |
_ |
_ |
_ |
|
Chevron Corporation |
1879 |
USA |
_ |
_ |
_ |
_ |
_ |
_ |
_ |
|
Shell Aviation |
1907 |
Netherlands |
_ |
_ |
_ |
_ |
_ |
_ |
_ |
|
Gevo Inc. |
2005 |
USA |
_ |
_ |
_ |
_ |
_ |
_ |
_ |
Asia Pacific Sustainable Aviation Fuel (SAF) Industry Analysis
Growth Drivers
- Increasing Focus on Carbon Emission Reduction: The aviation sector contributes approximately 2.5 billion metric tons of CO emissions annually worldwide. Countries in the Asia Pacific region, such as China and India, are placing greater emphasis on carbon reduction strategies, which include promoting sustainable aviation fuels (SAF). The International Civil Aviation Organization (ICAO) estimates that the region's aviation-related CO emissions could reach 500 million metric tons by 2025 if left unchecked. The adoption of SAF has become crucial in reducing the carbon footprint of aviation, aiming to reduce emissions by up to 80% per lifecycle compared to conventional jet fuels.
- Regulatory Support from Governments: Governments in the Asia Pacific region, including Australia, Japan, and Singapore, have launched various policy initiatives to accelerate SAF production and usage. In 2024, the Japanese government set aside $250 million to develop bio-refineries capable of producing SAF. Additionally, the Australian government aims to produce 10 million liters of SAF by 2025 through its biofuel blending mandates. These policies reflect strong regulatory backing for SAF, as aviation decarbonization has become a national priority, particularly in nations with high air traffic volumes.
- Rising Airline Initiatives for Sustainability: Airlines across the Asia Pacific are actively incorporating SAF into their operations to meet environmental goals. Singapore Airlines, for instance, has committed to using 25 million liters of SAF annually from 2024 onward. Moreover, Japan Airlines (JAL) has signed a 10-year contract to utilize SAF as part of its long-term sustainability initiatives. Airlines are also setting ambitious carbon-neutrality targets by 2050, making SAF an essential part of their strategies to reduce their carbon emissions and meet regulatory demands.
Market Challenges
- High Production Costs Compared to Fossil Fuels: The current production cost of SAF ranges from $2,000 to $3,500 per ton, significantly higher than conventional jet fuel, which costs around $900 per ton. This disparity in cost is a major barrier to widespread adoption. Despite government subsidies and regulatory support, the price gap remains a challenge. Additionally, limited economies of scale hinder SAF's ability to become cost-competitive in the short term, especially in countries like India and Thailand where SAF production is still nascent.
- Limited Feedstock Availability: The Asia Pacific region faces challenges in securing sufficient quantities of sustainable feedstocks for SAF production. Nations like Indonesia and Malaysia have abundant biomass, but other countries like Japan and South Korea depend on imports of bio-based materials like used cooking oil and waste oils, which increases production costs. The demand for feedstock in 2024 reached over 10 million tons across the region, but only about 30% of that can currently be sourced sustainably.
Asia Pacific Sustainable Aviation Fuel (SAF) Market Future Outlook
Over the next five years, the Asia Pacific Sustainable Aviation Fuel (SAF) market is expected to experience rapid growth, driven by stringent emission targets, ongoing technological innovations in feedstock processing, and increasing airline initiatives for adopting greener fuels. The rising investments in SAF production facilities and stronger government incentives for SAF adoption are likely to accelerate the shift toward more sustainable aviation practices. Countries in the Asia Pacific region are expected to play a pivotal role in increasing global SAF production capacity, as large-scale SAF production plants are under development in Australia, Japan, and Singapore. Furthermore, collaboration between governments, energy producers, and airlines will be crucial in scaling up SAF deployment.
Opportunities
- Development of New Feedstocks: There is a growing shift toward diversifying SAF feedstocks, particularly in using non-traditional materials such as municipal waste, algae, and agricultural residues. In 2024, the Asia Pacific region produced over 50 million tons of waste oils and municipal waste annually, which could be converted into SAF. Countries like China and India have initiated pilot projects to turn algae into biofuel, further enhancing the sustainability of SAF production. These developments offer promising opportunities to reduce reliance on limited traditional feedstocks.
- Increasing Investments in SAF Production Plants: Major investments in SAF production facilities are being made across the region, with several new plants scheduled to come online by 2025. In China, for example, a new SAF plant with an annual capacity of 300,000 tons is under construction, backed by an $800 million government investment. Similar projects are being initiated in countries like Australia and Japan, where governments are also providing grants and tax incentives to attract private-sector investment.
Scope of the Report
|
Fuel Type |
Bio-SPK FT-SPK HEFA-SPK ATJ-SPK |
|
Feedstock |
Municipal Waste Algae Waste Oils and Fats Agricultural Residue |
|
Blending Capacity |
Less than 50% 50% and Above |
|
Application |
Commercial Aviation Military Aviation Unmanned Aerial Vehicles |
|
Region |
Australia China India Japan South Korea |
Products
Key Target Audience Organizations and Entities Who Can Benefit by Subscribing This Report:
Airline Companies
SAF Producing Industries
Government and Regulatory Bodies (Civil Aviation Authority of Singapore, Japan Civil Aviation Bureau)
Fuel Distributor Companies
Aircraft Manufacturing Companies
Investors and Venture Capitalist Firms
Renewable Energy Industries
Environmental Companies
Companies
Players Mentioned in the Report
Neste Corporation
TotalEnergies SE
Chevron Corporation
Shell Aviation
Gevo Inc.
LanzaTech Inc.
Fulcrum BioEnergy
Aemetis Inc.
World Energy
Sasol Limited
Table of Contents
1. Asia Pacific Sustainable Aviation Fuel (SAF) Market Overview
1.1. Definition and Scope
1.2. Market Taxonomy
1.3. Market Growth Rate
1.4. Market Segmentation Overview
2. Asia Pacific Sustainable Aviation Fuel Market Size (In USD Mn)
2.1. Historical Market Size
2.2. Year-On-Year Growth Analysis
2.3. Key Market Developments and Milestones
3. Asia Pacific Sustainable Aviation Fuel Market Analysis
3.1. Growth Drivers (Environmental Impact, Regulatory Push)
3.1.1. Increasing Focus on Carbon Emission Reduction
3.1.2. Regulatory Support from Governments
3.1.3. Rising Airline Initiatives for Sustainability
3.1.4. Advancements in Feedstock Processing Technologies
3.2. Market Challenges (Technology Barriers, Cost)
3.2.1. High Production Costs Compared to Fossil Fuels
3.2.2. Limited Feedstock Availability
3.2.3. Infrastructure Constraints for SAF Adoption
3.2.4. Certification and Standardization Complexities
3.3. Opportunities (Feedstock Diversification, Policy Support)
3.3.1. Development of New Feedstocks (Waste Oils, Algae, Municipal Waste)
3.3.2. Increasing Investments in SAF Production Plants
3.3.3. Expansion of Carbon Offsetting Programs
3.3.4. Stronger Government Subsidies and Incentives
3.4. Trends (Technological, Policy)
3.4.1. Integration of Biofuel Technologies with Existing Refineries
3.4.2. Introduction of Long-Term SAF Contracts by Airlines
3.4.3. Collaboration between Oil Companies and Airlines
3.4.4. Focus on Lifecycle Emission Reduction
3.5. Government Regulation (Environmental Policies)
3.5.1. Emission Trading Systems (ETS) and Carbon Taxes
3.5.2. Renewable Energy Standards for Aviation
3.5.3. Government Grants and Funding for SAF
3.5.4. Regional Agreements for SAF Adoption
3.6. SWOT Analysis
3.7. Stakeholder Ecosystem (Producers, Airlines, Regulators)
3.8. Porters Five Forces
3.9. Competition Ecosystem
4. Asia Pacific Sustainable Aviation Fuel Market Segmentation
4.1. By Fuel Type (In Value %)
4.1.1. Bio-SPK
4.1.2. FT-SPK
4.1.3. HEFA-SPK
4.1.4. ATJ-SPK
4.2. By Feedstock (In Value %)
4.2.1. Municipal Waste
4.2.2. Algae
4.2.3. Waste Oils and Fats
4.2.4. Agricultural Residue
4.3. By Blending Capacity (In Value %)
4.3.1. Less than 50%
4.3.2. 50% and Above
4.4. By Application (In Value %)
4.4.1. Commercial Aviation
4.4.2. Military Aviation
4.4.3. Unmanned Aerial Vehicles
4.5. By Region (In Value %)
4.5.1. Australia
4.5.2. China
4.5.3. India
4.5.4. Japan
4.5.5. South Korea
5. Asia Pacific Sustainable Aviation Fuel Market Competitive Analysis
5.1. Detailed Profiles of Major Companies
5.1.1. Neste Corporation
5.1.2. TotalEnergies SE
5.1.3. Chevron Corporation
5.1.4. BP p.l.c.
5.1.5. Shell Aviation
5.1.6. Gevo Inc.
5.1.7. LanzaTech Inc.
5.1.8. Fulcrum BioEnergy
5.1.9. Aemetis Inc.
5.1.10. World Energy
5.1.11. Sasol Limited
5.1.12. SkyNRG
5.1.13. Velocys Plc
5.1.14. Red Rock Biofuels
5.1.15. Alder Fuels
5.2. Cross Comparison Parameters (Fuel Production Capacity, SAF Technology, Feedstock Availability, Blending Potential, Key Partners, Environmental Impact, Revenue, Regional Presence)
5.3. Market Share Analysis
5.4. Strategic Initiatives
5.5. Mergers and Acquisitions
5.6. Investment Analysis
5.7. Venture Capital Funding
5.8. Government Grants
5.9. Private Equity Investments
6. Asia Pacific Sustainable Aviation Fuel Market Regulatory Framework
6.1. Aviation Emission Standards
6.2. SAF Certification Processes (ICAO, CORSIA Compliance)
6.3. Compliance Requirements
6.4. Regional SAF Mandates
7. Asia Pacific Sustainable Aviation Fuel Future Market Size (In USD Bn)
7.1. Future Market Size Projections
7.2. Key Factors Driving Future Market Growth
8. Asia Pacific Sustainable Aviation Fuel Future Market Segmentation
8.1. By Fuel Type (In Value %)
8.2. By Feedstock (In Value %)
8.3. By Blending Capacity (In Value %)
8.4. By Application (In Value %)
8.5. By Region (In Value %)
9. Asia Pacific Sustainable Aviation Fuel Market Analysts Recommendations
9.1. TAM/SAM/SOM Analysis
9.2. Marketing Strategies for Stakeholders
9.3. White Space Opportunity Analysis
9.4. Key Partnerships for Growth
Research Methodology
Step 1: Identification of Key Variables
The initial phase involves constructing an ecosystem map encompassing all major stakeholders within the Asia Pacific SAF Market. This step is underpinned by extensive desk research, utilizing secondary and proprietary databases to gather comprehensive industry-level information. The primary objective is to identify and define the critical variables that influence market dynamics.
Step 2: Market Analysis and Construction
In this phase, historical data on SAF adoption, feedstock availability, and regulatory mandates will be compiled. This includes assessing production capacity across key players, and the blending ratio used by major airlines. The analysis will provide an accurate picture of current market conditions.
Step 3: Hypothesis Validation and Expert Consultation
Market hypotheses will be developed and validated through interviews with industry experts, including airline operators and fuel producers. Their insights will help refine the market projections and validate critical assumptions regarding SAF adoption.
Step 4: Research Synthesis and Final Output
The final phase involves synthesizing data from industry players, including SAF producers, to verify and complement the derived market estimates. This process ensures a comprehensive and accurate analysis of the Asia Pacific SAF market.
Frequently Asked Questions
01. How big is the Asia Pacific Sustainable Aviation Fuel Market?
The Asia Pacific Sustainable Aviation Fuel market is valued at USD 380 million, driven by rising government mandates for emission reduction and the increasing participation of airlines in reducing carbon footprints.
02. What are the challenges in the Asia Pacific SAF Market?
Challenges include high production costs, limited feedstock availability, and the need for infrastructure upgrades to support widespread SAF adoption. Regulatory complexities in SAF certification also pose challenges.
03. Who are the major players in the Asia Pacific SAF Market?
Major players in the market include Neste Corporation, TotalEnergies SE, Chevron Corporation, Shell Aviation, and Gevo Inc. These companies lead in SAF technology innovation and production capacity.
04. What are the growth drivers of the Asia Pacific SAF Market?
The market is propelled by stringent government policies on carbon reduction, technological advancements in SAF production, and increased collaborations between airlines and fuel producers.
Why Buy From Us?
 Framework")
What makes us stand out is that our consultants follows Robust, Refine and Result (RRR) methodology. i.e. Robust for clear definitions, approaches and sanity checking, Refine for differentiating respondents facts and opinions and Result for presenting data with story

We have set a benchmark in the industry by offering our clients with syndicated and customized market research reports featuring coverage of entire market as well as meticulous research and analyst insights.

While we don't replace traditional research, we flip the method upside down. Our dual approach of Top Bottom & Bottom Top ensures quality deliverable by not just verifying company fundamentals but also looking at the sector and macroeconomic factors.

With one step in the future, our research team constantly tries to show you the bigger picture. We help with some of the tough questions you may encounter along the way: How is the industry positioned? Best marketing channel? KPI's of competitors? By aligning every element, we help maximize success.

Our report gives you instant access to the answers and sources that other companies might choose to hide. We elaborate each steps of research methodology we have used and showcase you the sample size to earn your trust.

If you need any support, we are here! We pride ourselves on universe strength, data quality, and quick, friendly, and professional service.