
Asia Pacific Utility Pole Market Outlook to 2030
Region:Afganistan
Author(s):Meenakshi Bisht
Product Code:KROD4219
Region:Afganistan
Author(s):Meenakshi Bisht
Product Code:KROD4219
December 2024
89
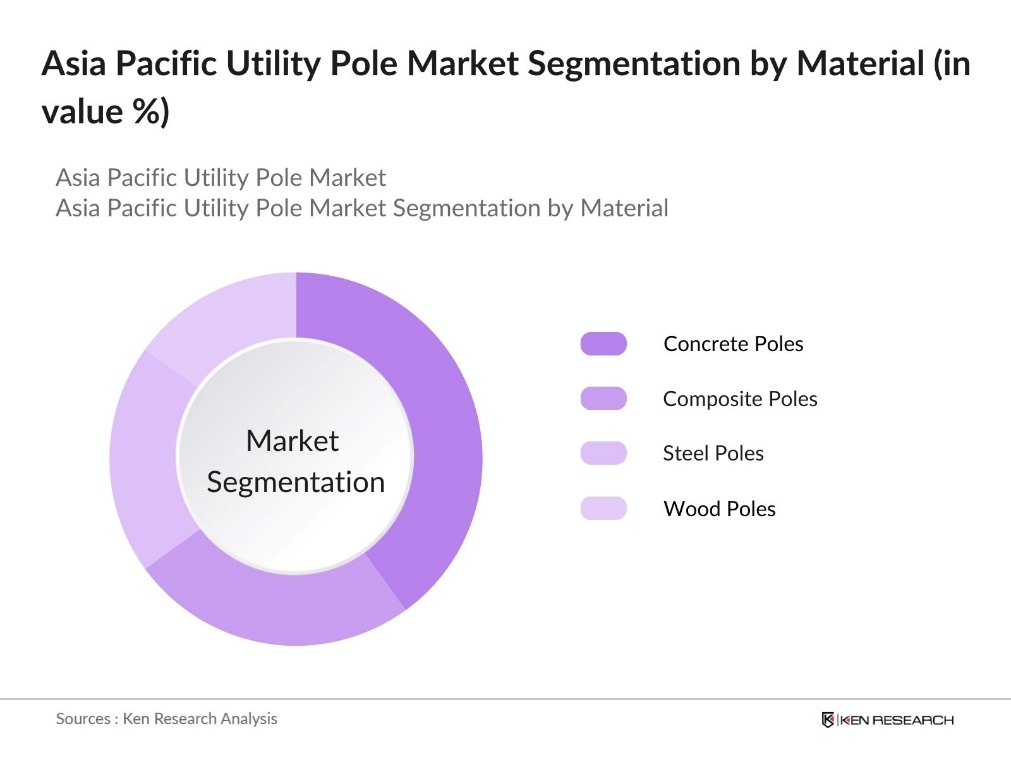
By Material: The Asia Pacific Utility Pole Market is segmented by material into wood poles, steel poles, concrete poles, and composite poles. Concrete poles dominate the market, primarily because they offer high durability and resistance to environmental factors like moisture, corrosion, and termite infestation. The growing infrastructure projects, especially in developing regions, prefer concrete poles due to their long life span and ability to support heavy electrical lines and telecommunication equipment. Steel poles are also gaining traction in urban areas due to their sleek design and adaptability for use in smart cities.
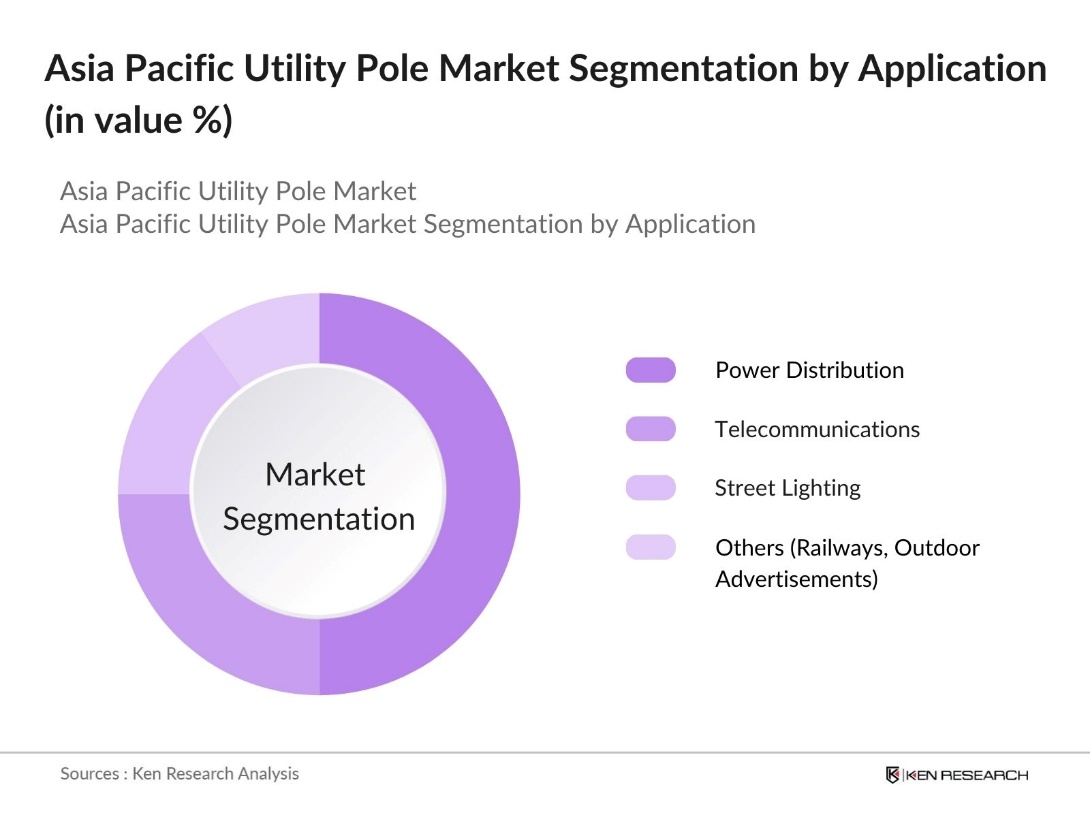
By Application: The Asia Pacific Utility Pole Market is segmented by application into power distribution, telecommunications, street lighting, and others (railways, outdoor advertisements). Power distribution holds the largest market share, driven by the increased demand for reliable electricity access across both urban and rural regions. Governments across the Asia Pacific region have undertaken large-scale electrification projects, particularly in India and Southeast Asia, to ensure that even remote areas have access to the power grid. Telecommunications applications are rapidly growing, particularly with the advent of 5G technology and increased demand for better connectivity infrastructure.
The market is dominated by both regional and international players. Companies with extensive expertise in durable materials, long-lasting pole designs, and strategic partnerships with utility companies lead the market. The integration of smart pole technologies is also a growing focus among market leaders. For instance, many companies are investing in IoT-enabled utility poles to support smart grid infrastructure.
|
Company |
Establishment Year |
Headquarters |
Number of Employees |
Revenue (USD Mn) |
Production Capacity |
R&D Investments |
Regional Presence |
Key Clients |
|
Valmont Industries, Inc. |
1946 |
Omaha, USA |
||||||
|
Nippon Concrete Industries |
1955 |
Tokyo, Japan |
||||||
|
Skipper Limited |
1981 |
Kolkata, India |
||||||
|
RS Technologies Inc. |
2003 |
Alberta, Canada |
||||||
|
Creative Pultrusions, Inc. |
1973 |
Pennsylvania, USA |
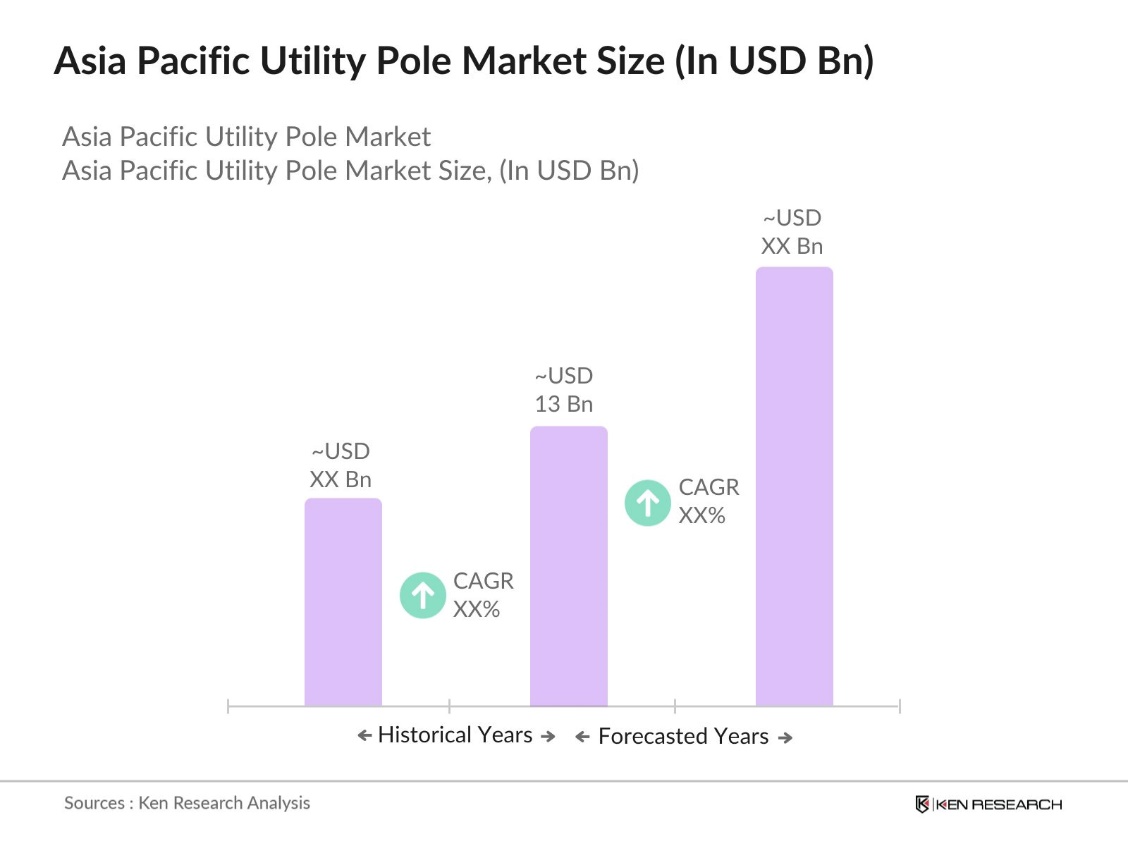
Over the next five years, the Asia Pacific Utility Pole Market is expected to show steady growth driven by increasing investments in renewable energy projects, telecommunications infrastructure expansion, and the adoption of smart city initiatives. Governments across the region are focusing on enhancing both rural and urban infrastructure to support growing populations and industrial demand. Additionally, the rise of smart utility poles, which integrate advanced technologies like sensors and IoT, will create new opportunities for market players looking to enhance their portfolios.
|
By Material |
Wood Poles Steel Poles Concrete Poles Composite Poles |
|
By Application |
Power Distribution Telecommunications Street Lighting, Others |
|
By Pole Height |
Below 10 Meters 10-20 Meters Above 20 Meters |
|
By Utility Type |
Transmission Poles Distribution Poles |
|
By Region |
China India Japan South Korea Southeast Asia Australia and New Zealand |
1.1. Definition and Scope
1.2. Market Taxonomy
1.3. Market Growth Rate (Poles Installed, Replacement Rates, New Infrastructure)
1.4. Market Segmentation Overview
2.1. Historical Market Size (Volume of Poles Installed, Replacement Rates)
2.2. Year-On-Year Growth Analysis (New Installations vs. Replacement)
2.3. Key Market Developments and Milestones (Expansion of Power Grids, Telecommunications Projects)
3.1. Growth Drivers
3.1.1. Urbanization and Infrastructure Development (Increased Demand for Power and Telecommunications Poles)
3.1.2. Electrification of Rural Areas (New Utility Pole Installation)
3.1.3. Technological Advancements (Smart Poles, IoT-Enabled Utility Poles)
3.1.4. Government Infrastructure Projects (Power Grid Expansion, 5G Rollout)
3.2. Market Challenges
3.2.1. Rising Raw Material Costs (Wood, Steel, Concrete)
3.2.2. Regulatory Compliance and Environmental Standards (Sustainability of Wood Poles)
3.2.3. Competition from Alternative Technologies (Underground Power Lines, Wireless Solutions)
3.2.4. Maintenance and Replacement Costs
3.3. Opportunities
3.3.1. Demand for Smart Poles in Urban Areas (Integration of Cameras, Sensors, IoT)
3.3.2. Growth in Telecommunication Infrastructure (5G Network Expansion)
3.3.3. Expansion into Emerging Markets (Rural Electrification in Developing Countries)
3.3.4. Public-Private Partnerships in Infrastructure Projects
3.4. Trends
3.4.1. Adoption of Composite Poles (Longer Lifespan, Less Maintenance)
3.4.2. Integration of IoT with Utility Poles (Smart Grids, Remote Monitoring)
3.4.3. Sustainability and Eco-Friendly Materials (Demand for Recycled and Sustainable Utility Poles)
3.4.4. Development of Multi-Purpose Poles (Power, Telecommunications, Street Lighting)
3.5. Government Regulations
3.5.1. National Infrastructure Development Plans
3.5.2. Environmental Regulations on Pole Materials (Sustainable Wood, Reduction of Concrete Usage)
3.5.3. Safety Standards for Utility Poles (High Wind, Earthquake Resistance Standards)
3.5.4. Incentives for Renewable Energy-Enabled Poles (Poles with Solar Panels)
3.6. SWOT Analysis
3.7. Stakeholder Ecosystem (Suppliers, Manufacturers, Contractors, Governments)
3.8. Porters Five Forces Analysis (Raw Material Suppliers, New Entrants, Substitutes, Competition)
3.9. Competition Ecosystem (Technology Integration, Geographical Dominance)
4.1. By Material (In Value %):
4.1.1. Wood Poles
4.1.2. Steel Poles
4.1.3. Concrete Poles
4.1.4. Composite Poles
4.2. By Application (In Value %):
4.2.1. Power Distribution
4.2.2. Telecommunications
4.2.3. Street Lighting
4.2.4. Others (Railways, Outdoor Advertisements)
4.3. By Pole Height (In Value %):
4.3.1. Below 10 Meters
4.3.2. 10-20 Meters
4.3.3. Above 20 Meters
4.4. By Utility Type (In Value %):
4.4.1. Transmission Poles
4.4.2. Distribution Poles
4.5. By Region (In Value %):
4.5.1. China
4.5.2. India
4.5.3. Japan
4.5.4. South Korea
4.5.5. Southeast Asia
4.5.6. Australia and New Zealand
5.1. Detailed Profiles of Major Companies
5.1.1. Valmont Industries, Inc.
5.1.2. Nippon Concrete Industries Co., Ltd.
5.1.3. Skipper Limited
5.1.4. FUCHS Europoles GmbH
5.1.5. Stella-Jones Inc.
5.1.6. KEC International
5.1.7. Omega Concrete Poles Australia
5.1.8. Creative Pultrusions, Inc.
5.1.9. RS Technologies Inc.
5.1.10. Duratel LLC
5.1.11. StressCrete Group
5.1.12. Qingdao Wuxiao Group Co., Ltd.
5.1.13. Pelco Products, Inc.
5.1.14. Sabre Industries, Inc.
5.1.15. McWane Poles
5.2. Cross Comparison Parameters (No. of Employees, Production Capacity, Revenue, Manufacturing Plants, Inception Year, Regional Presence, Key Partnerships, Technology Adoption)
5.3. Market Share Analysis (Top 10 Players by Revenue)
5.4. Strategic Initiatives (Expansion, Joint Ventures, R&D Investments)
5.5. Mergers and Acquisitions
5.6. Investment Analysis (New Production Facilities, Modernization of Existing Plants)
5.7. Venture Capital Funding
5.8. Government Grants and Subsidies for Green Poles
6.1. Industry Standards (ISO, National Standards)
6.2. Compliance Requirements (Safety, Durability)
6.3. Certification Processes (Sustainable Pole Manufacturing, Fire Resistance Standards)
7.1. Future Market Size Projections (New Installations, Replacement Rates)
7.2. Key Factors Driving Future Market Growth (Urbanization, Telecommunication Expansion, Smart Grid Developments)
8.1. By Material (In Value %)
8.2. By Application (In Value %)
8.3. By Pole Height (In Value %)
8.4. By Utility Type (In Value %)
8.5. By Region (In Value %)
9.1. TAM/SAM/SOM Analysis
9.2. Customer Cohort Analysis (Utility Companies, Contractors, Municipalities)
9.3. Marketing Initiatives
9.4. White Space Opportunity Analysis (New Regions, Technological Innovations)
The first step involved mapping out the key stakeholders in the Asia Pacific Utility Pole Market. This was achieved by conducting in-depth desk research using proprietary databases and reports, with a focus on identifying material use trends, regional power projects, and growth in telecommunications infrastructure.
Historical data was compiled to evaluate market performance, including the number of utility poles installed across various regions, demand for renewable energy projects, and advancements in smart pole technology. Additionally, a comprehensive analysis of service and product offerings by market leaders was conducted.
Key hypotheses related to market growth, technological innovation, and governmental regulations were validated through interviews with industry experts from both utility and telecommunications sectors. These consultations provided crucial insights into the operational challenges and future trends influencing the market.
The final phase of the research involved synthesizing the gathered data and insights, ensuring the accuracy and reliability of the market statistics. This was further supported by engaging with manufacturing firms to validate production capacities and future technology adoption.
The Asia Pacific Utility Pole Market is valued at USD 13 billion, driven by infrastructure investments, government initiatives in electrification, and the growth of telecommunications networks across the region.
Key challenges in Asia Pacific Utility Pole Market include the rising costs of raw materials such as wood and steel, regulatory compliance related to environmental concerns, and competition from alternative technologies like underground power lines.
Major players in Asia Pacific Utility Pole Market include Valmont Industries, Inc., Nippon Concrete Industries, Skipper Limited, RS Technologies Inc., and Stella-Jones Inc. These companies lead the market due to their strong production capacities and partnerships with utility companies.
Growth drivers in Asia Pacific Utility Pole Market include increasing government investments in rural electrification, the expansion of 5G networks, and the modernization of urban infrastructure through smart city projects, which require advanced utility pole solutions.
 Framework")
What makes us stand out is that our consultants follows Robust, Refine and Result (RRR) methodology. i.e. Robust for clear definitions, approaches and sanity checking, Refine for differentiating respondents facts and opinions and Result for presenting data with story

We have set a benchmark in the industry by offering our clients with syndicated and customized market research reports featuring coverage of entire market as well as meticulous research and analyst insights.

While we don't replace traditional research, we flip the method upside down. Our dual approach of Top Bottom & Bottom Top ensures quality deliverable by not just verifying company fundamentals but also looking at the sector and macroeconomic factors.

With one step in the future, our research team constantly tries to show you the bigger picture. We help with some of the tough questions you may encounter along the way: How is the industry positioned? Best marketing channel? KPI's of competitors? By aligning every element, we help maximize success.

Our report gives you instant access to the answers and sources that other companies might choose to hide. We elaborate each steps of research methodology we have used and showcase you the sample size to earn your trust.

If you need any support, we are here! We pride ourselves on universe strength, data quality, and quick, friendly, and professional service.