
Asia Pacific Water Enhancer Market Outlook to 2030
Region:Asia
Author(s):Vijay Kumar
Product Code:KROD5964
Region:Asia
Author(s):Vijay Kumar
Product Code:KROD5964
December 2024
81
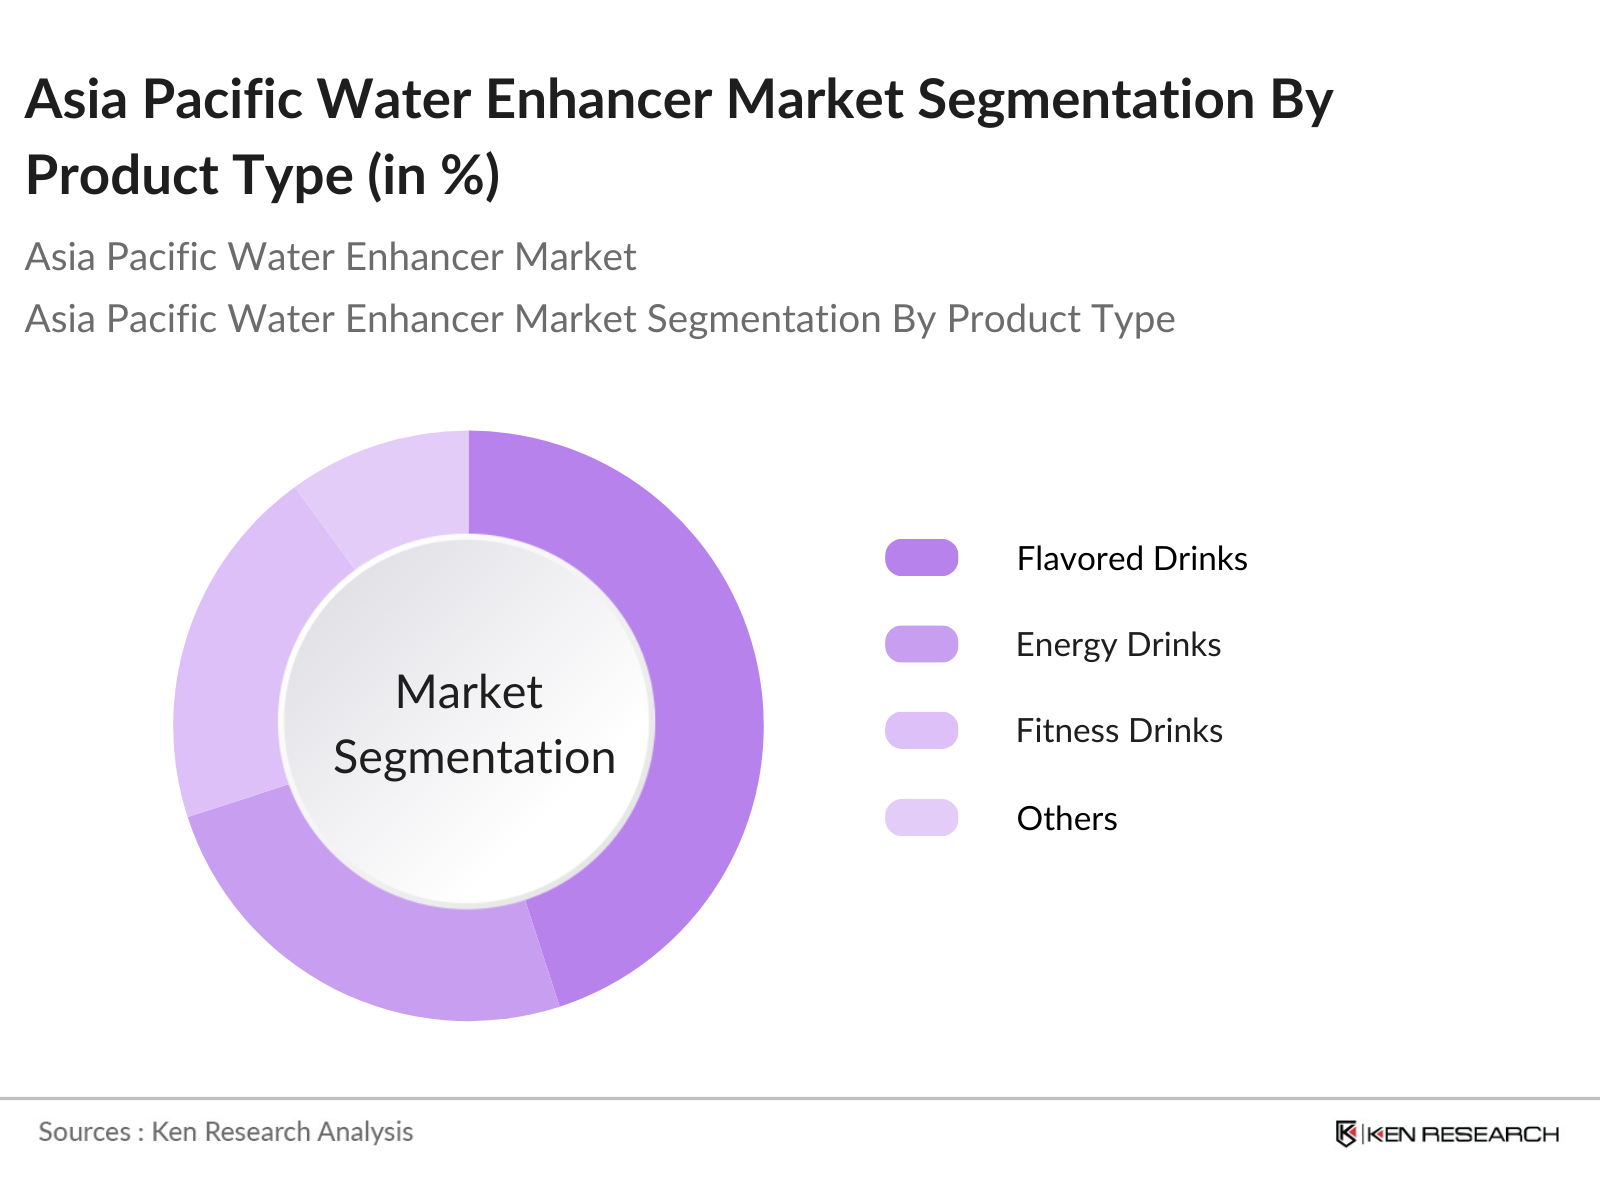
By Product Type: The market is segmented by product type into flavored drinks, energy drinks, fitness drinks, and others. Flavored drinks hold a dominant market share due to their wide appeal and variety of taste options, catering to consumers seeking healthier alternatives to traditional sugary beverages. The availability of diverse flavors encourages regular consumption, contributing to the segment's prominence.
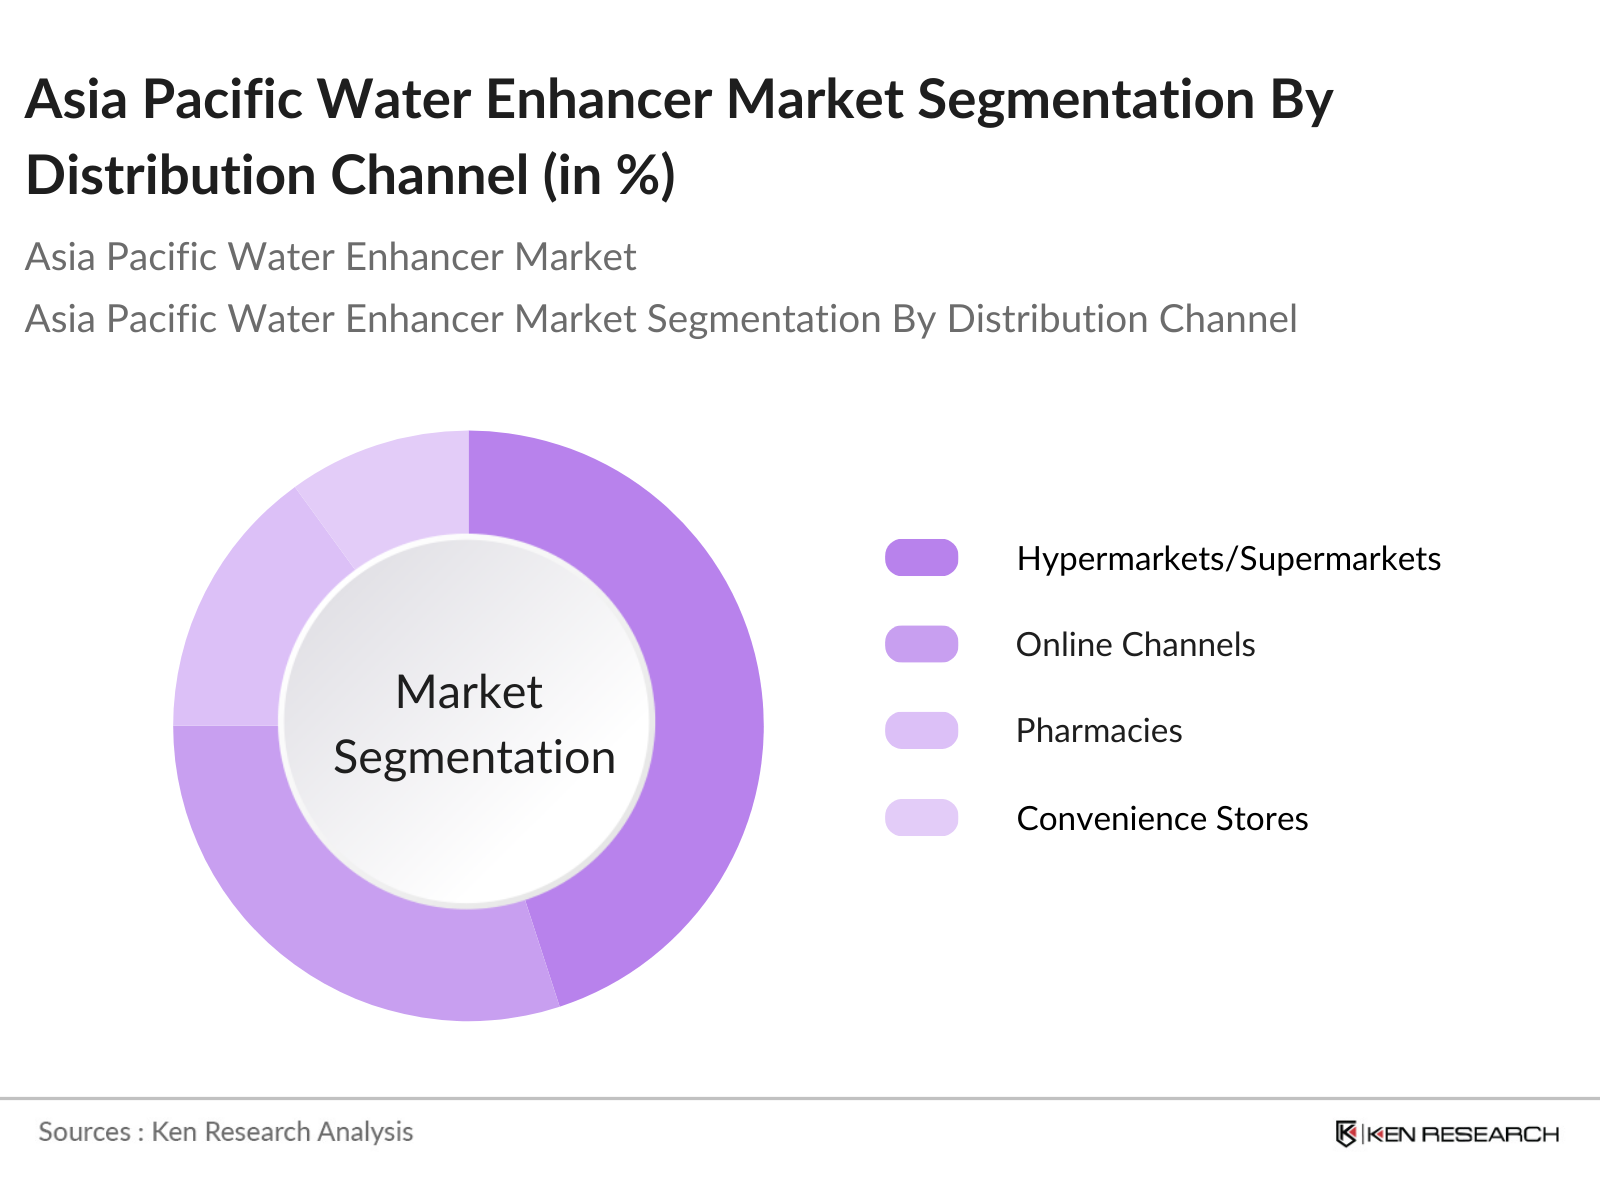
By Distribution Channel: Distribution channels for water enhancers include hypermarkets/supermarkets, online channels, pharmacies, convenience stores, and others. Hypermarkets and supermarkets lead the market share, offering consumers the advantage of a wide selection and the convenience of one-stop shopping. Their extensive reach and ability to stock various brands and flavors make them a preferred choice for purchasing water enhancers.
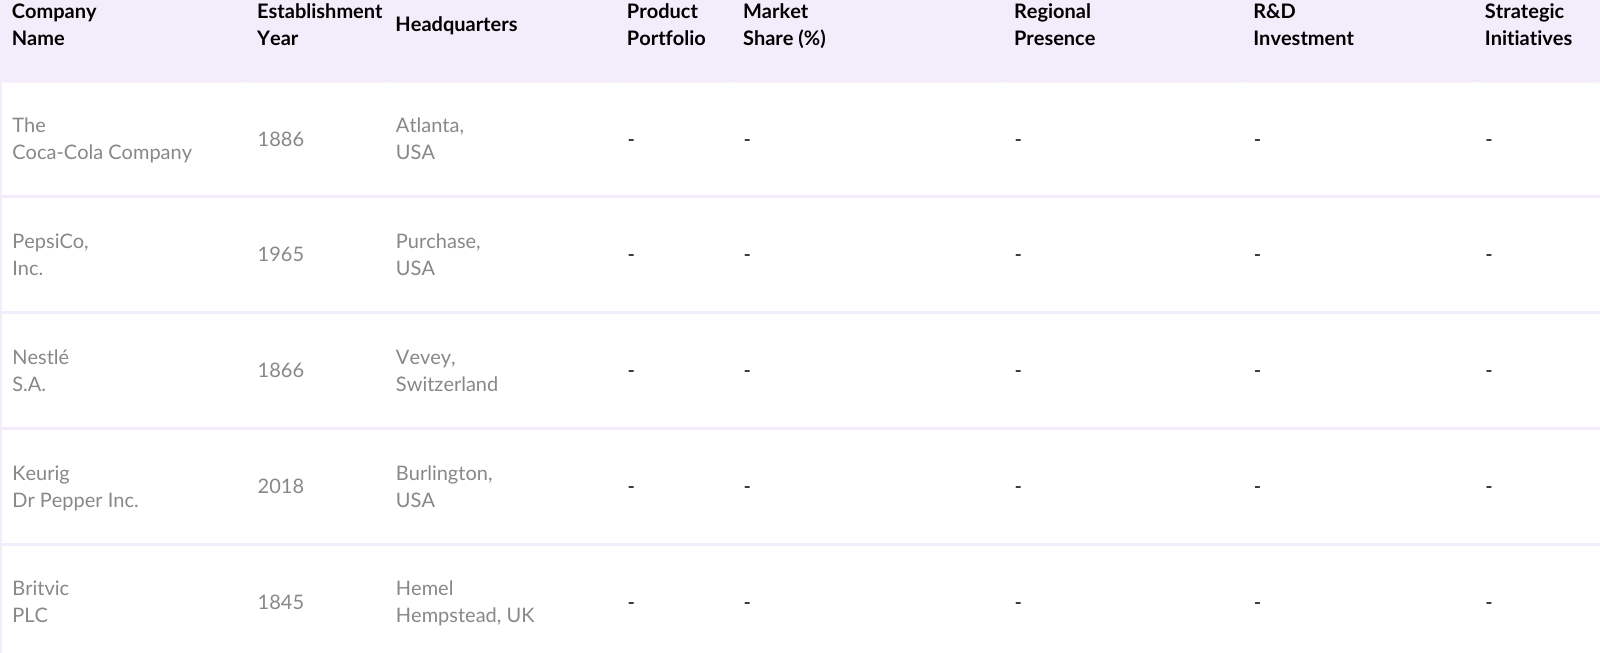
The Asia Pacific water enhancer market is characterized by the presence of both global and regional players, leading to a competitive environment. Companies are focusing on product innovation, flavor diversification, and strategic partnerships to strengthen their market position. The introduction of natural and organic ingredients is a notable trend among key players.
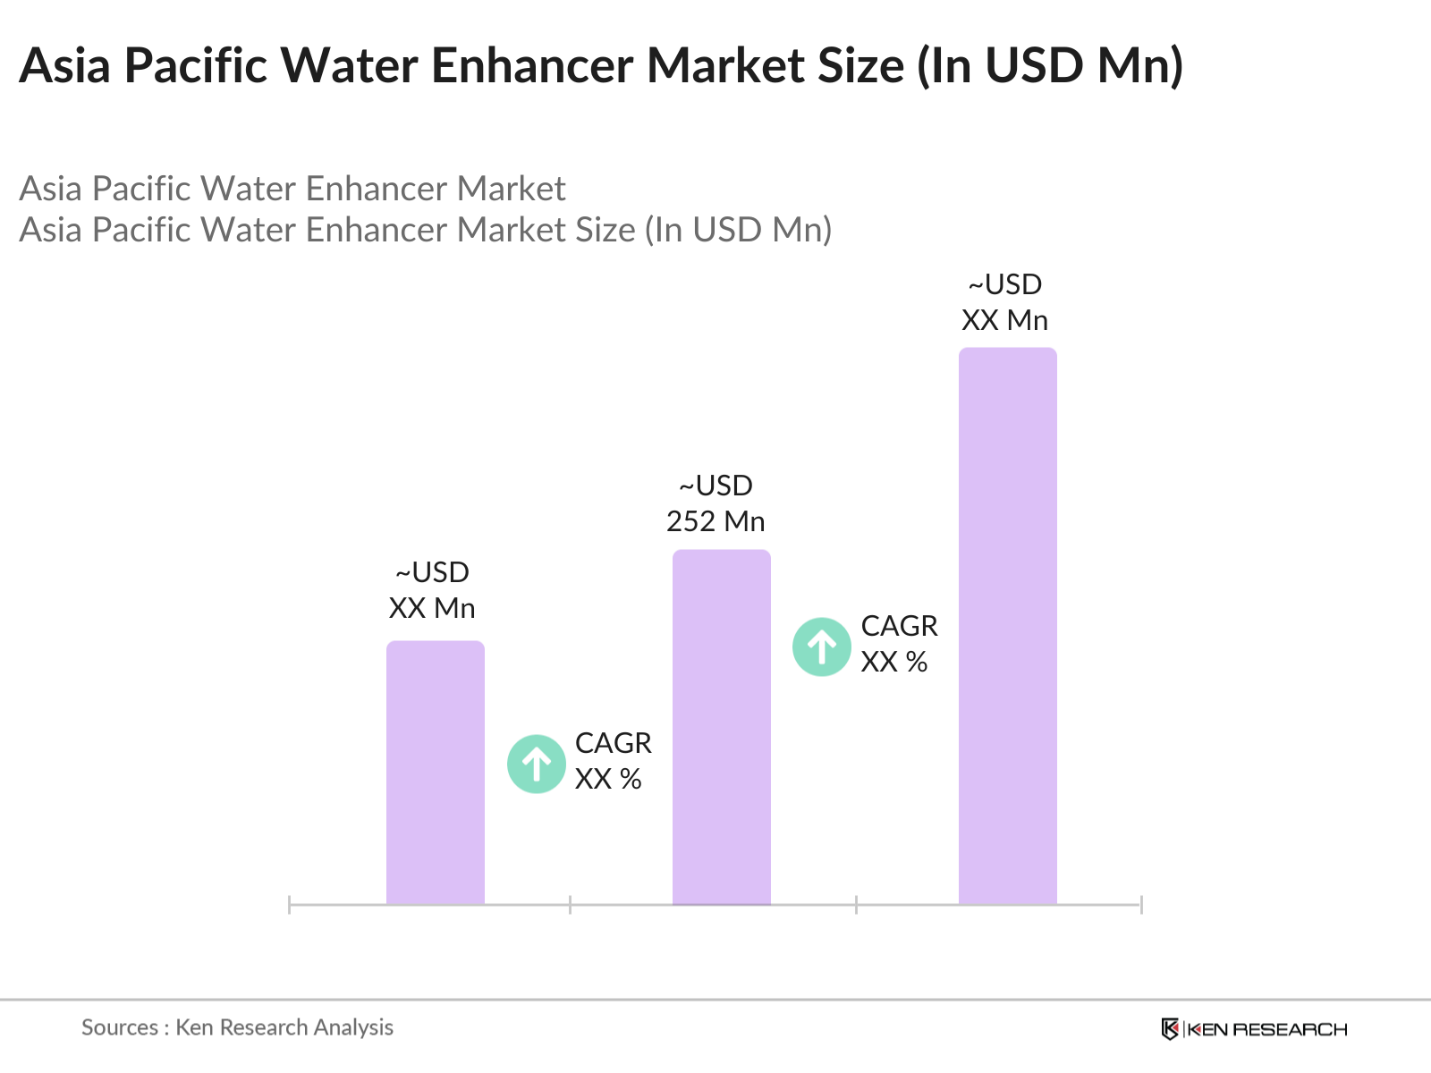
Over the next five years, the Asia Pacific water enhancer market is expected to experience significant growth, driven by continuous product innovation, increasing consumer health awareness, and the expansion of distribution channels. The incorporation of functional ingredients and the development of personalized nutrition products are anticipated to further propel market expansion.
|
Product Type |
Flavored Water Enhancers |
|
Form |
Liquid |
|
Ingredient Type |
Vitamins and Minerals |
|
Distribution Channel |
Supermarkets/Hypermarkets |
|
Country |
China |
1.1 Definition and Scope
1.2 Market Taxonomy
1.3 Market Growth Rate
1.4 Market Segmentation Overview
2.1 Historical Market Size
2.2 Year-On-Year Growth Analysis
2.3 Key Market Developments and Milestones
3.1 Growth Drivers
3.1.1 Health Consciousness and Demand for Low-Calorie Beverages
3.1.2 Rise in Consumption of Functional Beverages
3.1.3 Growth of Online Retail Channels
3.1.4 Increasing Urbanization and Lifestyle Changes
3.2 Market Challenges
3.2.1 High Competition from Substitutes
3.2.2 Limited Consumer Awareness in Developing Areas
3.2.3 Regulatory Challenges
3.3 Opportunities
3.3.1 Product Innovation in Flavor and Ingredients
3.3.2 Expansion into Rural and Semi-urban Markets
3.3.3 Strategic Alliances and Partnerships
3.4 Trends
3.4.1 Demand for Natural and Organic Ingredients
3.4.2 Growth of Sustainable Packaging
3.4.3 Personalized Beverage Solutions
3.5 Government Regulations
3.5.1 Food Safety Standards
3.5.2 Labeling Requirements
3.5.3 Import/Export Policies
3.6 SWOT Analysis
3.7 Stakeholder Ecosystem
3.8 Porters Five Forces Analysis
3.9 Competitive Landscape
4.1 By Product Type (In Value %)
4.1.1 Flavored Water Enhancers
4.1.2 Energy and Sports Drink Enhancers
4.1.3 Health and Wellness Enhancers
4.1.4 Functional/Targeted Nutrient Enhancers
4.2 By Form (In Value %)
4.2.1 Liquid
4.2.2 Powder
4.3 By Ingredient Type (In Value %)
4.3.1 Vitamins and Minerals
4.3.2 Electrolytes
4.3.3 Antioxidants
4.3.4 Sweeteners
4.3.5 Other Functional Additives
4.4 By Distribution Channel (In Value %)
4.4.1 Supermarkets/Hypermarkets
4.4.2 Convenience Stores
4.4.3 Pharmacies/Drug Stores
4.4.4 Online Retail
4.4.5 Specialty Stores
4.5 By Country (In Value %)
4.5.1 China
4.5.2 Japan
4.5.3 India
4.5.4 Australia
4.5.5 Rest of Asia Pacific
5.1 Detailed Profiles of Major Companies
5.1.1 The Coca-Cola Company
5.1.2 PepsiCo, Inc.
5.1.3 Nestl S.A.
5.1.4 Keurig Dr Pepper Inc.
5.1.5 Britvic PLC
5.1.6 Arizona Beverages
5.1.7 Dyla LLC (Stur)
5.1.8 Heartland Food Products Group
5.1.9 Wisdom Natural Brands
5.1.10 The Jel Sert Company
5.1.11 4C Foods Corp.
5.1.12 Mondelez International Inc.
5.1.13 Refresco
5.1.14 FLAVR Group
5.1.15 Pure Leaf
5.2 Cross Comparison Parameters (Number of Employees, Headquarters, Inception Year, Revenue, Product Portfolio, Market Share, Regional Presence, R&D Investment)
5.3 Market Share Analysis
5.4 Strategic Initiatives
5.5 Mergers and Acquisitions
5.6 Investment Analysis
5.6.1 Venture Capital Funding
5.6.2 Government Grants
5.6.3 Private Equity Investments
6.1 Food and Beverage Safety Regulations
6.2 Advertising and Labeling Standards
6.3 Import/Export Regulations
7.1 Market Size Projections
7.2 Key Factors Driving Future Market Growth
8.1 By Product Type (In Value %)
8.2 By Form (In Value %)
8.3 By Ingredient Type (In Value %)
8.4 By Distribution Channel (In Value %)
8.5 By Country (In Value %)
9.1 Total Addressable Market (TAM), Serviceable Available Market (SAM), and Serviceable Obtainable Market (SOM) Analysis
9.2 Customer Cohort Analysis
9.3 Marketing Initiatives
9.4 White Space Opportunity Analysis
The initial phase involves constructing an ecosystem map encompassing all major stakeholders within the Asia Pacific Water Enhancer Market. This step is underpinned by extensive desk research, utilizing a combination of secondary and proprietary databases to gather comprehensive industry-level information. The primary objective is to identify and define the critical variables that influence market dynamics.
In this phase, we compile and analyze historical data pertaining to the Asia Pacific Water Enhancer Market. This includes assessing market penetration, the ratio of marketplaces to service providers, and the resultant revenue generation. Furthermore, an evaluation of service quality statistics is conducted to ensure the reliability and accuracy of the revenue estimates.
Market hypotheses are developed and subsequently validated through computer-assisted telephone interviews (CATIs) with industry experts representing a diverse array of companies. These consultations provide valuable operational and financial insights directly from industry practitioners, which are instrumental in refining and corroborating the market data.
The final phase involves direct engagement with multiple water enhancer manufacturers to acquire detailed insights into product segments, sales performance, consumer preferences, and other pertinent factors. This interaction serves to verify and complement the statistics derived from the bottom-up approach, thereby ensuring a comprehensive, accurate, and validated analysis of the Asia Pacific Water Enhancer market.
The Asia Pacific Water Enhancer market is valued at USD 252 million, based on a five-year historical analysis. This market is primarily driven by a rising trend towards health-conscious consumption and a shift from sugary drinks to low-calorie hydration options.
Challenges include high competition from alternative beverages, regulatory compliance, and the need to increase consumer awareness in certain emerging markets. These obstacles impact product penetration, especially among price-sensitive customers.
Key players in the market include The Coca-Cola Company, PepsiCo Inc., Nestl S.A., Keurig Dr Pepper Inc., and Britvic PLC. These companies leverage strong brand recognition and distribution networks to maintain their competitive edge.
The market is propelled by rising health awareness, urbanization, and innovations in product flavors and ingredients. The demand for natural, organic, and functional additives such as vitamins and electrolytes is also a significant driver.
 Framework")
What makes us stand out is that our consultants follows Robust, Refine and Result (RRR) methodology. i.e. Robust for clear definitions, approaches and sanity checking, Refine for differentiating respondents facts and opinions and Result for presenting data with story

We have set a benchmark in the industry by offering our clients with syndicated and customized market research reports featuring coverage of entire market as well as meticulous research and analyst insights.

While we don't replace traditional research, we flip the method upside down. Our dual approach of Top Bottom & Bottom Top ensures quality deliverable by not just verifying company fundamentals but also looking at the sector and macroeconomic factors.

With one step in the future, our research team constantly tries to show you the bigger picture. We help with some of the tough questions you may encounter along the way: How is the industry positioned? Best marketing channel? KPI's of competitors? By aligning every element, we help maximize success.

Our report gives you instant access to the answers and sources that other companies might choose to hide. We elaborate each steps of research methodology we have used and showcase you the sample size to earn your trust.

If you need any support, we are here! We pride ourselves on universe strength, data quality, and quick, friendly, and professional service.