CHAPTER 1 - MARKET SUMMARY
Market Overview
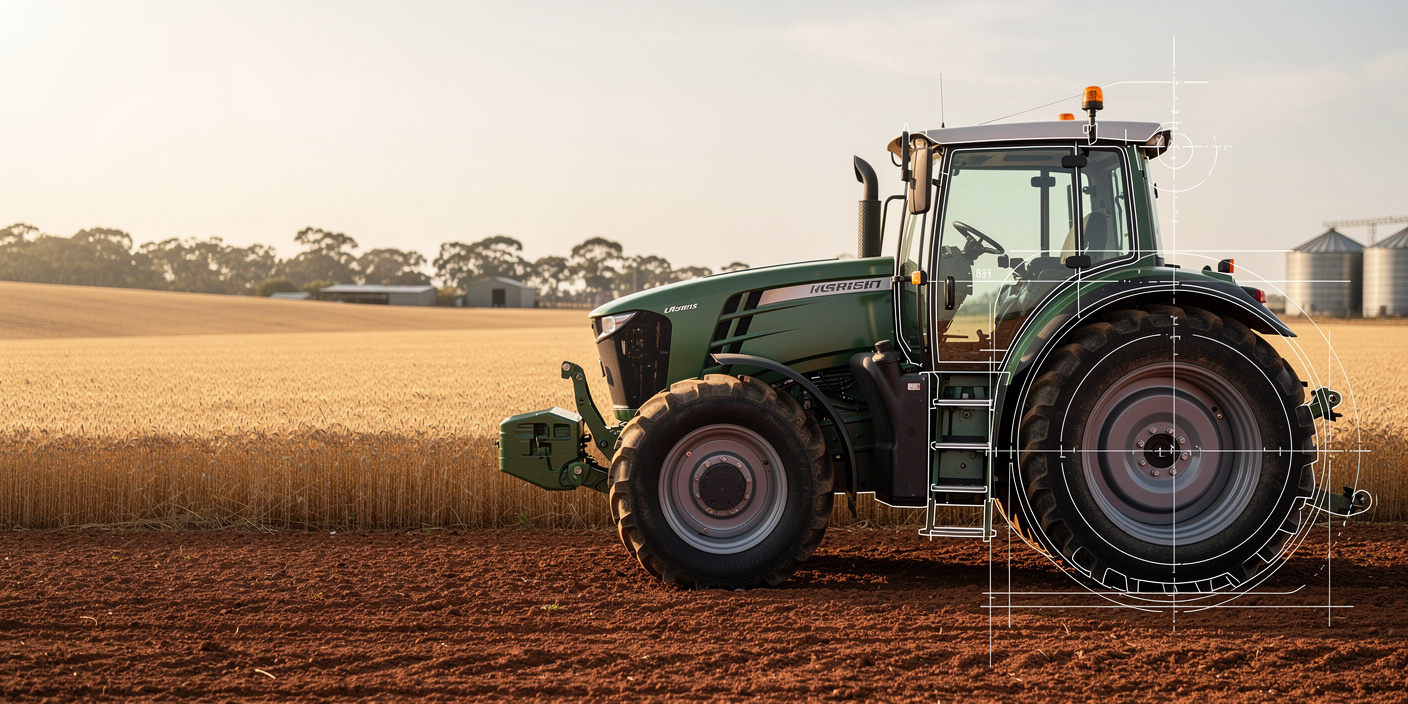
The Australia Agricultural Equipment Market operates through global OEMs, national dealer groups, regional specialists and local implement manufacturers serving approximately 87,800 agricultural businesses in 2021-22. Demand is anchored in broadacre replacement cycles, seasonal farm cash flow and contractor utilization. The commercial model combines equipment sale, financing, telematics, warranties and parts, making installed-base monetization increasingly important. Dealer finance availability governs conversion timing.
New South Wales is the largest demand hub, while Victoria and Western Australia form the other major equipment corridors. Together, these three states represented an estimated 65% of market revenue in 2025, reflecting grain, dairy, livestock and export-crop concentration. National combine harvester sales remained resilient at 693 units in 2025, demonstrating mandatory replacement demand despite softer tractor purchases. Regional seasonality determines dealer stock deployment.
Market Value
USD 4.20 billion
2025
Dominant Region
New South Wales
2025
Dominant Segment
Tractors
largest product segment, 2025
Total Number of Players
145
Future Outlook
The market is projected to recover from the 2024-2025 capital-spending correction and expand from USD 4.20 billion in 2025 to USD 5.76 billion by 2031. The 2020-2025 historical CAGR of 5.2% masks a two-speed cycle: rapid equipment purchases through 2022, followed by lower tractor demand and delayed large-machine replacements. The base forecast assumes a controlled rebound in unit volumes, normalization of dealer inventories, sustained agricultural output, and higher digital content per machine. Value growth therefore exceeds volume growth as guidance systems, autonomy-ready controls and variable-rate application become standard on premium equipment. Dealer stocking is assumed to rebalance gradually across states.
Forecast CAGR is estimated at 5.4% for 2026-2031, with annual growth accelerating from 3.2% in 2026 to 6.8% in 2031. Replacement of aging high-horsepower fleets, a rebound in farm cash income and tighter labor availability support demand, while a 4.35% cash rate in June 2026 limits near-term financing appetite. The fastest profit-pool growth is expected in connected implements, retrofit precision systems, service contracts and independent repair enablement. Downside risk is concentrated in drought, exchange-rate pressure and weaker commodity prices; upside depends on faster autonomy adoption and concessional climate-resilience investment. Regional service coverage remains a decisive share-gain variable.
5.4%
Forecast CAGR
$5,758 Mn
2030 Projection
Base Year
2025
Historical Period
2020-2025
Forecast Period
2026-2031
Historical CAGR
5.2%
CHAPTER 2 - SCOPE OF REPORT
Scope of the Market
CHAPTER 3 - Key Stakeholders
Key Target Audience
Key stakeholders who can leverage from this market analysis for investment, strategy, and operational planning.
Investors
CAGR, installed base, capex cycle, margin, downside risk
Corporates
dealer reach, product mix, pricing, service attachment, inventory
Government
productivity, repair access, safety, connectivity, climate resilience
Operators
uptime, hectares per hour, fuel, labor, payback
Financial institutions
asset finance, residual values, seasonality, covenants, defaults
CHAPTER 4 - Market Size & Growth
Market Size, Growth Forecast and Trends
This section evaluates the historical market size, analyzes year-over-year growth dynamics, and presents forecast projections supported by market performance indicators and demand-side drivers.
Historical & Projected Market Size ($ Million)
Year-over-Year Growth Rate (%)
Market Value vs Volume Growth (%)
Historical Market Performance (2020-2025)
Market value expanded fastest in 2022, rising 13.7% as high farm receipts, strong grain conditions and accelerated replacement lifted purchases. The cycle reversed in 2024 and 2025, when value declined 0.9% and 2.3%, respectively. Major equipment volume fell from an estimated 37,300 units in 2022 to 34,000 units in 2025. Demand remained concentrated in tractors, harvesting equipment and broadacre implements, while baler sales rose 13.5% in 2025, illustrating category-level resilience despite overall contraction. Dealer turnover weakened more than unit sales early in 2025 because high-value categories were disproportionately affected, increasing discounting risk.
Forecast Market Outlook (2026-2031)
The base case projects 5.4% CAGR through 2031, supported by gradual unit recovery and increasing equipment value density. Market growth accelerates after 2027 as deferred large-tractor purchases, contractor fleet renewal and precision retrofits move into procurement cycles. Major equipment volume reaches approximately 41,300 units in 2031, while implied average value per unit increases to about USD 139,419. The terminal market reaches USD 5.76 billion, with technology content, serviceability and fuel-efficient operation contributing more incremental revenue than basic mechanical capacity. This mix shift improves gross-profit potential but requires dealer investment in software support, technician training and cross-brand data integration.
CHAPTER 5 - Market Data
Market Breakdown
The market is transitioning from a post-peak equipment correction toward a technology-led replacement cycle. For CEOs and investors, the key issue is not only unit recovery but the shift toward higher-value connected machines, financing-linked sales and lifecycle service revenue.
Year | Market Size (USD Mn) | YoY Growth (%) | Tractor Sales (Units) | Combine Sales (Units) | Connected Equipment Penetration (% of New Major Equipment, Modelled) | Period |
|---|---|---|---|---|---|---|
| 2020 | $3,260 Mn | +- | 13,640 | 520 | Forecast | |
| 2021 | $3,650 Mn | +12.0% | 17,729 | 590 | Forecast | |
| 2022 | $4,150 Mn | +13.7% | 18,900 | 770 | Forecast | |
| 2023 | $4,340 Mn | +4.6% | 14,400 | 740 | Forecast | |
| 2024 | $4,300 Mn | +-0.9% | 10,242 | 696 | Forecast | |
| 2025 | $4,200 Mn | +-2.3% | 9,521 | 693 | Forecast | |
| 2026 | $4,335 Mn | +3.2% | 9,750 | 710 | Forecast | |
| 2027 | $4,545 Mn | +4.8% | 10,200 | 735 | Forecast | |
| 2028 | $4,795 Mn | +5.5% | 10,750 | 760 | Forecast | |
| 2029 | $5,075 Mn | +5.8% | 11,300 | 790 | Forecast | |
| 2030 | $5,390 Mn | +6.2% | 11,850 | 820 | Forecast | |
| 2031 | $5,758 Mn | +6.8% | 12,500 | 855 | Forecast |
Tractor Sales
9,521 units, 2025, Australia. The 7.0% annual decline confirms a cyclical trough, but the 40-100 horsepower segment grew 1.5%, indicating resilient mid-market demand. TMA data also recorded 2,609 fourth-quarter sales, only 2.5% below the prior year.
Combine Sales
693 units, 2025, Australia. Near-flat sales despite weaker tractors show that harvest-critical assets have lower deferral elasticity. Australia produced 36 million tonnes of wheat in 2021-22, sustaining a large installed base for combines, headers and grain-handling equipment.
Connected Equipment Penetration
52%, 2025, Australia, modelled. Penetration is expected to rise as telemetry and variable-rate controls become embedded in new fleets. The federal On Farm Connectivity Program allocated up to USD 35 million equivalent across three rounds to enable connected machinery and sensor deployment.
CHAPTER 6 - Segmentation
Market Segmentation Framework
Comprehensive analysis across key dimensions providing insights into market structure, consumer preferences, and distribution patterns.
No of Segments
7
Dominant Segment
Product Type
Fastest Growing Segment
Application
Product Type
Crop Type
Customer Type
Application
Distribution Channel
Farm Size
Geography
Key Segmentation Takeaways
Comprehensive analysis across all extracted segmentation dimensions providing insights into market structure, consumer preferences, and distribution patterns.
Product Type
Product economics remain dominated by tractors because they are the central power platform for tillage, seeding, spraying, loading and transport. High-horsepower tractors generate disproportionate revenue, while 40-100 horsepower machines provide the most stable unit demand. Harvesting equipment contributes a smaller but less deferrable profit pool because crop timing and fleet reliability directly affect realized farm revenue.
Application
Precision sowing, crop protection and variable-rate nutrient application are the fastest-growing application pools because they convert equipment investment into measurable reductions in seed, chemical and labor cost. The strongest growth is expected in crop protection and nutrition, where section control, sensor-guided spraying and retrofit steering can be deployed without replacing the full machine fleet.
CHAPTER 7 - Regional Analysis
Regional Analysis
Australia is the second-largest agricultural equipment market within a selected peer set of export-oriented, land-intensive farm economies, behind Canada and ahead of Argentina, South Africa and New Zealand. Its position reflects a very large agricultural land base, high mechanization intensity and strong replacement economics, although import dependence raises exposure to currency and freight movements.
Focus Country Ranking
2nd
Focus Country Market Size
USD 4.20 Bn (2025)
Australia CAGR (2026-2031)
5.4%
Focus Country Ranking
2nd
Focus Country Market Size
USD 4.20 Bn (2025)
Australia CAGR (2026-2031)
5.4%
Regional Analysis (Current Year)
Market Position
Australia ranks 2nd among selected peers with a USD 4.20 billion market in 2025, supported by 369 million hectares of agricultural land and export-oriented farm economics.
Growth Advantage
Australia's 5.4% forecast CAGR is above Canada's 5.15%, Argentina's 4.23% and New Zealand's 3.14%, positioning it as the peer set's growth leader on connected-equipment mix.
Competitive Strengths
Structural strengths include USD 66.7 billion equivalent agricultural production in 2025-26, a USD 35 million equivalent connectivity program and proposed repair reform worth USD 65 million equivalent annually in grain-output benefits.
CHAPTER 8 - INDUSTRY ANALYSIS
Growth Drivers, Market Challenges & Market Opportunities
Comprehensive analysis of key factors shaping the Australia Agricultural Equipment Market, including growth catalysts, operational challenges, and emerging opportunities across production, distribution, and consumer segments.
Growth Drivers
Farm Income Recovery and Export-Linked Production
- Average broadacre farm cash income increased 38% to USD 177,000 equivalent (2024-25, Australia), improving debt-service capacity for tractors, combines and seeding systems; OEM finance arms and dealer groups capture the earliest benefit.
- Agricultural exports were forecast at USD 56.0 billion equivalent (2025-26, Australia), supporting equipment demand where machine productivity protects quality, timing and export margins; broadacre contractors and high-capacity equipment suppliers benefit disproportionately.
- Australia has 369 million hectares of agricultural land (2021-22, Australia), creating long travel distances, high labor substitution value and strong demand for large-capacity machinery, remote diagnostics and fuel-efficient power platforms.
Labor Scarcity and Productivity Substitution
- Agriculture, forestry and fishing employed 292,200 people (2026, Australia), only 2.0% of the workforce, encouraging farms to raise output per operator through wider implements, auto-steering and integrated harvesting systems.
- The grains industry faces a projected 43,000 unfilled positions by 2030 (industry submission, Australia), increasing demand for autonomous field operations, remote fleet monitoring and contractor-scale machinery that can cover more hectares per shift.
- Horticulture labor use exceeded 100,000 workers (2021-22, Australia), creating a large addressable market for robotic weeding, smart spraying, machine vision and harvesting-assistance equipment that reduces seasonal labor exposure.
Connectivity, Climate and Repair Policy Support
- The On Farm Connectivity Program allocated USD 35 million equivalent across three rounds (2023-26, Australia), reducing the infrastructure barrier for telemetry, remote diagnostics and sensor-linked machinery sales in regional areas.
- The Climate-Smart Agriculture Program provides USD 201 million equivalent over five years (2023-28, Australia), supporting equipment that improves soil, water and input efficiency; precision sprayer, irrigation and variable-rate suppliers gain a clearer funding pathway.
- Proposed Right to Repair reform could lift GDP by USD 65 million equivalent annually (2026 estimate, Australia) through higher grain output, creating room for independent repairers, diagnostic-tool providers and parts networks to expand.
Market Challenges
Cyclical Capital Spending and Financing Cost
- High-horsepower tractor sales declined 15.9% to 1,599 units (2025, Australia), concentrating downside in the market's highest-value category and pressuring OEM mix, dealer absorption and used-equipment residuals.
- The RBA cash rate stood at 4.35% (June 2026, Australia), raising finance costs for farms and dealers carrying inventory; suppliers need subsidized rates, seasonal repayment structures and disciplined stock allocation.
- Early-2025 machinery retail turnover was 29% below prior-year levels (February 2025, Australia), showing that unit declines can understate revenue pressure when large tractors and premium implements are deferred.
Import Dependence and Supply-Chain Exposure
- Global uncertainty has raised fuel, freight and supply-chain costs, while farm machinery can exceed USD 800,000 per unit (2025, North America benchmark); Australian importers must manage long lead times and customer price protection.
- Local manufacturing is strongest in implements, sprayers and specialized equipment rather than complete high-horsepower platforms, leaving an estimated 22% domestic value share (2025, Australia); scale economics constrain localization of engines, transmissions and electronics.
- Connected machines rely on proprietary software and diagnostic access, making downtime costly; the proposed repair framework estimates USD 65 million equivalent annual GDP upside (2026, Australia) from reducing harvest interruptions alone.
Climate Variability and Regional Demand Volatility
- Dry conditions contributed to New South Wales tractor sales running 13% below prior year (February 2025 YTD, Australia), showing that dealer demand can diverge materially by state and season.
- Mixed livestock-cropping farm cash income fell 64% to USD 71,000 equivalent (2023-24, Australia), demonstrating how commodity and weather shocks delay replacement even when fleets are aging.
- South Australian grain production was projected at 5.3 million tonnes (2024-25, state scope), down from 8.7 million tonnes, reducing local demand for new broadacre machinery and increasing inventory reallocation risk.
Market Opportunities
Retrofit Precision and Connected Equipment
- USD 35 million equivalent public connectivity funding (2023-26, Australia) supports monetizable bundles combining antennas, gateways, auto-steering, telematics subscriptions and installation; dealers can raise attachment revenue per machine.
- Investors, OEMs and independent specialists benefit because retrofit systems address the existing fleet rather than only new sales; the installed base includes more than 60,000 tractors sold during 2020-25 (Australia, estimated).
- Opportunity realization requires interoperable data, reliable rural coverage and dealer technician capability; the broader Better Connectivity Plan committed USD 437 million equivalent (program scope, Australia) to regional communications resilience.
Independent Repair, Diagnostics and Lifecycle Services
- Monetizable models include diagnostic subscriptions, repair-information access, mobile service fleets and uptime guarantees; the motor-vehicle information scheme supported a USD 1.6 billion equivalent turnover expansion (review period, Australia).
- Independent workshops, regional dealers and farmers benefit from shorter repair queues during harvest; combine sales of 693 units in 2025 (Australia) indicate a high-value installed base where avoided downtime has immediate economic value.
- Reform must establish secure access to software, electronic logbooks and high-risk repair information while preserving safety; consultation remained open until 3 July 2026 (Australia), making implementation design the critical dependency.
Climate-Smart and Autonomous Equipment Financing
- Revenue models can combine equipment leases, outcome-based irrigation savings and autonomy subscriptions; forecast precision and autonomous equipment growth of 11.2% CAGR (2026-31, Australia, modelled) provides above-market expansion.
- Large farms, contractors and financial institutions benefit because high utilization improves payback; average broadacre cash income reached USD 177,000 equivalent (2024-25, Australia), supporting structured finance tied to seasonal cash flow.
- Commercialization requires autonomy standards, cybersecurity, machine assurance and technician training; agriculture's workforce median age of 51 years (2026, Australia) strengthens the need for user-friendly systems and managed-service support.
CHAPTER 9 - Competitive Landscape
Competitive Landscape Overview
The market is moderately concentrated at the OEM level but fragmented across dealer networks, specialist implement suppliers and local service providers. Entry barriers include brand trust, inventory finance, national parts coverage, technician capability, telematics integration and seasonal working-capital exposure.
Market Share Distribution
Top 5 Players
Market Dynamics
8 new entrants in the past 5 years, indicating strong market attractiveness and growth potential.
Company Name | Market Share | Headquarters | Founding Year | Core Market Focus |
|---|---|---|---|---|
Deere & Company | - | Moline, United States | 1837 | Tractors, combines, precision guidance and connected farm systems |
CNH Industrial | - | Basildon, United Kingdom | 2012 | Case IH and New Holland tractors, harvesters and precision technology |
AGCO Corporation | - | Duluth, United States | 1990 | Fendt, Massey Ferguson, Valtra and PTx precision solutions |
Kubota Corporation | - | Osaka, Japan | 1890 | Compact and utility tractors, implements and smart agriculture |
CLAAS KGaA mbH | - | Harsewinkel, Germany | 1913 | Combine harvesters, forage harvesters, tractors and balers |
Mahindra & Mahindra | - | Mumbai, India | 1945 | Utility tractors and farm mechanization equipment |
SDF Group | - | Treviglio, Italy | 1927 | DEUTZ-FAHR and SAME tractors, specialty machinery and engines |
KUHN Group | - | Saverne, France | 1828 | Tillage, planting, crop protection, hay and feeding equipment |
Yanmar Holdings | - | Osaka, Japan | 1912 | Compact tractors, engines, rice and specialty farm machinery |
KRONE Agriculture | - | Spelle, Germany | 1906 | Forage harvesters, mowers, balers and transport equipment |
Cross Comparison Parameters
The report provides detailed cross-comparison of key players across 10 performance parameters to identify competitive strengths and weaknesses.
Dealer and Service Coverage
Connected Fleet Capability
Australia Revenue Growth
Lifecycle Gross Margin
Analysis Covered
Market Share Analysis:
Estimates brand positions across tractors, harvesting, implements and precision systems
Cross Comparison Matrix:
Benchmarks reach, technology, service capability and financial performance indicators nationally
SWOT Analysis:
Assesses brand strengths, vulnerabilities, opportunities and market-specific competitive threats nationally
Pricing Strategy Analysis:
Evaluates list pricing, financing, discounting and lifecycle value propositions nationally
Company Profiles:
Summarizes market focus, product portfolio, channels and strategic positioning nationally
CHAPTER 10 - REPORT TOC
Market Report Structure
Comprehensive coverage across three strategic phases — Market Assessment, Go-To-Market Strategy, and Survey — delivering end-to-end insights from market analysis and execution roadmap to customer demand validation.
Market Assessment Phase
Supply-side and competitive intelligence covering market sizing, segmentation, competitive dynamics, regulatory landscape, and future forecasts.
Go-To-Market Strategy Phase
15 chapters
Entry strategy evaluation, execution roadmap, partner recommendations, and profitability outlook.
Survey Phase
8 chapters
Demand-side primary research conducted through structured interviews and online surveys with end users across priority metros and Tier 2/3 cities to capture consumption behavior, unmet needs, and purchase drivers.
Complete Report Coverage
201+ detailed sections covering every aspect of the market
143
Assessment Sections
58
Strategy Sections
CHAPTER 11 - Our Approach
Research Methodology
Desk Research
- Australian machinery sales trend review
- Agricultural output and income analysis
- Equipment import and pricing assessment
- Connectivity and repair policy mapping
Primary Research
- OEM country managers and directors
- Dealer principals and sales managers
- Farm contractors and fleet managers
- Precision agriculture solution specialists
Validation and Triangulation
- 312 stakeholder interviews across value chain
- Brand-level revenue reconciliation checks
- Unit volume and ASP validation
- Scenario sensitivity and outlier review
CHAPTER 12 - FAQ
FAQs
Still have questions?
Our research team is here to help you find the right solution
CHAPTER 13 - Related Research
Explore Related Reports
Expand your market intelligence with complementary research across regions and adjacent markets.
Regional/Country ReportsRelated market analysis across key regions
Related market analysis across key regions
- Indonesia Agricultural Equipment Market Outlook to 2026
- Vietnam Agricultural Equipment Market Outlook to 2026
- Thailand Agricultural Equipment Market Outlook to 2026
- Malaysia Agricultural Equipment Market Outlook to 2026
- Philippines Agricultural Equipment Market Outlook to 2026
Adjacent ReportsRelated markets and complementary research
Related markets and complementary research
- Thailand Precision Farming Equipment Market
- South Africa Agricultural Machinery Telematics Market
- UAE Farm Equipment Financing Market
- Indonesia Agricultural Sensors Market
- Belgium Connected Farm Machinery Market
500+
Market Research Reports
50+
Countries Covered
15+
Industry Verticals