CHAPTER 1 - MARKET SUMMARY
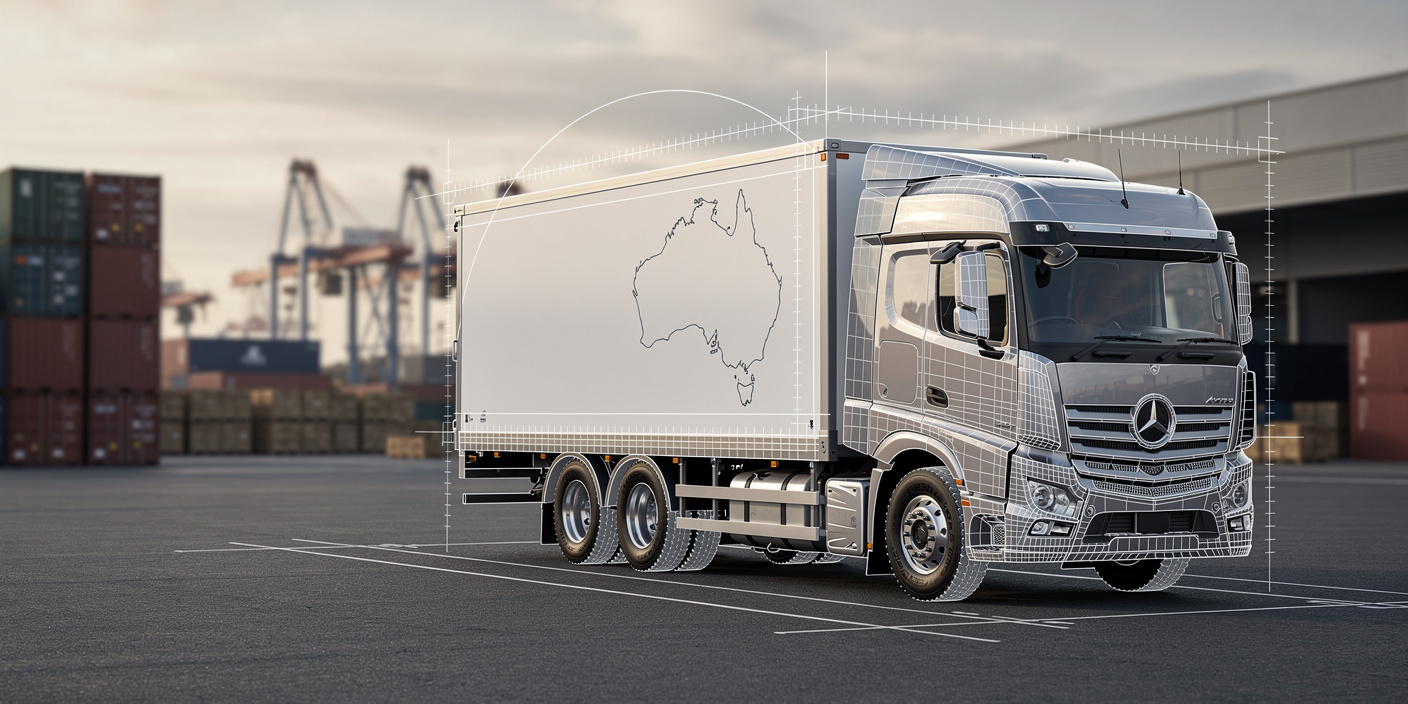
Market Overview
The Australia Logistics Market converts national consumption, industrial production, trade flows and digital orders into third-party transport, forwarding, warehousing and delivery revenue. E-commerce materially increases shipment frequency: 9.8 million households shopped online in 2025, while 41% of those households purchased at least fortnightly. This increases demand for parcel sorting, fulfilment, returns handling and inventory positioning close to major population centres.
Freight activity is concentrated around eastern seaboard consumption corridors and major port gateways, with Melbourne, Sydney and Brisbane supporting dense road, warehouse and container networks. Port of Melbourne processed 3.39 million TEUs in FY2025, up 3.7% year on year, while total port trade reached 113.6 million revenue tonnes. High gateway density improves backhaul availability, warehouse utilisation and intermodal economics.
Market Value
USD 84,810 million
2025
Dominant Region
New South Wales
2025
Dominant Segment
Courier, Express & Parcel Services
fastest growing
Total Number of Players
114,000
Future Outlook
The Australia Logistics Market is projected to advance from USD 84,810 million in 2025 to USD 124,192 million by 2032. The 5.60% forecast CAGR is above the 3.40% historical CAGR recorded during 2020-2025 because revenue growth increasingly reflects service mix, specialised handling, technology, parcel density and contract-logistics outsourcing. Physical for-hire freight volume is expected to rise much more slowly, from 245.0 billion tonne-kilometres in 2025 to approximately 262.7 billion tonne-kilometres by 2032, widening the contribution from revenue per tonne-kilometre and value-added logistics services.
Growth will be strongest where providers combine national transport capacity with fulfilment, forwarding, cold-chain and control-tower capabilities. E-commerce, infrastructure programs, population growth and higher supply-chain resilience requirements support demand, while labour, fuel, insurance and decarbonisation investments influence pricing. The market therefore offers a more attractive earnings profile for operators able to raise asset utilisation and contract value without proportional increases in physical freight. Integrated 3PL and 4PL models, digital freight orchestration and specialist healthcare or temperature-controlled logistics should capture a larger portion of incremental profit pools through 2032.
5.60%
Forecast CAGR
$124,192 Mn
2030 Projection
Base Year
2025
Historical Period
2020-2025
Forecast Period
2025-2032
Historical CAGR
3.40%
CHAPTER 2 - SCOPE OF REPORT
Scope of the Market
CHAPTER 3 - Key Stakeholders
Key Target Audience
Key stakeholders who can leverage from this market analysis for investment, strategy, and operational planning.
Investors
CAGR, margins, capex intensity, network scale, consolidation, risk
Corporates
freight rates, SLA, resilience, inventory, outsourcing, service coverage
Government
productivity, infrastructure, emissions, resilience, safety, freight data
Operators
utilization, route density, warehousing, automation, pricing, workforce productivity
Financial institutions
fleet finance, covenants, cash flow, asset values, demand stability
CHAPTER 4 - Market Size & Growth
Market Size, Growth Forecast and Trends
This section evaluates the historical market size, analyzes year-over-year growth dynamics, and presents forecast projections supported by market performance indicators and demand-side drivers. The locked 2025 estimate is USD 84,810 million, with a pre-validated base-year confidence range of USD 72,800-98,800 million and a ±15% margin of error primarily linked to the fragmented small-operator universe.
Historical & Projected Market Size ($ Million)
Year-over-Year Growth Rate (%)
Market Value vs Volume Growth (%)
Historical Market Performance (2020-2025)
Historical performance reflects pandemic-related disruption followed by a freight and parcel recovery. The strongest modelled annual expansion occurred in 2022 at 5.19%, while growth moderated to 2.43% in 2025 as physical freight expansion normalised. The 2020-2025 historical CAGR closes at 3.40%. Online-shopping participation increased from 9.1 million households in FY2021 to 9.8 million in 2025, strengthening parcel density even as traditional freight demand moved closer to underlying economic activity.
Forecast Market Outlook (2025-2032)
Forecast value growth is expected to remain materially above physical freight-task growth. The market is modelled at a 5.60% CAGR through 2032, while for-hire freight volume expands about 1.0% annually. Consequently, blended value intensity rises from approximately USD 0.346 per tonne-kilometre in 2025 to USD 0.473 by 2032. Parcel frequency, specialist cold-chain activity, higher service-level requirements, automation and integrated warehousing increase revenue per unit of physical freight and support the forecast acceleration.
CHAPTER 5 - Market Data
Market Breakdown
The Australia Logistics Market is moving from volume-led transport growth toward a higher-value mix of fulfilment, parcel, forwarding, specialised distribution and managed logistics. For CEOs and investors, the central issue is whether providers can expand value intensity faster than labour, fuel, fleet and compliance costs.
Year | Market Size (USD Mn) | YoY Growth (%) | For-Hire Freight Task (Bn tkm) | Blended Value Intensity (USD/tkm) | Online-Shopping Households (Mn) | Period |
|---|---|---|---|---|---|---|
| 2020 | $71,754 Mn | +- | 233.0 | 0.308 | Forecast | |
| 2021 | $73,200 Mn | +2.02% | 234.5 | 0.312 | Forecast | |
| 2022 | $77,000 Mn | +5.19% | 237.0 | 0.325 | Forecast | |
| 2023 | $80,100 Mn | +4.03% | 240.0 | 0.334 | Forecast | |
| 2024 | $82,800 Mn | +3.37% | 242.5 | 0.341 | Forecast | |
| 2025 | $84,810 Mn | +2.43% | 245.0 | 0.346 | Forecast | |
| 2026 | $89,559 Mn | +5.60% | 247.5 | 0.362 | Forecast | |
| 2027 | $94,574 Mn | +5.60% | 250.0 | 0.378 | Forecast | |
| 2028 | $99,870 Mn | +5.60% | 252.5 | 0.396 | Forecast | |
| 2029 | $105,463 Mn | +5.60% | 255.0 | 0.414 | Forecast | |
| 2030 | $111,369 Mn | +5.60% | 257.5 | 0.433 | Forecast | |
| 2031 | $117,606 Mn | +5.60% | 260.1 | 0.452 | Forecast | |
| 2032 | $124,192 Mn | +5.60% | 262.7 | 0.473 | Forecast |
For-Hire Freight Task
245.0 billion tonne-kilometres, 2025, Australia. Market-transacted freight excludes captive Pilbara mining rail, keeping the volume lens aligned with third-party revenue. BITRE estimates Australia's broader domestic freight task at 786 billion tonne-kilometres in FY2025.
Blended Value Intensity
USD 0.346 per tonne-kilometre, 2025, Australia. Rising value intensity signals a mix shift toward warehousing, CEP, forwarding and specialist services rather than physical freight alone. Australia Post's Parcels and Services revenue increased 2.9% in FY2025 while domestic parcel volumes rose 2.6%.
Online-Shopping Households
9.8 million households, 2025, Australia. High digital-shopping penetration creates recurring parcel, fulfilment and returns demand. Online spending increased 14% year on year in 2025 and 24% of retail spending was conducted online.
CHAPTER 6 - Segmentation
Market Segmentation Framework
Comprehensive analysis across key dimensions providing insights into market structure, consumer preferences, and distribution patterns.
No of Segments
7
Dominant Segment
Service Type
Fastest Growing Segment
Business Model
Service Type
Mode of Transport
Shipment Flow
Customer Type
End-Use Industry
Business Model
Geography
Key Segmentation Takeaways
Comprehensive analysis across all extracted segmentation dimensions providing insights into market structure, consumer preferences, and distribution patterns.
Service Type
Freight transport remains the core revenue pool because road, rail, air and coastal freight provide the physical backbone for nearly every downstream logistics service. Courier, Express and Parcel Services are becoming increasingly valuable within this dimension as digital retail raises shipment frequency, while contract warehousing and distribution gains from customer outsourcing and inventory decentralisation.
Business Model
Lead Logistics and 4PL is the fastest-evolving sub-segment because large shippers increasingly value end-to-end visibility, carrier management and inventory orchestration rather than isolated transport capacity. Digital Freight Brokerage also expands addressable capacity by aggregating fragmented carriers. Providers able to combine asset ownership with control-tower technology can capture both operational margins and higher-value coordination fees.
CHAPTER 7 - Regional Analysis
Regional Analysis
Australia ranks second among the selected Asia-Pacific peer markets by 2025 third-party logistics-services revenue, behind Indonesia but materially ahead of Malaysia, Singapore and New Zealand. Its competitive position combines a large domestic freight task, strong logistics infrastructure and high online-shopping penetration, although Singapore retains the strongest logistics-performance score among the peer set.
Focus Country Ranking
2nd
Focus Country Market Size
USD 84,810 Mn
Australia CAGR (2025-2032)
5.60%
Focus Country Ranking
2nd
Focus Country Market Size
USD 84,810 Mn
Australia CAGR (2025-2032)
5.60%
Regional Analysis (Current Year)
Market Position
Australia ranks second in the peer set at USD 84,810 million in 2025, supported by a continental domestic freight requirement and 786 billion tonne-kilometres of broader national freight activity.
Growth Advantage
Australia's 5.60% CAGR sits above New Zealand's 3.33% and Malaysia's approximately 5.14%, but below Singapore and Indonesia, positioning Australia as a large, moderate-growth logistics compounder.
Competitive Strengths
Australia combines a 3.7 World Bank LPI score, 3.39 million TEUs at Port of Melbourne and 9.8 million online-shopping households, supporting high-value multimodal and parcel logistics demand.
CHAPTER 8 - INDUSTRY ANALYSIS
Growth Drivers, Challenges & Opportunities
Comprehensive analysis of key factors shaping the Australia Logistics Market, including growth catalysts, operational challenges, and emerging opportunities across production, distribution, and consumer segments.
Growth Drivers
E-Commerce and Parcel Frequency
- 24% of retail spending (2025, Australia) occurred online, increasing addressable parcel, fulfilment and returns volumes for CEP and warehouse operators.
- 69% of shoppers (2025, Australia) want multiple delivery choices at checkout, increasing the value of parcel lockers, collection networks and flexible last-mile capacity.
- 26% of shoppers (2025, Australia) expect same-day or next-day delivery for urgent purchases, favouring operators with dense metropolitan networks and distributed inventory.
Trade and Infrastructure-Led Freight Demand
- 3.39 million TEUs (FY2025, Port of Melbourne) represented 3.7% annual container growth, expanding addressable drayage, forwarding and warehousing demand.
- USD 157 billion equivalent (five-year public infrastructure pipeline) supports project freight, construction materials and specialist transport demand across national corridors.
- 26% domestic freight-task growth (2020 to 2050, Australia) provides a long-duration volume base for road, rail and intermodal logistics investment.
Outsourcing and Higher-Value Logistics Mix
- 2.9% Parcels and Services revenue growth (FY2025, Australia Post) exceeded underlying parcel-volume growth, illustrating the value of service mix and pricing.
- 20,000 square metres (2026 completion pipeline, South Australia) of new DHL warehouse and office capacity illustrates investment in multi-sector and cold-chain logistics.
- 21,078 square metres (2026, Western Sydney) of new multi-customer warehouse capacity strengthens technology and automotive distribution, supporting higher-value contract logistics.
Market Challenges
Labour Cost and Workforce Availability
- 727,500 jobs (December 2025, Australia) were recorded across transport, postal and warehousing, making workforce productivity material to national logistics margins.
- 37.6 weekly paid hours (May 2025, transport sector) highlights labour intensity, increasing the value of route optimisation, warehouse automation and productivity-enhancing technology.
- 261,109 businesses (2026, Transport, Postal and Warehousing division) demonstrate a highly fragmented operating base, complicating recruitment, pricing discipline and technology standardisation.
Fuel and Operating-Cost Volatility
- 9% annual diesel-price decline (FY2025, Australia) provided temporary relief, but the magnitude of the movement shows continued exposure to global refined-fuel markets.
- 4.1 cents per litre quarterly diesel increase (December quarter 2025, Australia) demonstrates how quickly cost pressure can return, affecting carrier margins before contract repricing.
- 67.1% road-freight revenue share (2025, broad Australia freight-logistics benchmark) makes road operating costs particularly influential for aggregate logistics pricing.
Decarbonisation and Compliance Investment
- 29% of road-transport emissions (2024, Australia) came from on-road trucks and buses, placing freight fleets directly within decarbonisation policy attention.
- 1,551 nominee customs brokers (September 2025, Australia) operate within a licensed compliance framework, making specialist regulatory capability important to cross-border forwarding.
- 14 national freight actions (2025, Australia) create a coordinated reform agenda across productivity, resilience, decarbonisation and data, requiring operators to align capital planning with evolving policy.
Market Opportunities
Automated Fulfilment and Dense Last-Mile Networks
- 32% of shoppers (2025, Australia) would switch retailers for out-of-home collection options, supporting parcel-locker, pick-up and consolidated-delivery models.
- 1,500+ parcel-locker banks (FY2025, Australia Post) demonstrate the scale already achievable in alternative delivery infrastructure, benefiting retailers and parcel operators through route density.
- 12.8 million delivery points (FY2025, Australia Post) illustrate the national addressable last-mile footprint; profitability requires automation, route optimisation and high first-attempt delivery success.
Low-Emission Heavy Fleet Investment
- 127,229 kilometres of gazetted network access (FY2025, Australia) supported low and zero-emission heavy vehicles, improving the practical deployment case for fleet operators.
- 306.5 million litres of fuel savings (June 2025, Australia) were attributed to Performance Based Standards vehicles, demonstrating material productivity and fuel-efficiency economics.
- 19% projected transport-emissions reduction by 2040 (Australia) under current policy settings increases the strategic value of low-emission fleet capability and charging partnerships.
Intermodal and Specialist Contract Logistics
- 53% of the major public infrastructure pipeline (2025 report, Australia) is transport-related, supporting project logistics, equipment movement and construction supply chains.
- 3.7% container-throughput growth (FY2025, Port of Melbourne) supports intermodal rail, drayage, customs and near-port warehousing revenue pools.
- 20,000 square metres of new temperature-capable facility space (South Australia) signals monetisable expansion in life-sciences, healthcare and cold-chain contract logistics.
CHAPTER 9 - Competitive Landscape
Competitive Landscape Overview
The market is fragmented, with the top 10 operators representing approximately 27% of the locked 2025 revenue pool. Competition combines national asset networks, specialised regional carriers, parcel infrastructure, rail capacity and global 3PL capabilities, while entry barriers rise in scale-sensitive contracts requiring technology, warehousing, safety compliance and nationwide service reliability.
Market Share Distribution
Top 5 Players
Market Dynamics
8 new entrants in the past 5 years, indicating strong market attractiveness and growth potential.
Company Name | Market Share | Headquarters | Founding Year | Core Market Focus |
|---|---|---|---|---|
Australia Post | 5.9% | Melbourne, Australia | 1809 | Parcel delivery, express services and national distribution |
Linfox | 5.1% | Melbourne, Australia | 1956 | Transport, warehousing and integrated supply-chain logistics |
Toll Group | 3.5% | Melbourne and Singapore | 1888 | Contract logistics, forwarding, transport and supply-chain services |
Qube Holdings | 3.2% | Sydney, Australia | 2006 | Ports, intermodal, bulk and integrated logistics |
Aurizon | 3.0% | Brisbane, Australia | 2010 | Rail freight, network access and bulk logistics |
Team Global Express | 2.1% | Melbourne, Australia | 2000 | Express freight, parcels and national road distribution |
DHL Supply Chain Australia | 1.6% | - | - | Contract logistics, warehousing, fulfilment and sector solutions |
Pacific National | 1.6% | North Sydney, Australia | - | Intermodal and bulk rail freight |
K&S Corporation | 0.5% | Truganina, Australia | 1945 | Road, rail and contract distribution services |
Centurion | 0.4% | Perth, Australia | 1971 | Resources logistics, road freight, warehousing and heavy haulage |
Cross Comparison Parameters
The report provides detailed cross-comparison of key players across 10 performance parameters to identify competitive strengths and weaknesses.
Revenue per Tonne-kilometre
Warehouse Utilization Rate
Revenue Growth
EBITDA Margin
Analysis Covered
Market Share Analysis:
Benchmarks provider revenue shares across fragmented national logistics service pools.
Cross Comparison Matrix:
Compares utilization, pricing, growth and margins across leading logistics operators.
SWOT Analysis:
Assesses scale advantages, asset intensity, technology readiness and concentration risks.
Pricing Strategy Analysis:
Evaluates contract pricing, fuel adjustments, surcharges and value-added service premiums.
Company Profiles:
Profiles service portfolios, network footprints, ownership, positioning and strategic priorities.
CHAPTER 10 - REPORT TOC
Table of Contents
Market Assessment Phase
Supply-side and competitive intelligence covering market sizing, segmentation, competitive dynamics, regulatory landscape, and future forecasts.
Go-To-Market Strategy Phase
15 chapters
Entry strategy evaluation, execution roadmap, partner recommendations, and profitability outlook.
Survey Phase
8 chapters
Demand-side primary research conducted through structured interviews and online surveys with end users across priority metros and Tier 2/3 cities to capture consumption behavior, unmet needs, and purchase drivers.
Complete Report Coverage
201+ detailed sections covering every aspect of the market
143
Assessment Sections
58
Strategy Sections
CHAPTER 11 - Our Approach
Research Methodology
Desk Research
- Mapped Australian logistics provider revenues
- Reviewed multimodal national freight statistics
- Analysed port and parcel throughput
- Benchmarked logistics operator financial filings
Primary Research
- Interviewed logistics chief operating officers
- Consulted freight forwarding commercial directors
- Engaged warehouse operations managers
- Surveyed shipper supply-chain directors
Validation and Triangulation
- Validated findings across 388 respondents
- Reconciled revenue and freight volumes
- Cross-checked service pricing benchmarks
- Stress-tested utilisation and mix assumptions
CHAPTER 12 - FAQ
FAQs
Still have questions?
Our research team is here to help you find the right solution
CHAPTER 13 - Related Research
Explore Related Reports
Expand your market intelligence with complementary research across regions and adjacent markets.
Regional/Country ReportsRelated market analysis across key regions
Related market analysis across key regions
- Canada Logistics Market Size, Share & Forecast, By Service Type, Mode of Transport & End-Use Industry, 2026–2032
- Pakistan Logistics Market Size, Share & Forecast, By Service Type, Mode of Transport & End-Use Industry, 2026-2031
- South Korea Logistics Market
- Philippines Logistics Market
- Malaysia Logistics Market
Adjacent ReportsRelated markets and complementary research
Related markets and complementary research
- Germany Automated Warehousing Market
- Singapore Freight Management Technology Market
- Bahrain Contract Logistics Market Report Size, Share, Growth Drivers, Trends, Opportunities & Forecast 2025–2030
- Mexico Temperature-Controlled Distribution Market
- Thailand Customs Brokerage Services Market
500+
Market Research Reports
50+
Countries Covered
15+
Industry Verticals