


Global Augmented Reality Market Outlook to 2030
Region:Global
Author(s):Rishabh Verma
Product Code:KENGR013
September 2024
96
About the Report
Global Augmented Reality Market Overview
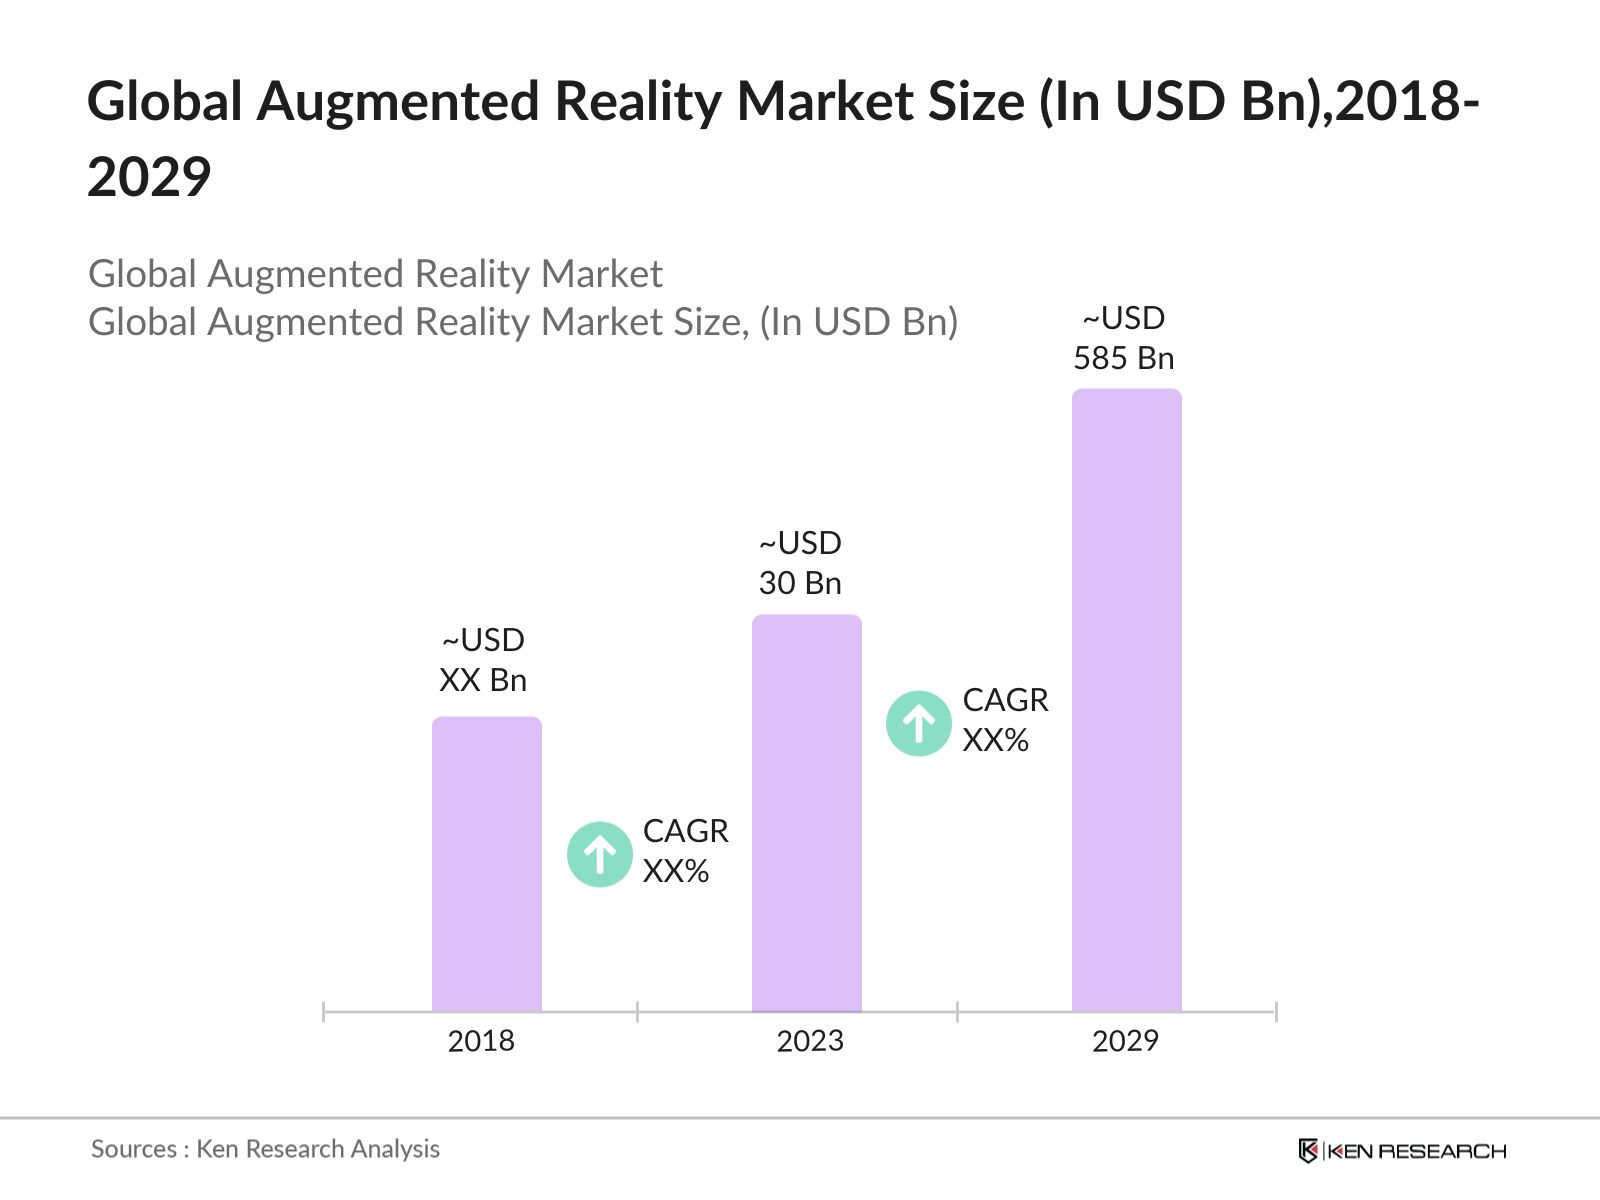
- Global Augmented Reality (AR) Market reached a size of USD 30 billion in 2023. This growth is driven primarily by increasing adoption in various sectors such as retail, healthcare, and education, where AR enhances user experiences and operational efficiency.
- Major players in the market include Meta, Microsoft Corporation, Xreal and TCL RayNeo. These companies have been pivotal in advancing AR technology through continuous innovation and strategic investments. Their extensive developer networks and resources have enabled widespread adoption and innovation within the AR space.
- In 2023, Microsoft made a four-year contract worth $19.8 million from the U.S. Space Forces Space Systems Command to develop AR space simulation environment built on HoloLens technology. The I3E will utilize Microsoft's Azure cloud infrastructure and HoloLens technology to create an augmented reality simulation that enables users to interact with space-based objects.
Global Augmented Reality Current Market Analysis
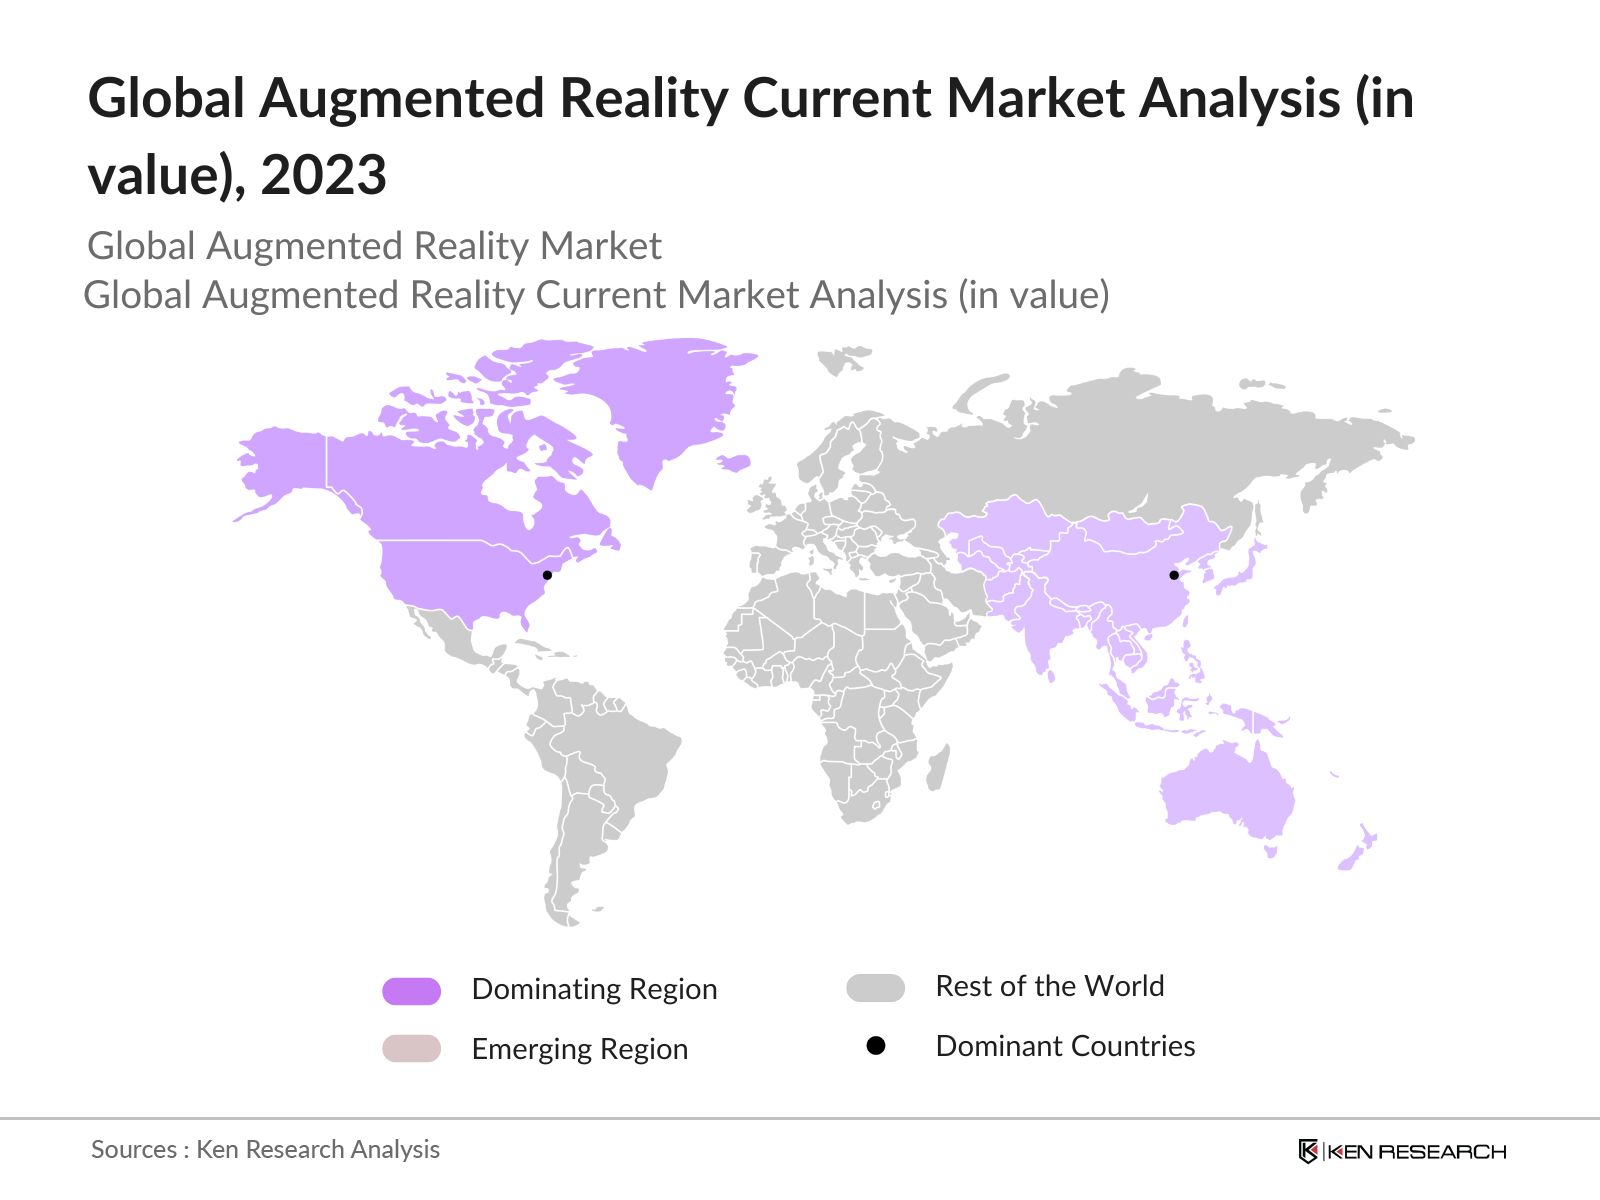
- North America as dominant region: North America dominates the global augmented reality (AR) market due to technological advancements, significant investments, and an extensive consumer base. Google's strategic partnership with Magic Leap exemplifies this, combining expertise to create immersive experiences. The region's advanced infrastructure, highlighted by Xfinity's 10 Gbps internet speed, supports seamless AR integration. Strong demand from gaming, healthcare, and retail sectors, with popular AR games like Ingress and Harry Potter: Wizards Unite, further bolsters market growth, ensuring North America's continued leadership.
- APAC as emerging region: The Asia-Pacific region is rapidly emerging as a key player in the global augmented reality (AR) market, driven by technological advancements, investments, and a growing base of tech-savvy consumers. Countries like China, Japan, South Korea, and India are at the forefront, with Sony topping Japan's electronic goods ranking in 2023.The region's booming smartphone market and high-speed internet, including Hong Kong's 265.17 Mbps broadband, support AR growth. Government initiatives like Digital India and Make in India further foster AR market expansion.
- United States as the dominant country: The United States leads the global augmented reality (AR) market with a robust tech ecosystem and significant investment in innovation. In 2023, around 83.1 Mn Americans, or 15% of the population, use AR monthly. Tech giants like Apple drive AR advancements, integrating it into devices and developing products like Apple Glasses. AR's versatility spans entertainment, healthcare, retail, and more. Government support and top-tier research further bolster the U.S. position, ensuring continued AR innovation and future advancements.
Global Augmented Reality Market Segmentation
The Global Augmented Reality Market can be segmented based on several factors:
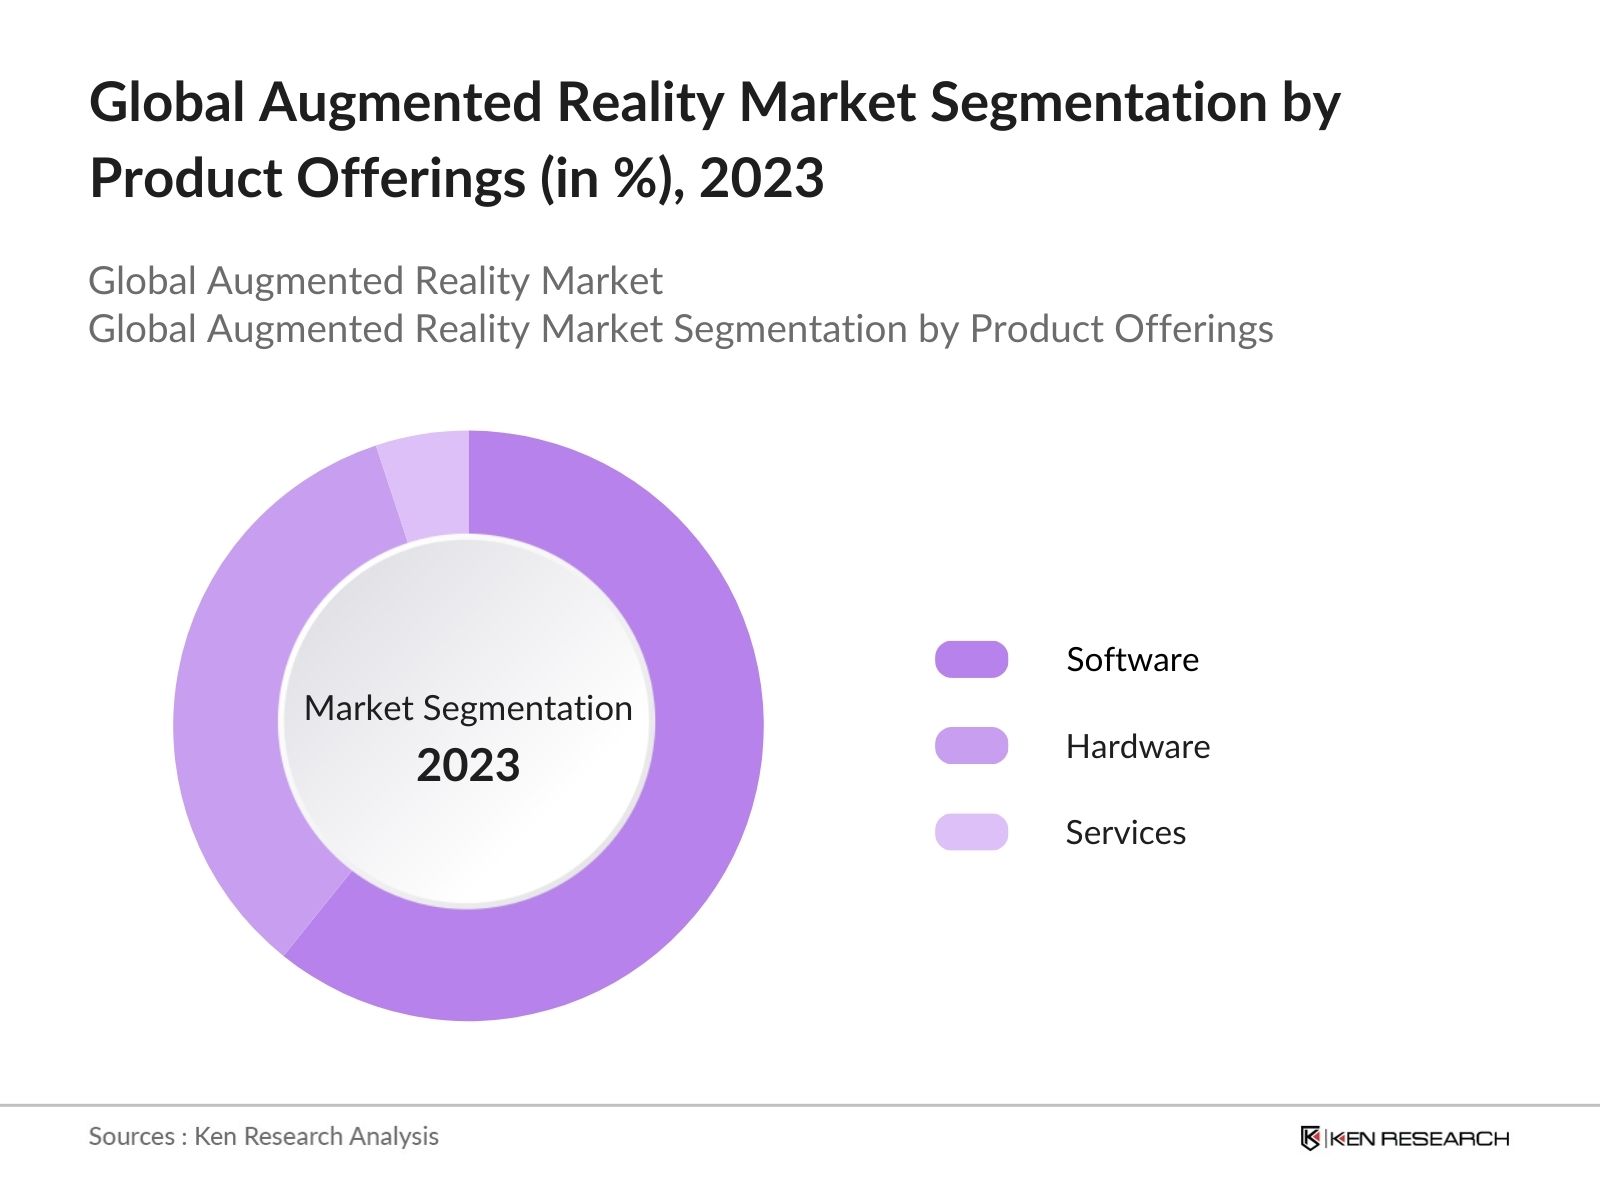
By Product Offering: Global augmented reality market is segmented by product offerings into hardware, software & services. In 2023, software holds the largest share by value. Software solutions can be easily updated, modified, and scaled across different platforms and devices, including smartphones, tablets, and AR glasses. This flexibility allows for widespread adoption and integration into various consumer and enterprise applications.
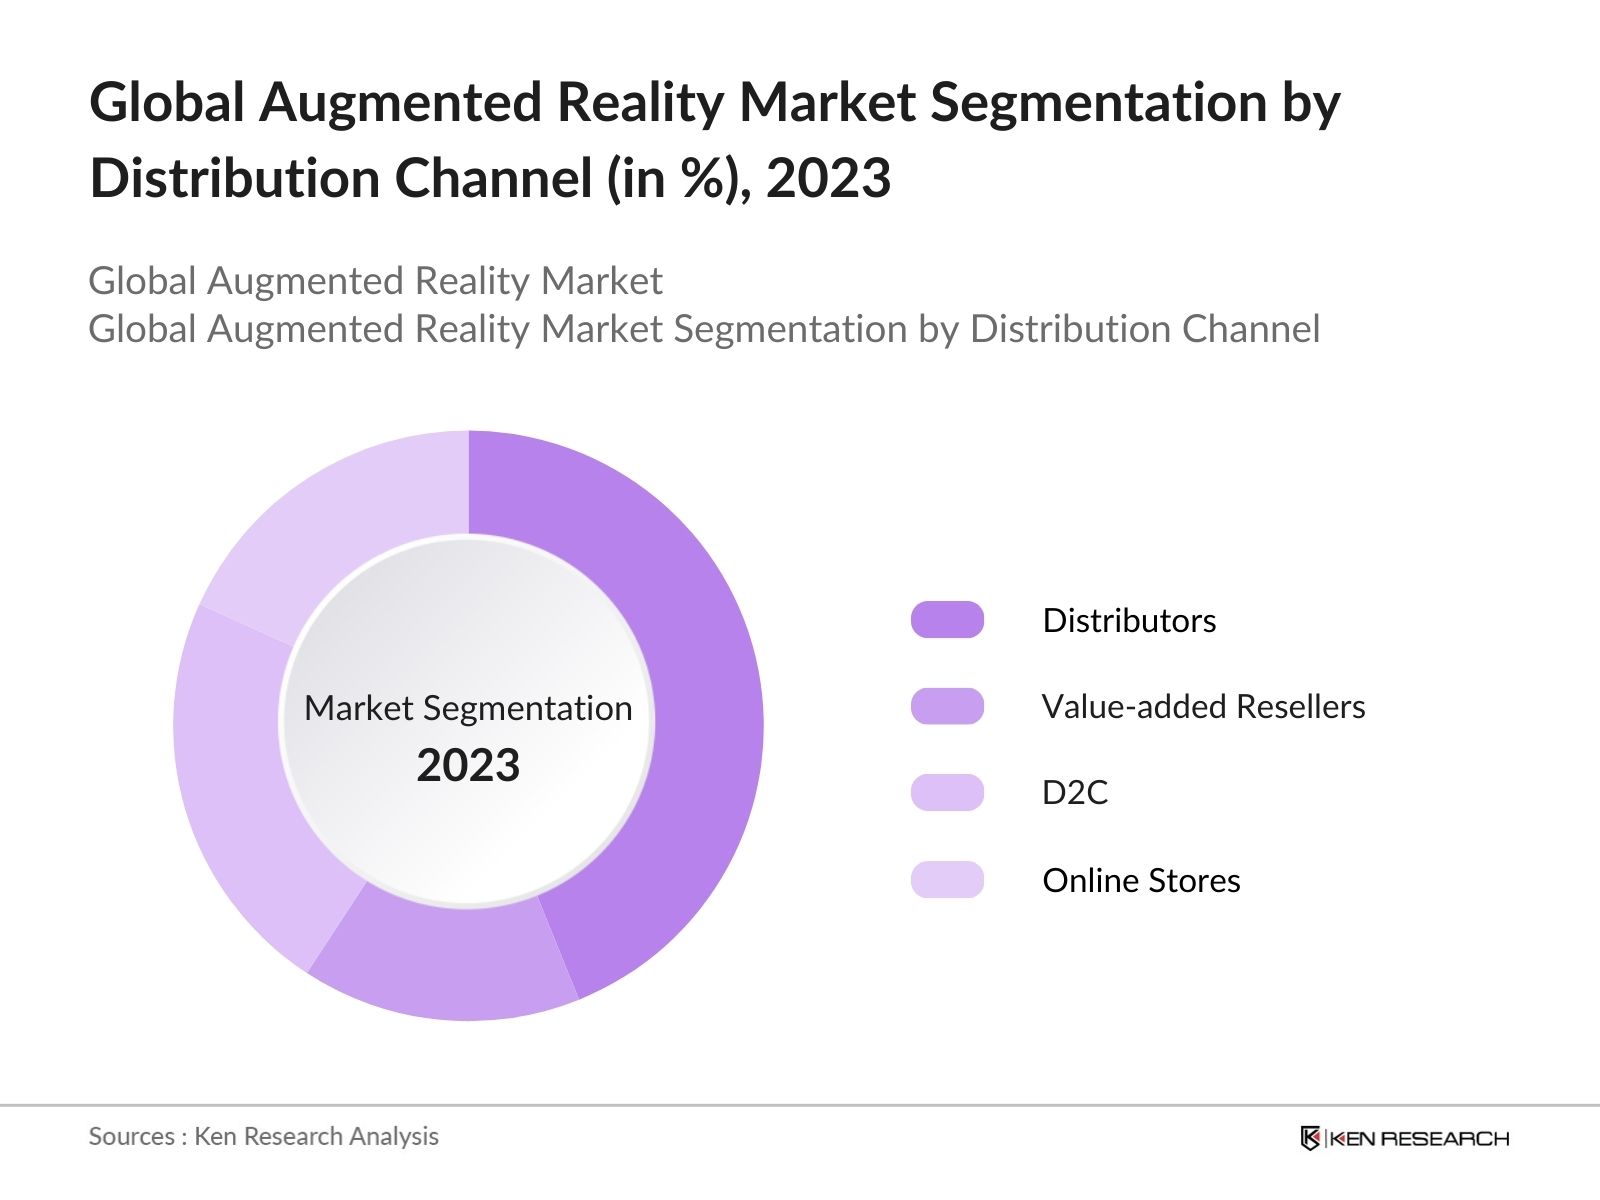
By Distribution Channel: Global augmented reality is segmented by distribution channel into distributors, value-added resellers, D2C and online stores. In 2023, Distributors are the dominant sub-segment in terms of value. Distributors help AR products, both hardware and software, reach a broader market by leveraging their established networks and channels. This accessibility is particularly important for expanding AR technology into new geographic areas and customer segments.
By End-Users: Global augmented reality market is segmented by end-users into commercial, industrial/enterprise and recreational. In 2023, Industrial/Enterprise is the dominant sub-segment by value. AR technology offers significant efficiency and productivity benefits for industrial and enterprise applications. It can streamline complex processes, enhance precision in tasks, and reduce errors. Hence, their dominance in the market
Global Augmented Reality Market Competitive Landscape
|
Global Augmented Reality Cross Comparison (Hardware) |
||
|
Name of Company |
Headquarter |
Establishment Year/Vintage |
|
Microsoft Corporation |
Redmond, Washington, The US |
1975 |
|
Magic Leap, Inc. |
Plantation, Florida, The US |
2010 |
|
Vuzix Corporation |
Rochester, New York, The US |
1996 |
|
Seiko Epson Corp. |
Suwa, Nagano, Japan |
1942 |
|
Meta Platforms, Inc. |
Menlo Park, California, The US |
2004 (Founded as Facebook) |
|
Rokid |
Beijing, China |
2014 |
|
TCL-RayNeo |
Shenzhen, Guangdong, China |
1998 (Founded as TCL Corporation) |
|
Global Augmented Reality Cross Comparison (Software) |
||
|
Name of Company |
Headquarters |
Establishment Year/Vintage |
|
PTC |
Needham, Massachusetts, USA |
1985 |
|
Unity Technologies |
San Francisco, California, USA |
2004 |
|
Epic Games, Inc. |
Cary, North Carolina, USA |
1991 |
|
Scope AR |
San Francisco, CA, USA |
2011 |
|
TeamViewer |
Gppingen, Germany |
2005 |
|
Zappar Limited |
London, United Kingdom |
2011 |
|
INDE (Interactive and Digital Entertainment Ltd.) |
Oxford, United Kingdom |
2011 |
|
Sony Corporation |
Tokyo, Japan |
1946 |
|
Librestream Technologies |
Winnipeg, Canada |
2003 |
- Microsoft Corporation: In 2022, Microsoft announced a collaboration with Volkswagen to integrate HoloLens 2 in its vehicle using moving platform mode showcasing traffic information, weather conditions, shopping recommendations and architectural highlights along the route. Microsoft plans to expand this "moving platform" technology to other vehicles like trains and elevators in the future.
- Magic Leap: In 2022, Magic Leap announced a partnership with NavVis to integrate its NavVis VLX mobile mapping system and NavVis IVION Enterprise spatial data platform to its AR for building AR products for manufacturing customers.
- Seiko Epson Corp: In 2022, Seiko Epson Corp launched Moverio BT-45C and BT-45CS AR smart glasses. They feature Si-OLED technology, a proprietary optical engine, and a binocular see-through Full HD display with a 34 field-of-view. Both models are built tough to withstand demanding work environments, with high shock and dust resistance.
Global Augmented Reality Industry Analysis
Global Augmented Reality Market Growth Drivers:
- Increasing Investment & Innovation: Major technology companies like Meta, Apple, and Google are investing heavily in AR research and development. This fuels innovation, leading to more powerful AR hardware and software with broader functionalities. In 2022 Meta launched Project Cambria, also known as the Meta Quest Pro, features advanced capabilities including eye-tracking and full-color passthrough. Innovations like these boost markets growth.
- Industry Adoption Across Sectors: AR technology is being adopted across sectors such as retail (AR try-on), healthcare (surgical planning), and manufacturing (AR-guided assembly), enhancing productivity and customer experience. When a technician looks at a piece of equipment through AR glasses or a mobile device, they can see live data such as temperature, pressure, and operational status displayed next to the relevant parts.
- Improved Hardware Affordability and Accessibility: As AR technology advances, hardware costs are decreasing, increasing accessibility for consumers and businesses. The Meta Quest 2 headset is a popular and affordable entry point for VR and AR experiences. In 2024, Meta dropped the price for Quest 2 128 GB model to $199, making it even more attractive to a wider audience.
Global Augmented Reality Market Challenges:
- Limited Processing Power and Battery Life: Current AR devices often have limitations in processing power and battery life, which restricts their usage during extended sessions. Early AR glasses had a limited field of view and short battery life, impacting user experience.
- Privacy Concerns and Data Security: The collection and use of personal data in AR applications raise privacy concerns, necessitating robust security protocols. Unauthorized access and data breaches can erode user trust. General Data Protection Regulation (GDPR) in Europe highlights the importance of transparent data collection practices & is regarded as the toughest data security laws in the world.
Global Augmented Reality Future Market Outlook
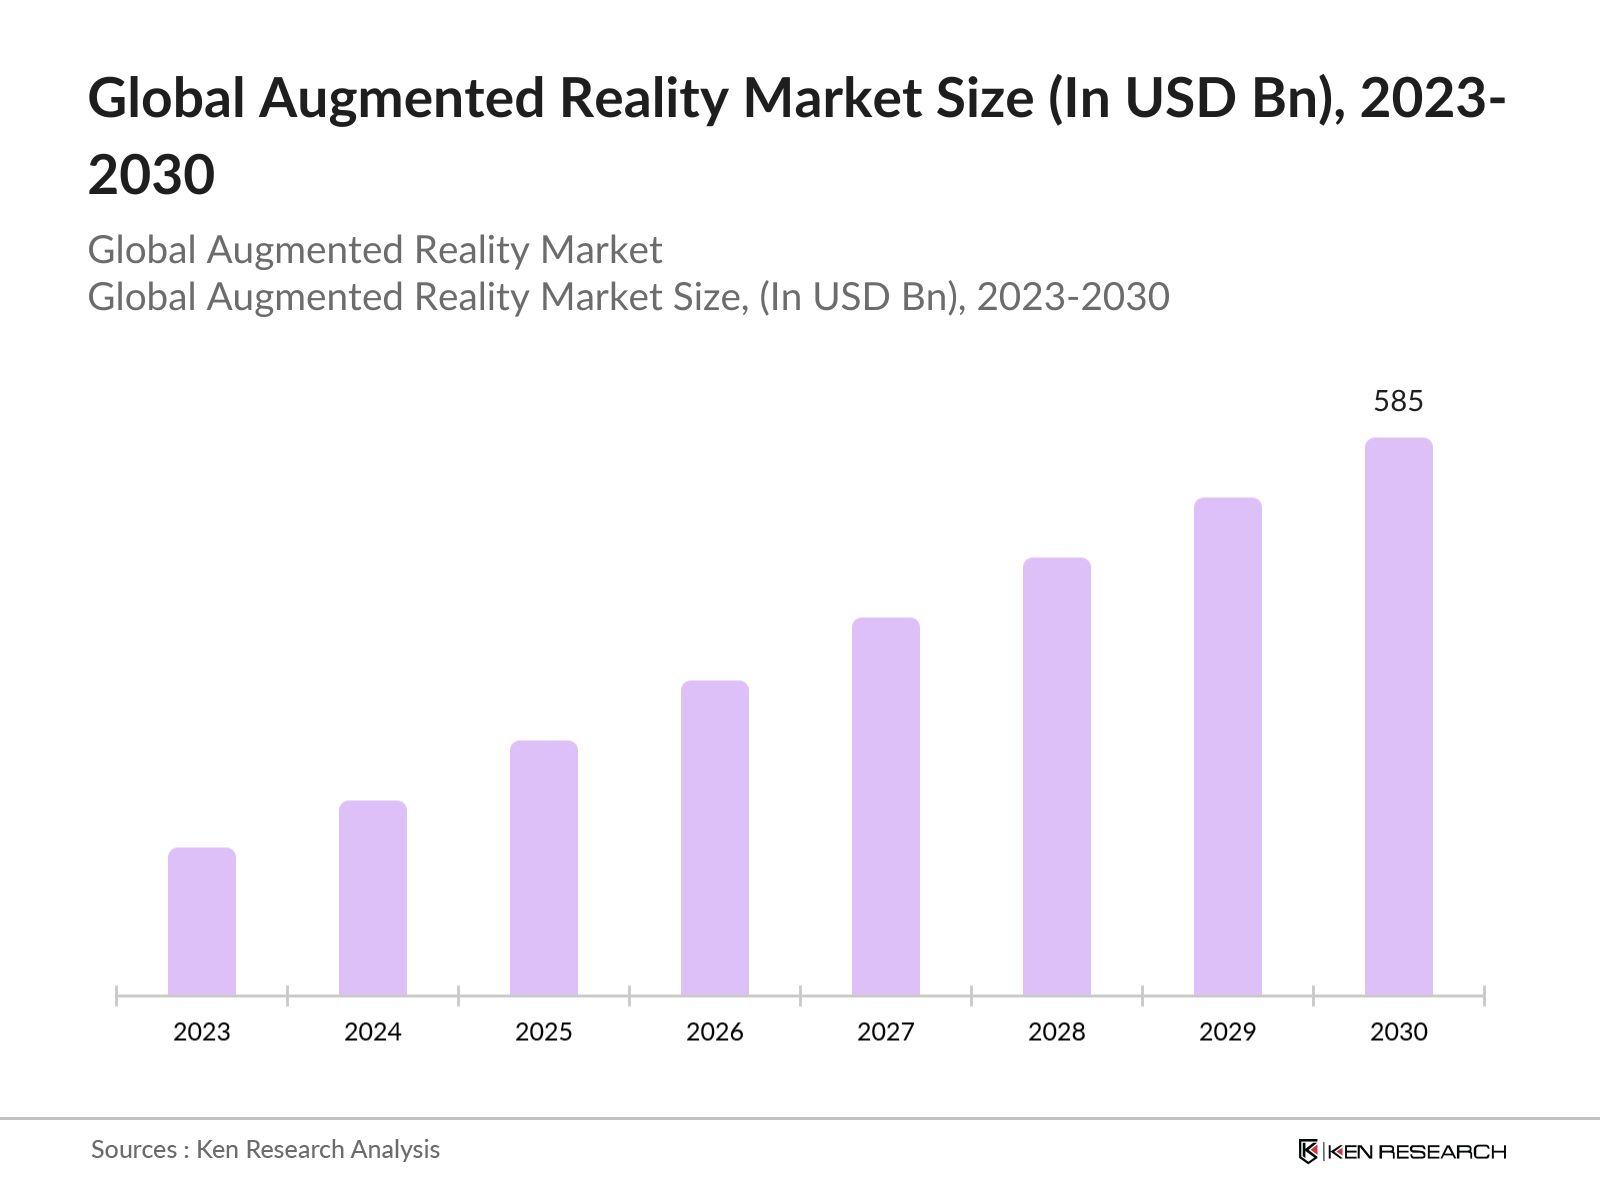
Global Augmented Reality market is expected to show significant growth. The market is expected to reach USD 585 Bn driven by advancements in hardware, increased 5G adoption, and growing demand for immersive experiences in sectors like retail, gaming, and education.
Future Market Trends
- Enhanced AR Applications in Smart Cities: By 2029, AR is expected to play a crucial role in smart city initiatives, integrating with IoT and AI to provide real-time data visualization and urban planning tools. Municipalities are projected to invest significantly in AR solutions for public safety, transportation management, and infrastructure monitoring.
- Widespread Use of AR in Remote Work and Collaboration: As remote work becomes more prevalent; AR is anticipated to be a key technology for enhancing virtual collaboration. Large enterprises will use AR for virtual meetings, training, and team collaboration, driven by the need for more interactive and immersive remote work solutions. This trend will be supported by continued advancements in AR software and hardware, as well as growing investment in digital workplace technologies.
Scope of the Report
|
By Region |
North America Europe APAC Latin America MEA |
|
By Product Offerings |
Software Hardware Services |
|
By Distribution Channel |
Distributors Value-added Resellers (VARs) D2Cs Online Stores |
|
By End-Users |
Commercial Industrial/Enterprises Recreational |
Products
Key Target Audience Organizations and Entities who can benefit by Subscribing This Report:
AR Hardware Manufacturers
AR Software Developers
Entertainment and Media Companies
Telecommunications Companies
Security and Surveillance Companies
Investors & VC Firms
Banks and Financial Institution
Government & Regulatory Bodies (Federal Communications Commission, European Commission)
Time Period Captured in the Report:
Historical Period: 2018-2023
Base Year: 2023
Forecast Period: 2023-2029
Companies
Players Mentioned in the Report:
Meta Platforms Inc.
Microsoft Corporation
Xreal
TCL-RayNeo
Rokid
Seiko Epson Corp
Magic Leap Inc.
RealWear
Vuzix Corporation
PTC
Unity Technologies
Epic Games, Inc.
Scope AR
TeamViewer
Zappar Limited
INDE (Interactive and Digital Entertainment Ltd.)
Sony Corporation
Librestream Technologies
Table of Contents
1. Executive Summary
1.1 Global Software Market
1.2 Global Augmented Reality Market
2. Global Overview
2.1 Overview of Global Economics
2.2 Overview of Global Software Industry
2.3 Global Software Market (AR Development Platforms, AR Content Management Systems, Collaboration Tools) Sales
2.4 Global Software Infrastructure (Public and Private)
3. Global Augmented Reality Market Overview
3.1 Global Augmented Reality Market Ecosystem
3.2 Global Augmented Reality Market Value Chain
3.3 Global Augmented Reality Market Product Taxonomy
4.Global Augmented Reality Market Size (in USD Bn), 2018-2023
5. Global Augmented Reality Market Segmentation (in value %), 2018-2023
5.1 Global Augmented Reality Market Segmentation by Region (in value %), 2018-2023
5.2 Global Augmented Reality Market Segmentation by Product Offerings (in value%), 2018-2023
5.3 Global Augmented Reality Market Segmentation by End-Users (in value %), 2018-2023
6.Global Augmented Reality Market Competition Landscape
6.1Global Augmented Reality Market Share of AR Players with their operating segment - Software
6.2Global Augmented Reality Market Cross Comparison for AR Companies - Hardware Players
6.3Global Augmented Reality Market Cross Comparison for AR Companies - Software Players
6.4Global Augmented Reality Market Product Comparison basis of Major AR Models (Consumer)
7.Global Augmented Reality Market Dynamics
7.1 Global Augmented Reality Market Growth Drivers
7.2 Global Augmented Reality Market Challenges
7.3 Global Augmented Reality Market Recent Developments
7.4 Global Augmented Reality Market Case Studies
7.5 Global Augmented Reality Market Complexity Matrix
7.6 Global Augmented Reality Market Regulatory Framework
8.Global Augmented Reality Future Market Size (in USD Bn), 2023-2029
9. Global Augmented Reality Future Market Segmentation (in value%), 2023-2029
9.1 Global Augmented Reality Future Market Segmentation by Region (in value %), 2023-2029
9.2 Global Augmented Reality Future Market Segmentation by Product Offerings (in value%), 2023-2029
9.3 Global Augmented Reality Future Market Segmentation by End-User (in value %), 2023-2029
10. Analyst Recommendations
Research Methodology
Step 1: Identification of Major Players
Identification of major players operating in AR market and mapping their product offerings. Building comprehensive ecosystem of Global & Regional players providing AR technology (Hardware/Software and Services).
Step: 2 Stakeholder Insights Through CATIs
CATIs with the key stakeholders in the industry to understand their operating and financial indicators including product portfolio, value chain & margins, product specifications, revenues, future strategies and other value-adding information. Later, our team adopted a bottom to top approach in order to evaluate the country-level and regional trends and shares by product offerings, by Distribution Channel and by End User. Market size was calculated on the basis of revenues of major players and their prevailing share in the global market.
Step: 3 Bottom-to-Top and Top-to-Bottom Approach
Bottom-to-Top & top-to-bottom approach in order to evaluate the overall revenue. Conducted sanity checking from Industry Veterans, Professionals, End Users and proxy variables, such as 5G penetration, technology adoption across different industries, consumer awareness, among others.
Frequently Asked Questions
01. How big is Global Augmented Reality Market?
Global Augmented Reality (AR) Market reached a size of USD 30 billion in 2023. This growth is driven primarily by increasing adoption in various sectors such as retail, healthcare, and education, where AR enhances user experiences and operational efficiency.
02 What is the future of Global Augmented Reality Market?
Global Augmented Reality Market is expected to reach USD 585 Bn driven by advancements in hardware, increased 5G adoption, and growing demand for immersive experiences in sectors like retail, gaming, and education.
03. What are challenges of Global Augmented Reality Market?
Challenges in Global Augmented Reality Market include limited processing power & battery, privacy concerns & data security and fragmented ecosystem. Current AR devices often have limitations in processing power and battery life, which restricts their usage during extended sessions.
04 Who are the major players in Global Augmented Reality Market?
Major players in the AR market include Meta, Microsoft Corporation, Xreal and TCL RayNeo. These companies have been pivotal in advancing AR technology through continuous innovation and strategic investments.
05 What are the growth drivers of the Global Augmented Reality Market?
Global Augmented Reality Market is propelled by factors such as increasing investment & innovation, industry adoptions across sectors & hardware affordability. Major technology companies like Meta, Apple, and Google are investing heavily in AR research and development
Why Buy From Us?
 Framework")
What makes us stand out is that our consultants follows Robust, Refine and Result (RRR) methodology. i.e. Robust for clear definitions, approaches and sanity checking, Refine for differentiating respondents facts and opinions and Result for presenting data with story

We have set a benchmark in the industry by offering our clients with syndicated and customized market research reports featuring coverage of entire market as well as meticulous research and analyst insights.

While we don't replace traditional research, we flip the method upside down. Our dual approach of Top Bottom & Bottom Top ensures quality deliverable by not just verifying company fundamentals but also looking at the sector and macroeconomic factors.

With one step in the future, our research team constantly tries to show you the bigger picture. We help with some of the tough questions you may encounter along the way: How is the industry positioned? Best marketing channel? KPI's of competitors? By aligning every element, we help maximize success.

Our report gives you instant access to the answers and sources that other companies might choose to hide. We elaborate each steps of research methodology we have used and showcase you the sample size to earn your trust.

If you need any support, we are here! We pride ourselves on universe strength, data quality, and quick, friendly, and professional service.