
Global Bioethanol Market Outlook 2030
Region:Global
Author(s):Shivani
Product Code:KROD7972
Region:Global
Author(s):Shivani
Product Code:KROD7972
October 2024
88
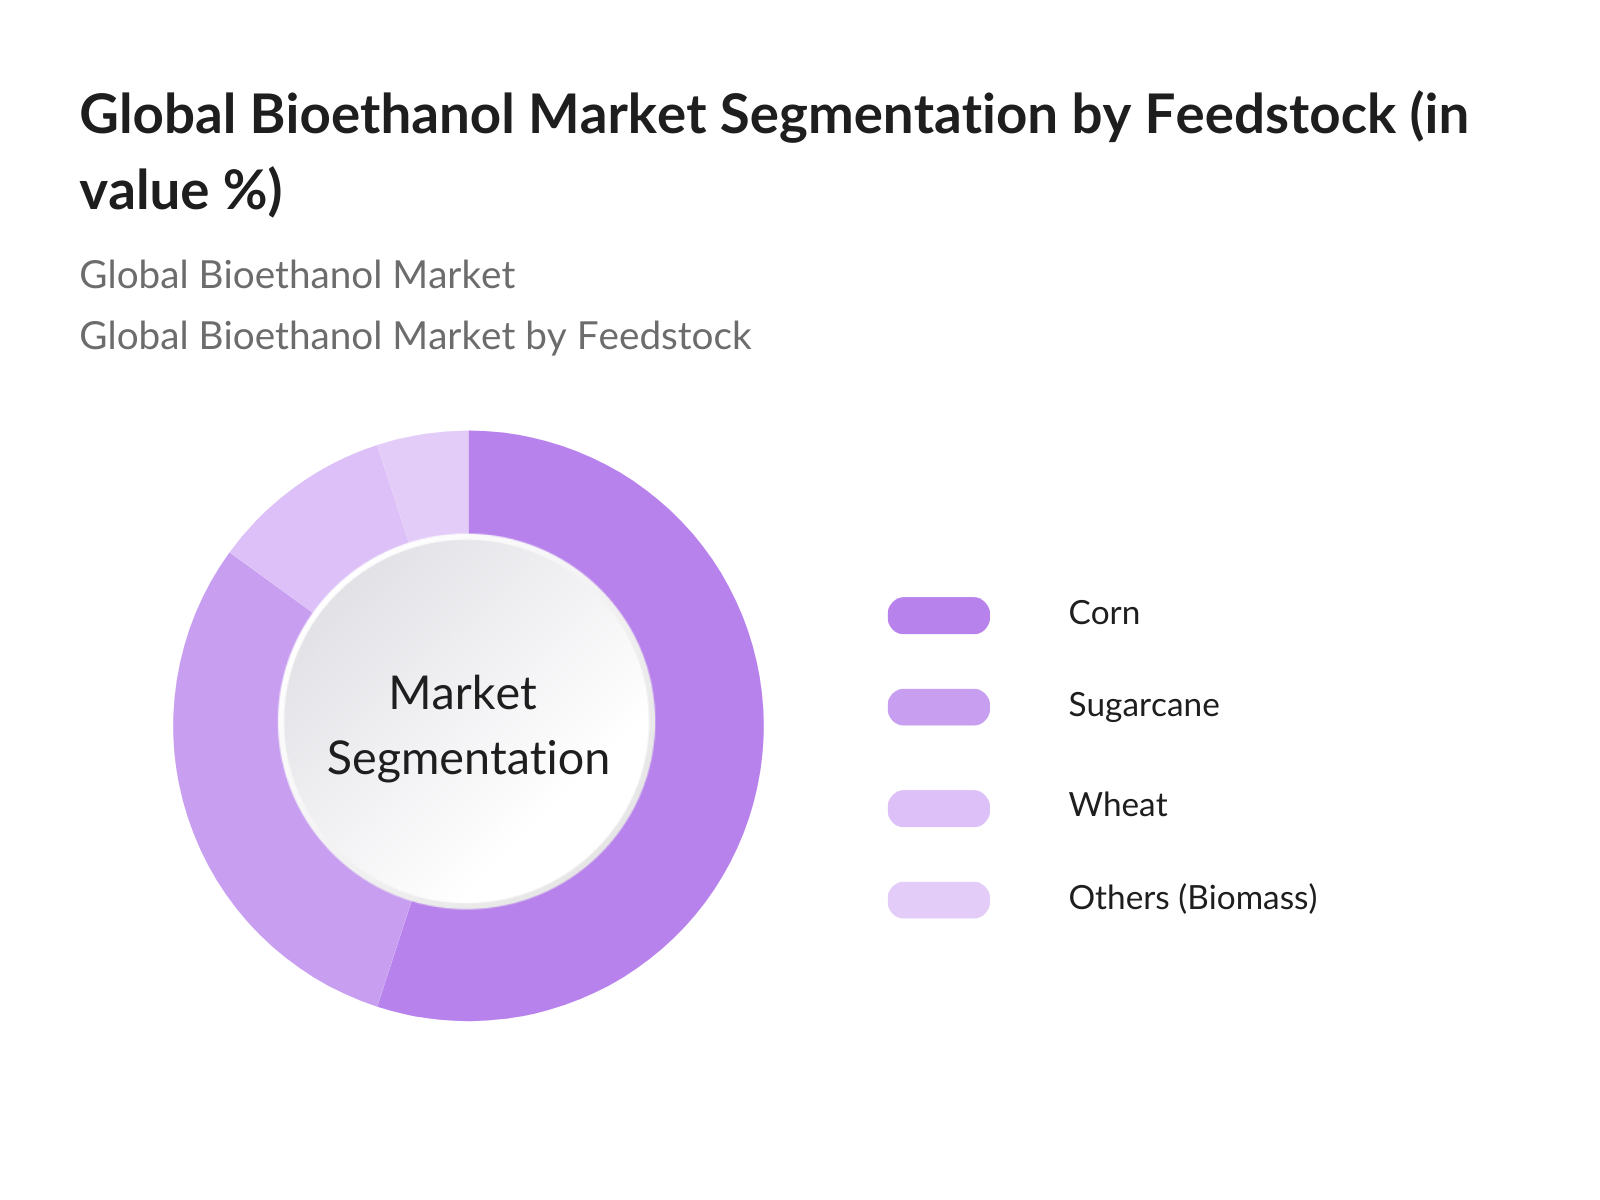
By Feedstock: The global bioethanol market is segmented by feedstock into sugarcane, corn, wheat, and others such as lignocellulosic biomass. Corn-based ethanol dominates the market due to its vast cultivation in the U.S., which is the world's largest producer of bioethanol. The infrastructure in the U.S. supports large-scale bioethanol production, and the country's extensive ethanol blending policies further solidify corn's dominance in this segment. Sugarcane-based ethanol also holds a substantial share, driven primarily by Brazil, where sugarcane production is highly efficient and integrated into bioethanol production systems.
|
Feedstock |
Market Share (2023) |
|---|---|
|
Corn |
55% |
|
Sugarcane |
30% |
|
Wheat |
10% |
|
Others (Biomass) |
5% |
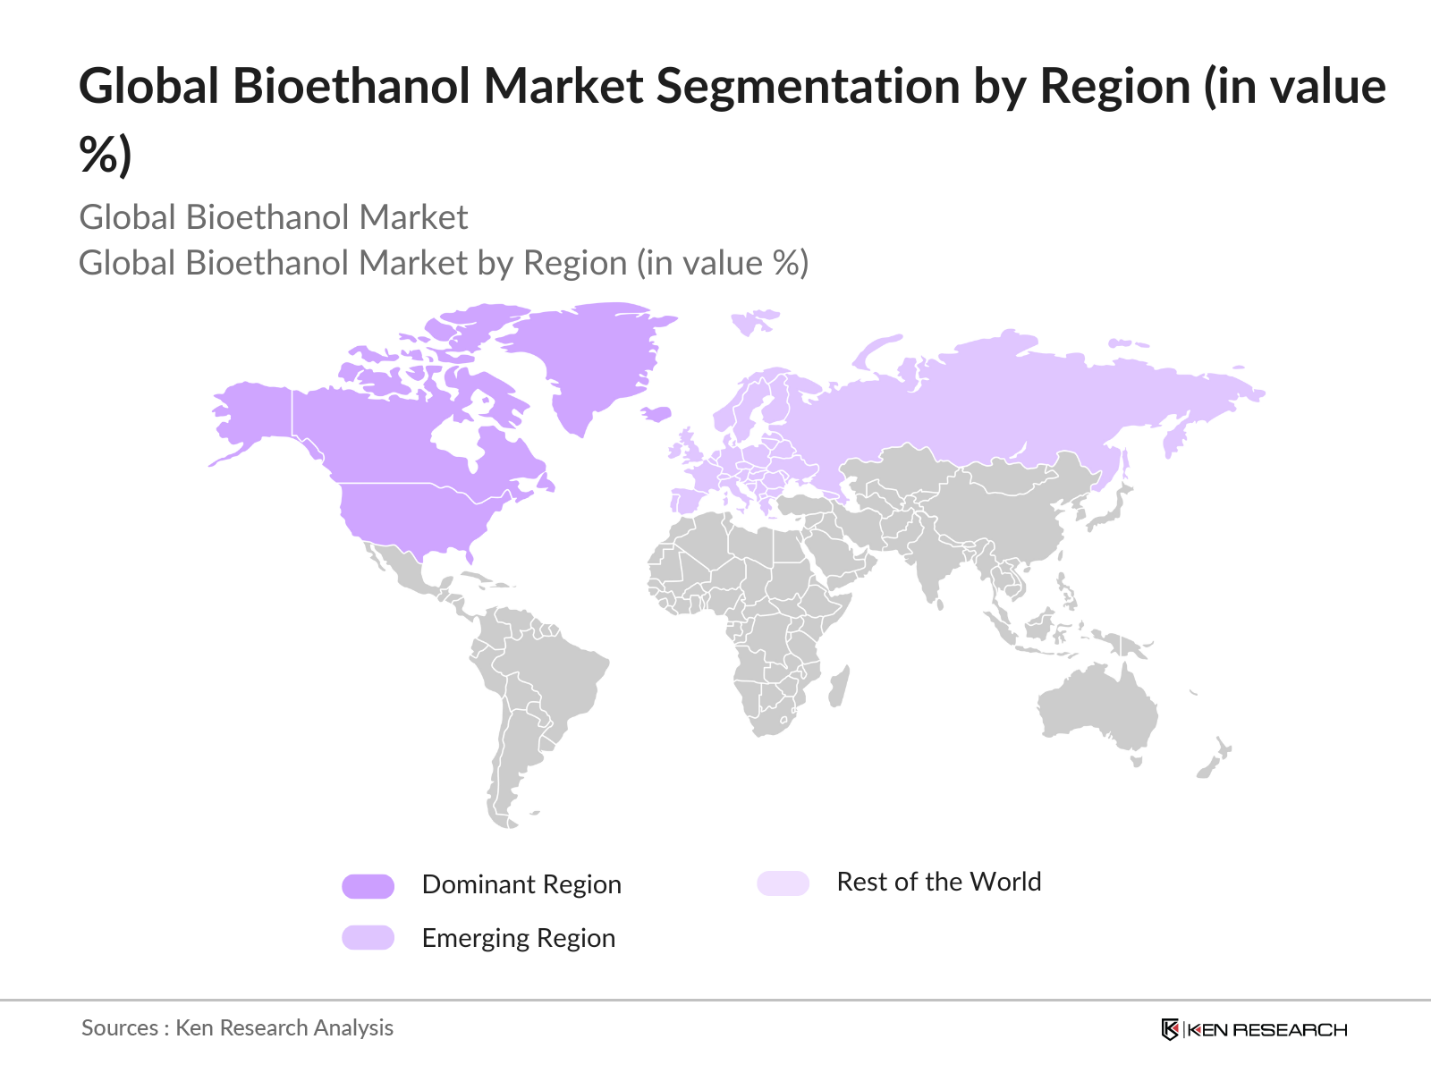
By Region: The global bioethanol market is dominated by North America, Europe, Asia-Pacific, Latin America, and the Middle East & Africa. North America leads the market, supported by the U.S.s leadership in bioethanol production and consumption. The region benefits from a well-developed infrastructure and strong government mandates for ethanol use. Latin America, led by Brazil, also holds a significant market share due to its established sugarcane-based ethanol industry, which has gained recognition for its lower carbon footprint compared to other feedstocks.
|
Region |
Market Share (2023) |
|---|---|
|
North America |
45% |
|
Europe |
25% |
|
Latin America |
15% |
|
Asia-Pacific |
10% |
|
Middle East & Africa |
5% |
The global bioethanol market is highly competitive, with a few key players holding substantial market shares. Major players in the market include Archer Daniels Midland Company, POET LLC, and Green Plains Inc. These companies have established strong production capacities and benefit from access to key feedstocks, particularly corn and sugarcane. Strategic partnerships with government bodies and ongoing investments in technological advancements have allowed these companies to maintain their dominance in the market.
|
Company |
Establishment Year |
Headquarters |
Feedstock Source |
Production Capacity |
Strategic Partnerships |
R&D Investments |
Sustainability Practices |
Global Footprint |
|
Archer Daniels Midland Co. |
1902 |
USA |
Corn |
|||||
|
POET LLC |
1983 |
USA |
Corn |
|||||
|
Green Plains Inc. |
2004 |
USA |
Corn |
|||||
|
Valero Energy Corporation |
1980 |
USA |
Corn |
|||||
|
Razen S.A. |
2011 |
Brazil |
Sugarcane |
The global bioethanol market is expected to witness substantial growth in the coming years, driven by continuous government initiatives supporting renewable energy adoption, advancements in second-generation bioethanol production, and increased consumer awareness regarding carbon emissions. With major economies focusing on reducing their carbon footprints, bioethanol will play a crucial role in the global shift towards cleaner energy. Key markets like the U.S., Brazil, and China are expected to continue leading the market due to favorable policies and technological advancements in bioethanol production.
|
By Feedstock |
Sugarcane Corn Wheat Others |
|
By Application |
Transportation Power Generation Industrial Solvents Pharmaceutical & Cosmetics |
|
By End-Use Industry |
Automotive Energy & Power Chemicals Healthcare |
|
By Production Process |
Fermentation Synthetic Ethanol Enzymatic Hydrolysis |
|
By Region |
North America Europe Asia-Pacific Latin America Middle East & Africa |
Archer Daniels Midland Company
1.1 Definition and Scope
1.2 Market Taxonomy
1.3 Market Growth Rate
1.4 Market Segmentation Overview
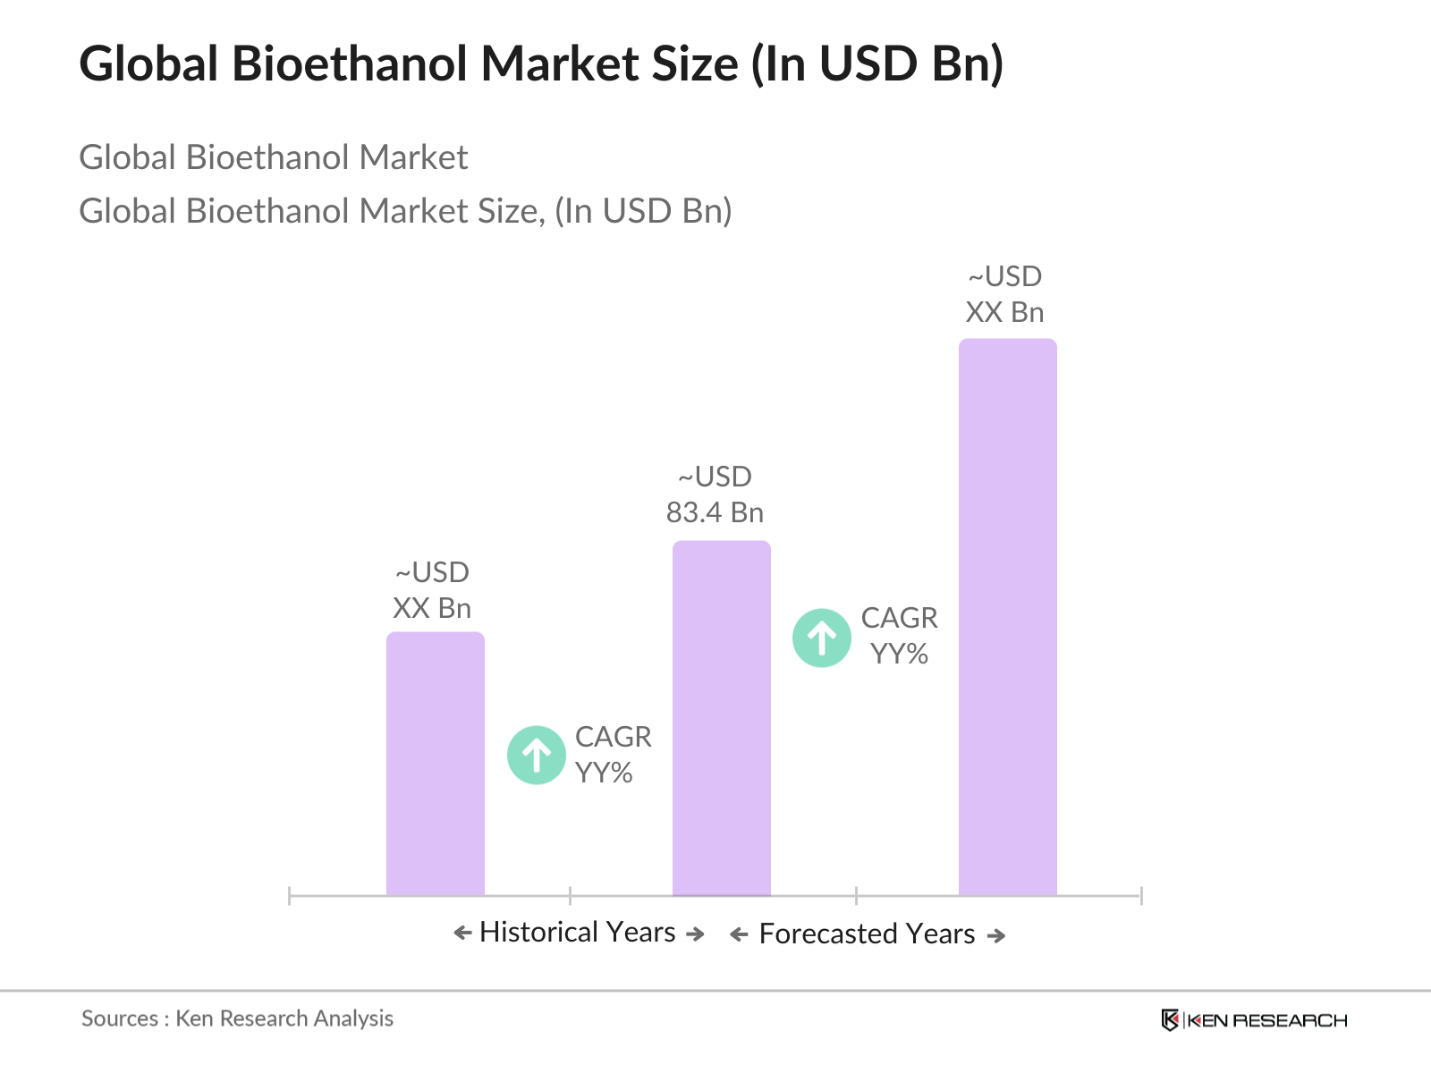
2.1 Historical Market Size
2.2 Year-On-Year Growth Analysis
2.3 Key Market Developments and Milestones
3.1 Growth Drivers
3.1.1 Rising Demand for Renewable Energy
3.1.2 Government Policies Supporting Ethanol Blending
3.1.3 Technological Advancements in Fermentation Processes
3.1.4 Rising Environmental Awareness (Carbon Footprint Reduction)
3.2 Market Challenges
3.2.1 High Production Costs (Feedstock Costs)
3.2.2 Infrastructure Limitations (Logistics and Storage)
3.2.3 Competition from Alternative Fuels
3.3 Opportunities
3.3.1 Expansion into Emerging Markets (Regional Market Penetration)
3.3.2 Development of Second-Generation Bioethanol (Cellulosic Ethanol)
3.3.3 Integration with Carbon Capture and Storage (CCS)
3.4 Trends
3.4.1 Bioethanol as a Feedstock for Bioplastics
3.4.2 Increase in Flex-Fuel Vehicles Adoption
3.4.3 Sustainable Bioethanol Production Practices
3.5 Regulatory Landscape
3.5.1 Ethanol Blending Mandates (Regional Ethanol Blending Policies)
3.5.2 Incentives for Bioethanol Producers
3.5.3 Emission Reduction Targets (Renewable Energy Directives)
3.6 SWOT Analysis
3.7 Stakeholder Ecosystem (Feedstock Suppliers, Producers, Distributors)
3.8 Porters Five Forces
3.9 Competition Ecosystem
4.1 By Feedstock (In Value %)
4.1.1 Sugarcane
4.1.2 Corn
4.1.3 Wheat
4.1.4 Others (e.g., Lignocellulosic Biomass)
4.2 By Application (In Value %)
4.2.1 Transportation (E10, E85, Flex-Fuel Vehicles)
4.2.2 Power Generation
4.2.3 Industrial Solvents
4.2.4 Pharmaceutical & Cosmetics
4.3 By End-Use Industry (In Value %)
4.3.1 Automotive
4.3.2 Energy and Power
4.3.3 Chemicals
4.3.4 Healthcare
4.4 By Production Process (In Value %)
4.4.1 Fermentation
4.4.2 Synthetic Ethanol
4.4.3 Enzymatic Hydrolysis
4.5 By Region (In Value %)
4.5.1 North America
4.5.2 Europe
4.5.3 Asia-Pacific
4.5.4 Latin America
4.5.5 Middle East & Africa
5.1 Detailed Profiles of Major Companies
5.1.1 Archer Daniels Midland Company
5.1.2 POET LLC
5.1.3 Green Plains Inc.
5.1.4 Valero Energy Corporation
5.1.5 Flint Hills Resources
5.1.6 BP Biofuels
5.1.7 Royal Dutch Shell Plc
5.1.8 Abengoa Bioenergy
5.1.9 Pacific Ethanol, Inc.
5.1.10 Cargill, Inc.
5.1.11 Razen S.A.
5.1.12 Novozymes A/S
5.1.13 Clariant
5.1.14 Greenfield Global
5.1.15 CropEnergies AG
5.2 Cross Comparison Parameters (Revenue, Market Share, Production Capacity, Bioethanol Yield, Feedstock Source, R&D Investments, Strategic Partnerships, Global Footprint)
5.3 Market Share Analysis
5.4 Strategic Initiatives
5.5 Mergers & Acquisitions
5.6 Investment Analysis
5.7 Venture Capital Funding
5.8 Government Grants and Subsidies
5.9 Private Equity Investments
6.1 Biofuel Regulations (Biofuel Quotas and Subsidies)
6.2 Compliance and Certification Standards (Sustainability Standards, ISCC)
6.3 Environmental Standards (GHG Emissions Regulations)
7.1 Future Market Size Projections
7.2 Key Factors Driving Future Market Growth
8.1 By Feedstock (In Value %)
8.2 By Application (In Value %)
8.3 By End-Use Industry (In Value %)
8.4 By Production Process (In Value %)
8.5 By Region (In Value %)
9.1 TAM/SAM/SOM Analysis
9.2 Customer Cohort Analysis
9.3 Marketing Initiatives
9.4 White Space Opportunity Analysis
Disclaimer Contact UsThe first step in the research process is mapping the bioethanol market ecosystem by identifying major stakeholders, such as feedstock suppliers, producers, and government bodies. This step relies on extensive desk research utilizing proprietary databases and secondary sources to gather market-specific data.
In this phase, historical data on bioethanol production, consumption, and import-export flows are analyzed. Special attention is given to market dynamics such as feedstock availability, production cost, and technological innovations in bioethanol production.
Market hypotheses are tested through consultations with industry experts via structured interviews. These consultations provide key insights on emerging trends, production challenges, and competitive strategies.
Finally, the data is synthesized to provide a comprehensive and validated market outlook. This phase also involves detailed analysis of production capacities, market growth drivers, and strategic initiatives by major players.
The global bioethanol market is valued at USD 83.4 billion, driven by rising demand for renewable energy sources and government mandates supporting ethanol blending in transportation fuels.
Key challenges include high feedstock costs, competition from other biofuels, and the logistical constraints in bioethanol storage and transportation.
Major players include Archer Daniels Midland Company, POET LLC, Green Plains Inc., Valero Energy Corporation, and Razen S.A., leading the market through strong production capacities and technological advancements.
The market is propelled by government policies promoting ethanol blending, advancements in bioethanol production technologies, and the rising global focus on reducing carbon emissions from transportation.
 Framework")
What makes us stand out is that our consultants follows Robust, Refine and Result (RRR) methodology. i.e. Robust for clear definitions, approaches and sanity checking, Refine for differentiating respondents facts and opinions and Result for presenting data with story

We have set a benchmark in the industry by offering our clients with syndicated and customized market research reports featuring coverage of entire market as well as meticulous research and analyst insights.

While we don't replace traditional research, we flip the method upside down. Our dual approach of Top Bottom & Bottom Top ensures quality deliverable by not just verifying company fundamentals but also looking at the sector and macroeconomic factors.

With one step in the future, our research team constantly tries to show you the bigger picture. We help with some of the tough questions you may encounter along the way: How is the industry positioned? Best marketing channel? KPI's of competitors? By aligning every element, we help maximize success.

Our report gives you instant access to the answers and sources that other companies might choose to hide. We elaborate each steps of research methodology we have used and showcase you the sample size to earn your trust.

If you need any support, we are here! We pride ourselves on universe strength, data quality, and quick, friendly, and professional service.