
Global Electronic Shelf Label Market Outlook to 2030
Region:Global
Author(s):Naman Rohilla
Product Code:KROD1093
November 2024
82
About the Report
Global Electronic Shelf Label Market Overview
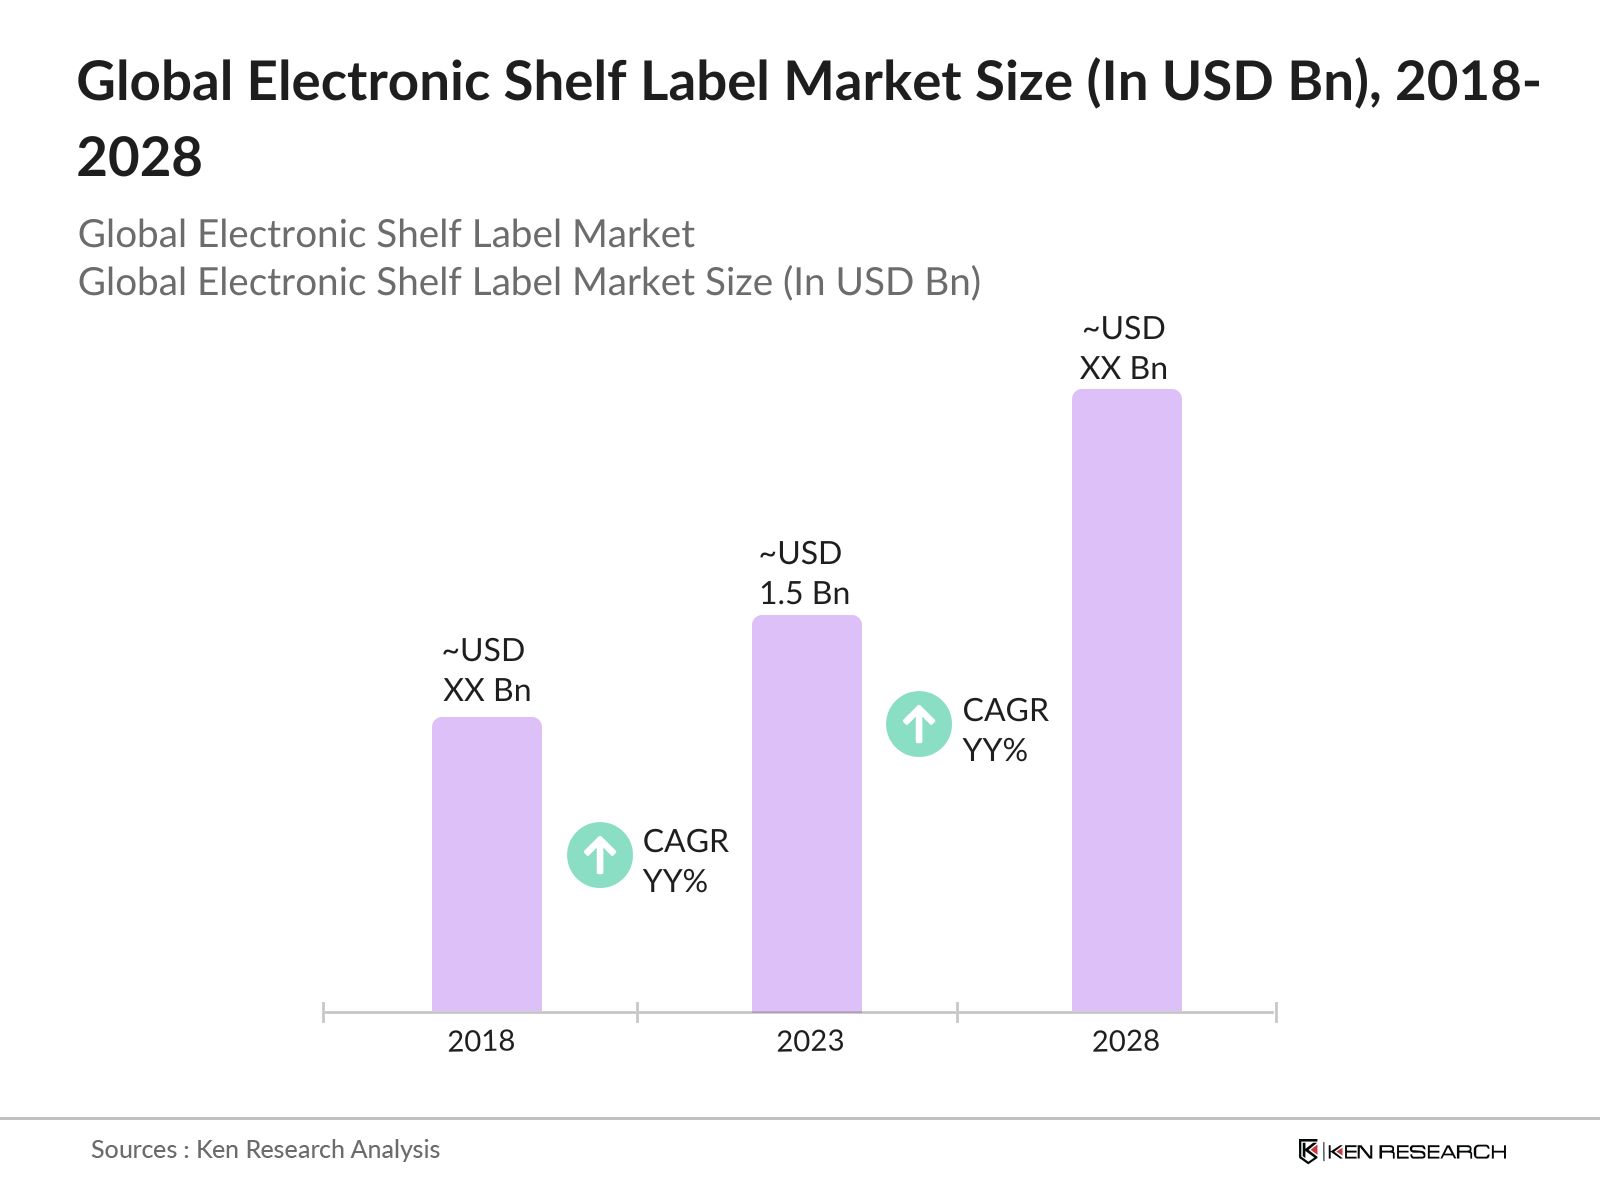
- The Global Electronic Shelf Label (ESL) Market was valued at USD 1.5 billion in 2023. This growth is driven by several factors, including the increasing adoption of automation in retail stores, the need for accurate and dynamic pricing, and the benefits of reducing labour costs.
- The key players in the Global electronic shelf label market include SES-imagotag, Pricer AB, Displaydata Ltd., Samsung Electro-Mechanics, and LG Innotek. These companies drive market innovation through continuous technological advancements and strategic partnerships.
- In 2023, Pricer AB secured a major contract with Carrefour to deploy ESLs across all its stores in France. This contract involves installing over 1 million ESLs, enabling Carrefour to enhance its pricing accuracy and operational efficiency. The partnership is expected to boost Pricer ABs market presence and set a benchmark for other retailers.
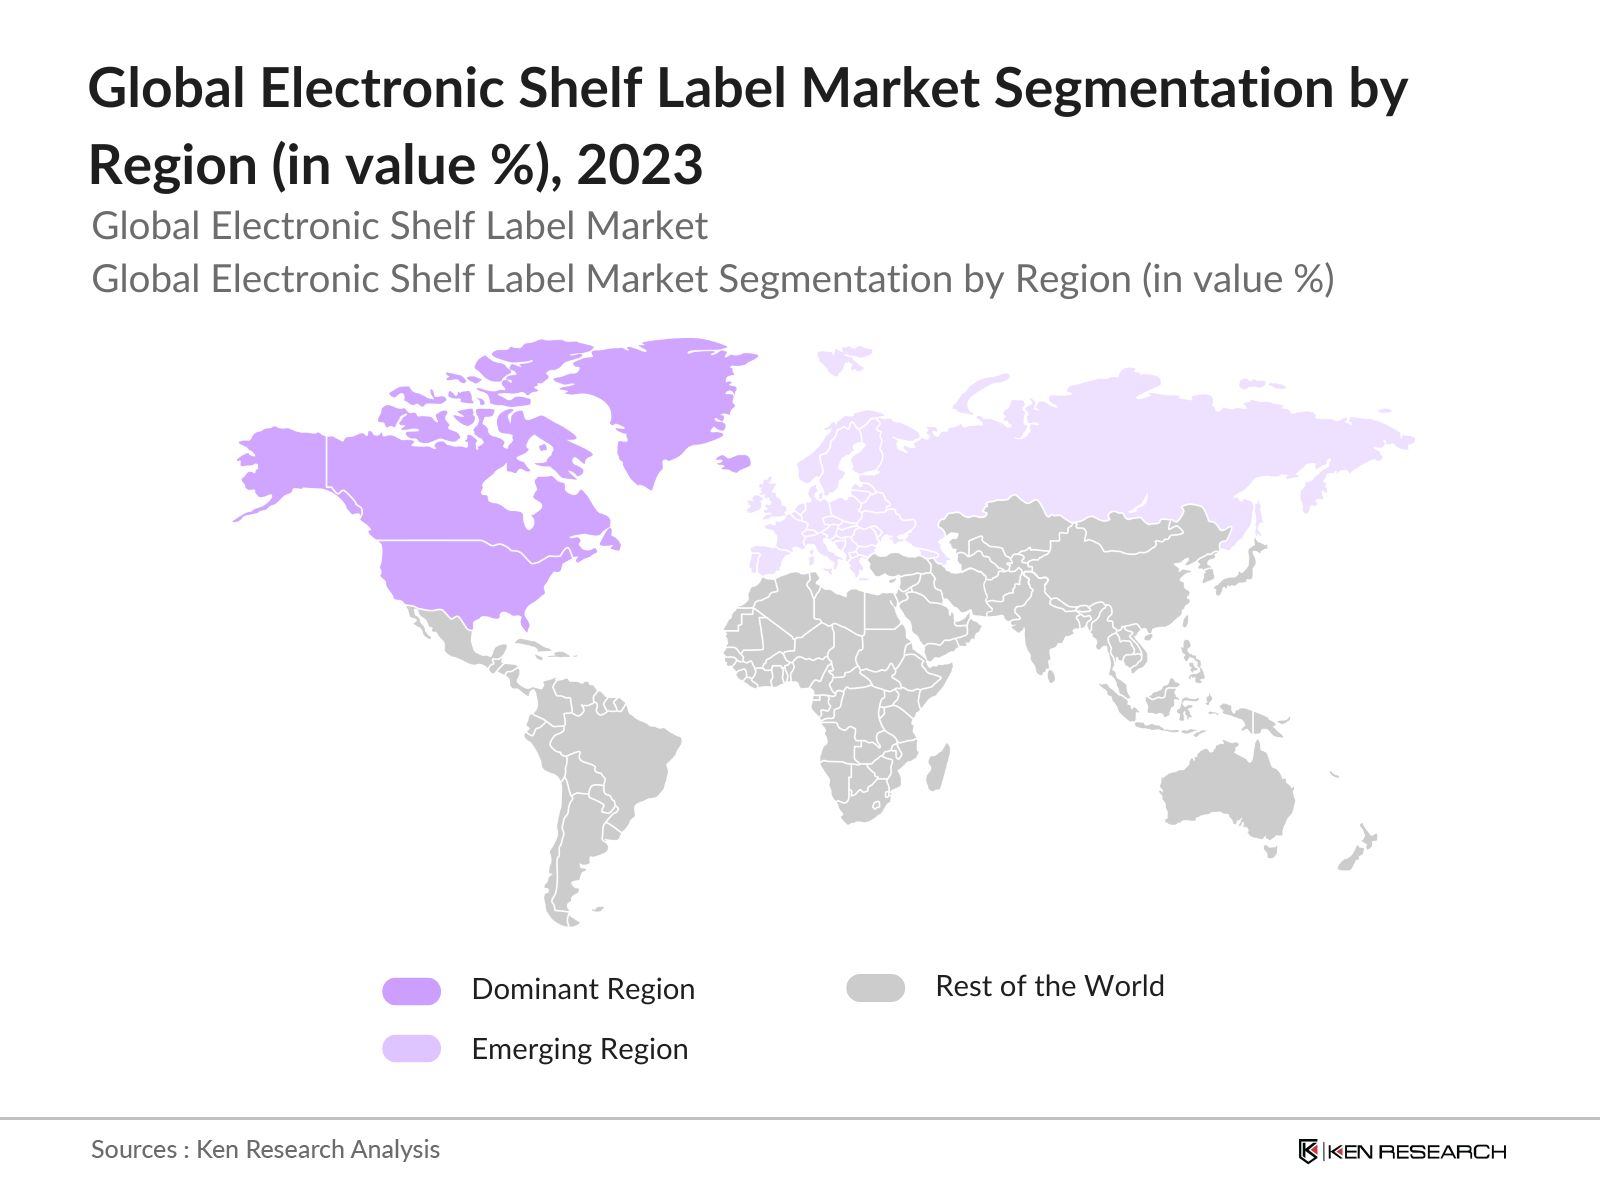
- North America, particularly the United States, dominates the ESL market. In 2023, North America dominated the market due to the high adoption rate of advanced retail technologies, the presence of major retail chains, and substantial investments in digital transformation.
Global Electronic Shelf Label Market Segmentation
The Global Electronic Shelf Label is segmented into product type, application, and region.
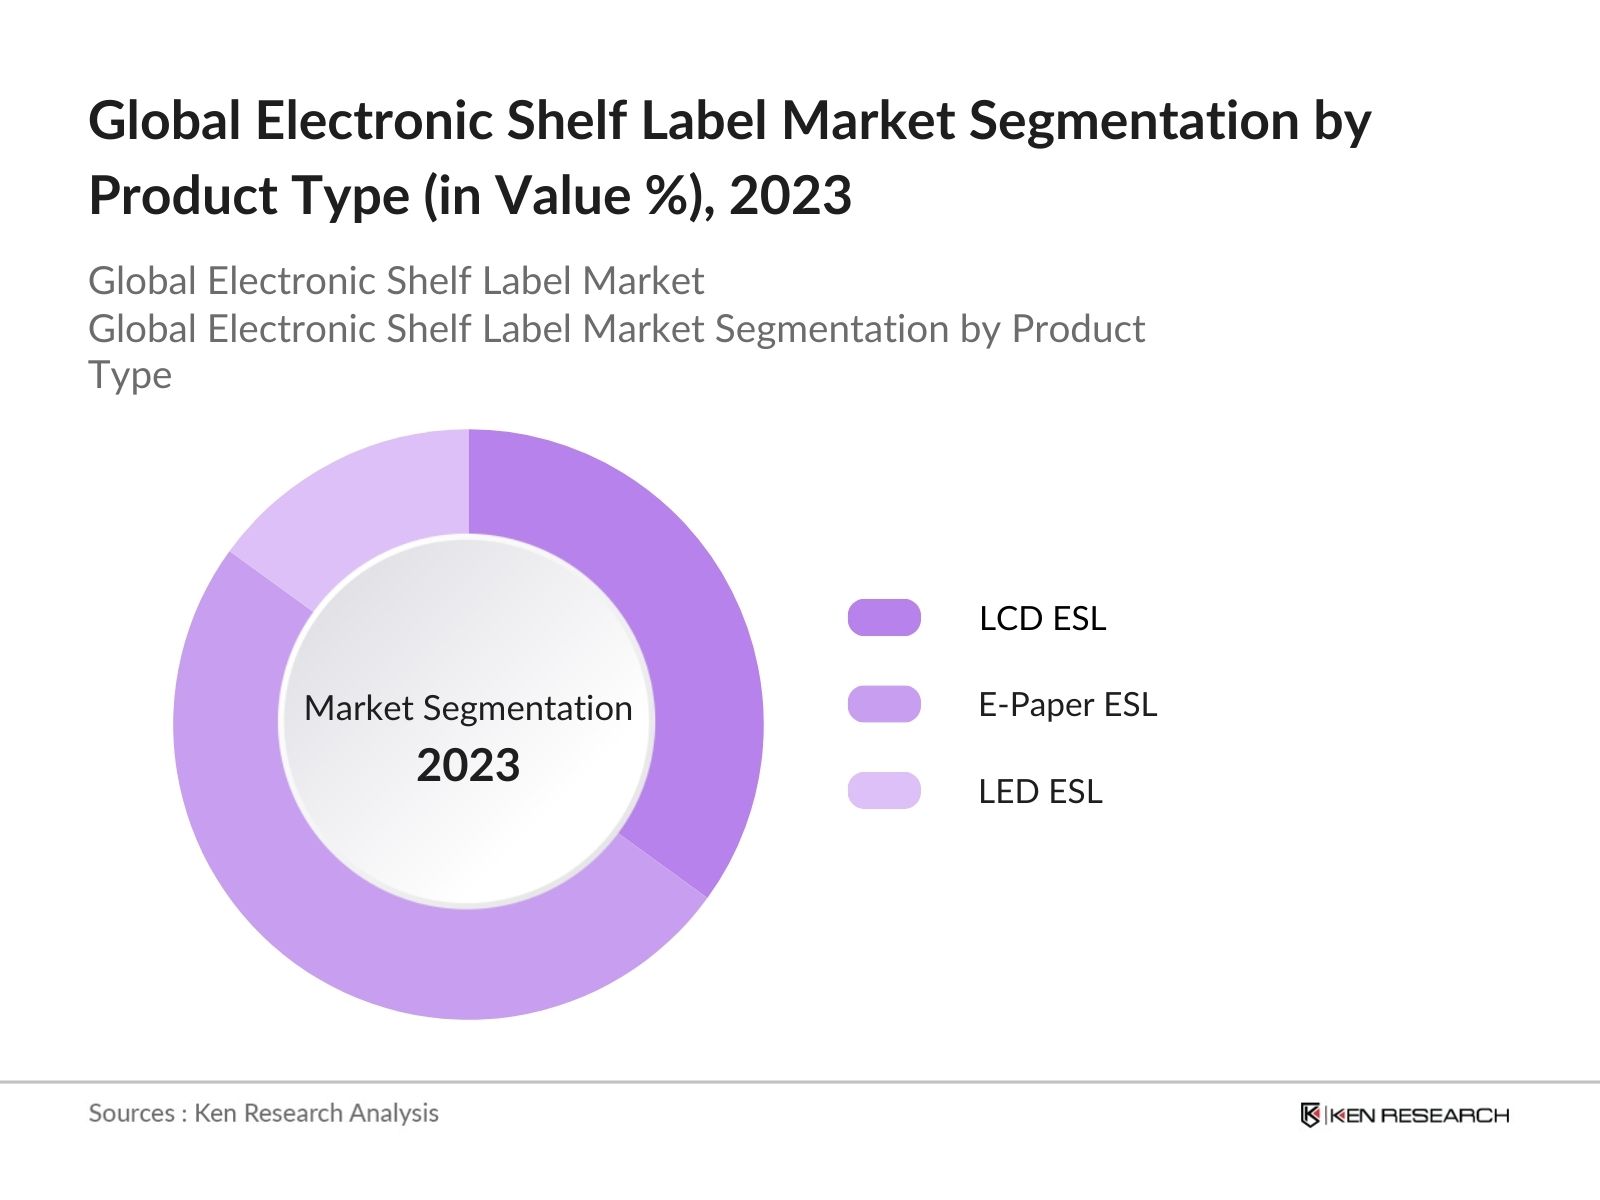
- By Product Type: The ESL market is segmented by product type into LCD ESL, E-Paper ESL, and LED ESL. In 2023, E-Paper ESLs held a dominant market due to their energy efficiency, superior readability, and flexibility in displaying dynamic pricing and promotional information.
- By Application: The ESL market is segmented by application into Retail, Industrial, and Commercial. In 2023, the Retail segment dominated the segment due to the widespread adoption of ESLs in supermarkets, hypermarkets, and specialty stores to streamline pricing management and improve customer engagement.
- By Region: The ESL market is segmented by region into North America, Europe, Asia-Pacific (APAC), Middle East & Africa (MEA), and Latin America. North America held a dominant market share in 2023. The technological infrastructure and consumer demand for enhanced shopping experiences support North America's leading position in the ESL market.
Global Electronic Shelf Label Market Competitive Landscape
|
Company Name |
Establishment Year |
Headquarters |
|
SES-imagotag |
1992 |
France |
|
Pricer AB |
1991 |
Sweden |
|
Displaydata Ltd. |
2003 |
United Kingdom |
|
Samsung Electro-Mechanics |
1973 |
South Korea |
|
LG Innotek |
1970 |
South Korea |
- Pricer AB: In 2023, Pricer AB secured a major contract with Carrefour to deploy ESLs across all its stores in France. This contract involves installing over 1 million ESLs, enabling Carrefour to enhance its pricing accuracy and operational efficiency. The partnership is expected to boost Pricer ABs market presence and set a benchmark for other retailers.
- Displaydata Ltd.: Displaydata Ltd. announced a collaboration with Walmart in 2023 to implement ESLs in 500 stores across the United States. This initiative aims to improve pricing accuracy and reduce operational costs for Walmart. The collaboration involves the deployment of ESLs, strengthening Displaydatas presence in the U.S. market and driving further adoption of ESLs.
Global Electronic Shelf Label Market Analysis
Global Electronic Shelf Label Market Growth Drivers:
- Expansion of IoT Ecosystems: The growth of IoT ecosystems is boosting the ESL market growth. In 2024, the number of IoT-connected devices reached 25 billion globally, facilitating the seamless integration of ESLs with other smart retail systems. This integration enables retailers to gather and analyze data on customer behaviour, stock levels, and sales patterns, leading to more informed decision-making.
- Rise in Consumer Demand for Dynamic Pricing: Consumers are increasingly demanding dynamic pricing models that reflect real-time market conditions. In 2024, consumer surveys indicated that over 70 million shoppers preferred stores with dynamic pricing enabled by ESLs, as it provided them with competitive and updated prices. This shift in consumer behaviour compels retailers to adopt ESLs to stay competitive.
- Advancements in Display Technology: In 2024, there were over 1,000 patents filed globally for innovations in e-paper and LCD technologies used in ESLs. These advancements include better readability, energy efficiency, and durability, making ESLs more appealing to retailers. Enhanced display technologies ensure that ESLs provide clear and accurate pricing information in various lighting conditions, improving the overall shopping experience and driving market adoption.
Global Electronic Shelf Label Market Challenges:
- High Initial Installation Costs: In 2024, the average cost of deploying ESLs in a retail store was $100000. This high upfront investment is a deterrent for small and medium-sized enterprises (SMEs) with limited budgets. Despite the long-term benefits, the substantial initial expenditure makes it challenging for many retailers to justify the transition to ESLs, hindering widespread adoption.
- Technological Integration Issues: In 2024, over 5,000 retailers faced integration issues, resulting in delays and additional costs. Compatibility issues between different software platforms and hardware systems require time and resources to resolve. Retailers must invest in skilled personnel and advanced IT infrastructure to ensure seamless integration, which can be a deterrent for many, slowing down the adoption rate.
Global Electronic Shelf Label Government Initiatives:
- European Union's Digital Retail Initiative: In 2024, the European Union allocated $500 million to support the digital transformation of the retail sector, including the adoption of ESLs. This initiative aims to enhance the competitiveness of European retailers by promoting smart retail technologies. The funding is expected to subsidize the installation of ESLs in over 50,000 stores across Europe, boosting market growth. The initiative reflects the EUs commitment to fostering innovation and efficiency in the retail sector.
- U.S. Smart Retail Fund: The U.S. government announced a $300 million Smart Retail Fund in 2024 to promote the adoption of advanced retail technologies, including ESLs. This fund aims to support retailers in transitioning to smart solutions by providing grants and subsidies for ESL implementation. Over 20,000 retail stores are expected to benefit from this fund, enhancing their operational efficiency and customer experience.
Global Benzoates Future Market Outlook
Global's Electronic Shelf Label is expected to reach USD 29 billion by 2028. The industry is also likely to shift towards more organized with established players and online platforms expanding their reach.
Global Benzoates Future Market Trends:
- Widespread Adoption of AI-driven ESLs: In the next five years, AI-driven ESLs are expected to become the norm in the retail industry. By 2028, over 100,000 stores worldwide are projected to use AI-powered ESLs to analyze customer behavior, optimize pricing strategies, and manage inventory more effectively. The integration of AI with ESLs will enable retailers to provide personalized shopping experiences, increase sales, and improve operational efficiency.
- Expansion of ESL Applications Beyond Retail: ESL technology is expected to expand beyond retail applications into sectors such as healthcare, logistics, and manufacturing. By 2028, over 50,000 non-retail establishments are projected to implement ESLs for tasks like asset tracking, patient management, and inventory control. The versatility and efficiency of ESLs will drive their adoption across various industries, opening new growth avenues for the market.
Scope of the Report
|
By Product Type |
LCD ESL E-Paper ESL LED ESL |
|
By Application |
Retail Industrial Commercial |
|
By Technology |
Radio Frequency (RF) Technology Infrared Technology NFC Technology |
|
By Display Size |
Less than 3 Inches 3 to 7 Inches More than 7 Inches |
|
By Region |
North America Europe APAC MEA Latin America |
Products
Key Target Audience Organizations and Entities Who Can Benefit by Subscribing This Report:
Government and Regulatory Bodies
Banks and Financial Institutes
Investors and Venture Capitalists
E-commerce Companies
Logistics Companies
Display Manufacturers
Time Period Captured in the Report
Historical Period: 2018-2023
Base Year: 2023
Forecast Period: 2023-2028
Companies
SES-imagotag
Pricer AB
Displaydata Ltd.
Samsung Electro-Mechanics
LG Innotek
E Ink Holdings
Diebold Nixdorf
Altierre Corporation
Opticon Sensors Europe
M2Communication
DIGI System Gurgaon
Zkong
Wincor Nixdorf
Hanshow Technology
SOLUM
Table of Contents
1. Global Electronic Shelf Label Market Overview
1.1. Definition and Scope
1.2. Market Taxonomy
1.3. Market Growth Rate
1.4. Market Segmentation Overview
2. Global Electronic Shelf Label Market Size (in USD Bn), 2018-2023
2.1. Historical Market Size
2.2. Year-on-Year Growth Analysis
2.3. Key Market Developments and Milestones
3. Global Electronic Shelf Label Market Analysis
3.1. Growth Drivers
3.1.1. Increasing Adoption of Smart Retail Solutions
3.1.2. Expansion of IoT Ecosystems
3.1.3. Rise in Consumer Demand for Dynamic Pricing
3.1.4. Advancements in Display Technology
3.2. Restraints
3.2.1. High Initial Installation Costs
3.2.2. Maintenance and Operational Costs
3.2.3. Technological Integration Issues
3.2.4. Cybersecurity Concerns
3.3. Opportunities
3.3.1. Adoption in Emerging Markets
3.3.2. Integration with AI and Machine Learning
3.3.3. Expansion of Use Cases Beyond Retail
3.3.4. Collaboration with E-commerce Platforms
3.4. Trends
3.4.1. AI-Driven ESL Systems
3.4.2. Sustainable and Eco-friendly Solutions
3.4.3. Regional Expansion in Asia-Pacific
3.4.4. Customization and Personalization Capabilities
3.5. Government Regulations
3.5.1. European Unions Digital Retail Initiative
3.5.2. U.S. Smart Retail Fund
3.5.3. Chinas Digital Economy Plan
3.5.4. Japans Retail Innovation Program
3.6. SWOT Analysis
3.7. Stakeholder Ecosystem
3.8. Competitive Ecosystem
4. Global Electronic Shelf Label Market Segmentation, 2023
4.1. By Product Type (in Value %)
4.1.1. LCD ESL
4.1.2. E-Paper ESL
4.1.3. LED ESL
4.2. By Application (in Value %)
4.2.1. Retail
4.2.2. Industrial
4.2.3. Commercial
4.3. By Technology (in Value %)
4.3.1. Radio Frequency (RF) Technology
4.3.2. Infrared Technology
4.3.3. NFC Technology
4.4. By Display Size (in Value %)
4.4.1. Less than 3 Inches
4.4.2. 3 to 7 Inches
4.4.3. More than 7 Inches
4.5. By Region (in Value %)
4.5.1. North America
4.5.2. Europe
4.5.3. Asia-Pacific (APAC)
4.5.4. Middle East & Africa (MEA)
4.5.5. Latin America
5. Global Electronic Shelf Label Market Cross Comparison
5.1. Detailed Profiles of Major Companies
5.1.1. SES-image tag
5.1.2. Pricer AB
5.1.3. Displaydata Ltd.
5.1.4. Samsung Electro-Mechanics
5.1.5. LG Innotek
5.2. Cross Comparison Parameters (No. of Employees, Headquarters, Inception Year, Revenue)
6. Global Electronic Shelf Label Market Competitive Landscape
6.1. Market Share Analysis
6.2. Strategic Initiatives
6.3. Mergers and Acquisitions
6.4. Investment Analysis
6.4.1. Venture Capital Funding
6.4.2. Government Grants
6.4.3. Private Equity Investments
7. Global Electronic Shelf Label Market Regulatory Framework
7.1. International Standards
7.2. Compliance Requirements
7.3. Certification Processes
8. Global Electronic Shelf Label Market Future Size (in USD Bn), 2023-2028
8.1. Future Market Size Projections
8.2. Key Factors Driving Future Market Growth
9. Global Electronic Shelf Label Market Future Segmentation, 2028
9.1. By Product Type (in Value %)
9.2. By Application (in Value %)
9.3. By Technology (in Value %)
9.4. By Display Size (in Value %)
9.5. By Region (in Value %)
10. Global Electronic Shelf Label Market Analysts Recommendations
10.1. TAM/SAM/SOM Analysis
10.2. Customer Cohort Analysis
10.3. Marketing Initiatives
10.4. White Space Opportunity Analysis
11. Disclaimer
12. Contact Us
Research Methodology
Step: 1 Identifying Key Variables
Ecosystem creation for all the major entities and referring to multiple secondary and proprietary databases to perform desk research around the Industry to collate industry-level information.
Step: 2 Industry Building
Collating statistics on the global electronic shelf label market over the years, and analyzing the penetration of Industryplaces as well as the ratio of service providers to compute the revenue generated for the market. We will also review service quality statistics to understand the revenue generated which can ensure accuracy behind the data points shared.
Step: 3 Validating and Finalizing
Building Industry hypotheses and conducting CATIs with industry experts belonging to different companies to validate statistics and seek operational and financial information from company representatives.
Step: 4 Research Output
Our team will approach multiple Electronic Shelf Label manufacturing companies and understand the nature of product segments and sales, consumer preference and other parameters, which will support us validate statistics derived through the bottom-to-top approach from the Electronic Shelf Label manufacturing companies.
Frequently Asked Questions
01 How big is the Global Electronic Shelf Label Market?
The Global Electronic Shelf Label (ESL) Market was valued at USD 1.5 billion in 2023. This growth is driven by several factors, including the increasing adoption of automation in retail stores, the need for accurate and dynamic pricing, and the benefits of reducing labour costs.
02 Who are the major players in the Global Electronic Shelf Label Market?
The major players in the Global Electronic Shelf Label include SES-imagotag, Pricer AB, Displaydata Ltd., Samsung Electro-Mechanics, and LG Innotek. These companies drive market innovation through continuous technological advancements and strategic partnerships.
03 What are the growth drivers of the Global Electronic Shelf Label Market?
The growth drivers of the Global Electronic Shelf Label market include increasing adoption of smart retail solutions, expansion of IoT ecosystems, rising consumer demand for dynamic pricing, and advancements in display technology, all contributing to enhanced operational efficiency and customer experience.
04 What are the challenges in the Global Electronic Shelf Label Market?
The Global Electronic Shelf Label market faces challenges such as high initial installation costs, ongoing maintenance expenses, technological integration issues with existing retail systems, and cybersecurity threats, all of which can hinder widespread adoption and market growth.
Why Buy From Us?
 Framework")
What makes us stand out is that our consultants follows Robust, Refine and Result (RRR) methodology. i.e. Robust for clear definitions, approaches and sanity checking, Refine for differentiating respondents facts and opinions and Result for presenting data with story

We have set a benchmark in the industry by offering our clients with syndicated and customized market research reports featuring coverage of entire market as well as meticulous research and analyst insights.

While we don't replace traditional research, we flip the method upside down. Our dual approach of Top Bottom & Bottom Top ensures quality deliverable by not just verifying company fundamentals but also looking at the sector and macroeconomic factors.

With one step in the future, our research team constantly tries to show you the bigger picture. We help with some of the tough questions you may encounter along the way: How is the industry positioned? Best marketing channel? KPI's of competitors? By aligning every element, we help maximize success.

Our report gives you instant access to the answers and sources that other companies might choose to hide. We elaborate each steps of research methodology we have used and showcase you the sample size to earn your trust.

If you need any support, we are here! We pride ourselves on universe strength, data quality, and quick, friendly, and professional service.