
Global Green Ammonia Market Outlook to 2030
Region:Global
Author(s):Paribhasha Tiwari
Product Code:KROD4956
December 2024
85
About the Report
Global Green Ammonia Market Overview
- The global green ammonia market is valued at USD 700 Million, driven by the increasing focus on sustainability and decarbonization. The rising demand for ammonia as a sustainable alternative in the agricultural sector, especially for fertilizers, has been a key growth factor. Additionally, the integration of renewable energy sources such as solar and wind in ammonia production has bolstered the market's expansion, particularly in regions where green hydrogen infrastructure is well-established. Government policies promoting low-carbon production technologies further drive the market.
- The leading countries in the green ammonia market include the United States, Germany, and Japan. These countries dominate due to their advanced renewable energy infrastructure, strong government support for green energy transitions, and substantial investments in green hydrogen projects. The United States leads with large-scale ammonia production plants, while Germany's strong green hydrogen initiatives and Japan's adoption of ammonia in the maritime sector boost their market dominance.
- The European Unions Green Deal, initiated in 2023, emphasizes the transition to renewable energy and carbon-neutral industries, including agriculture. As part of this initiative, the EU set aside $100 billion for hydrogen-based energy projects, including green ammonia production. This financial support has been instrumental in the growth of green ammonia, particularly in the European agricultural sector, where green fertilizers are becoming the norm due to environmental regulations.

Global Green Ammonia Market Segmentation
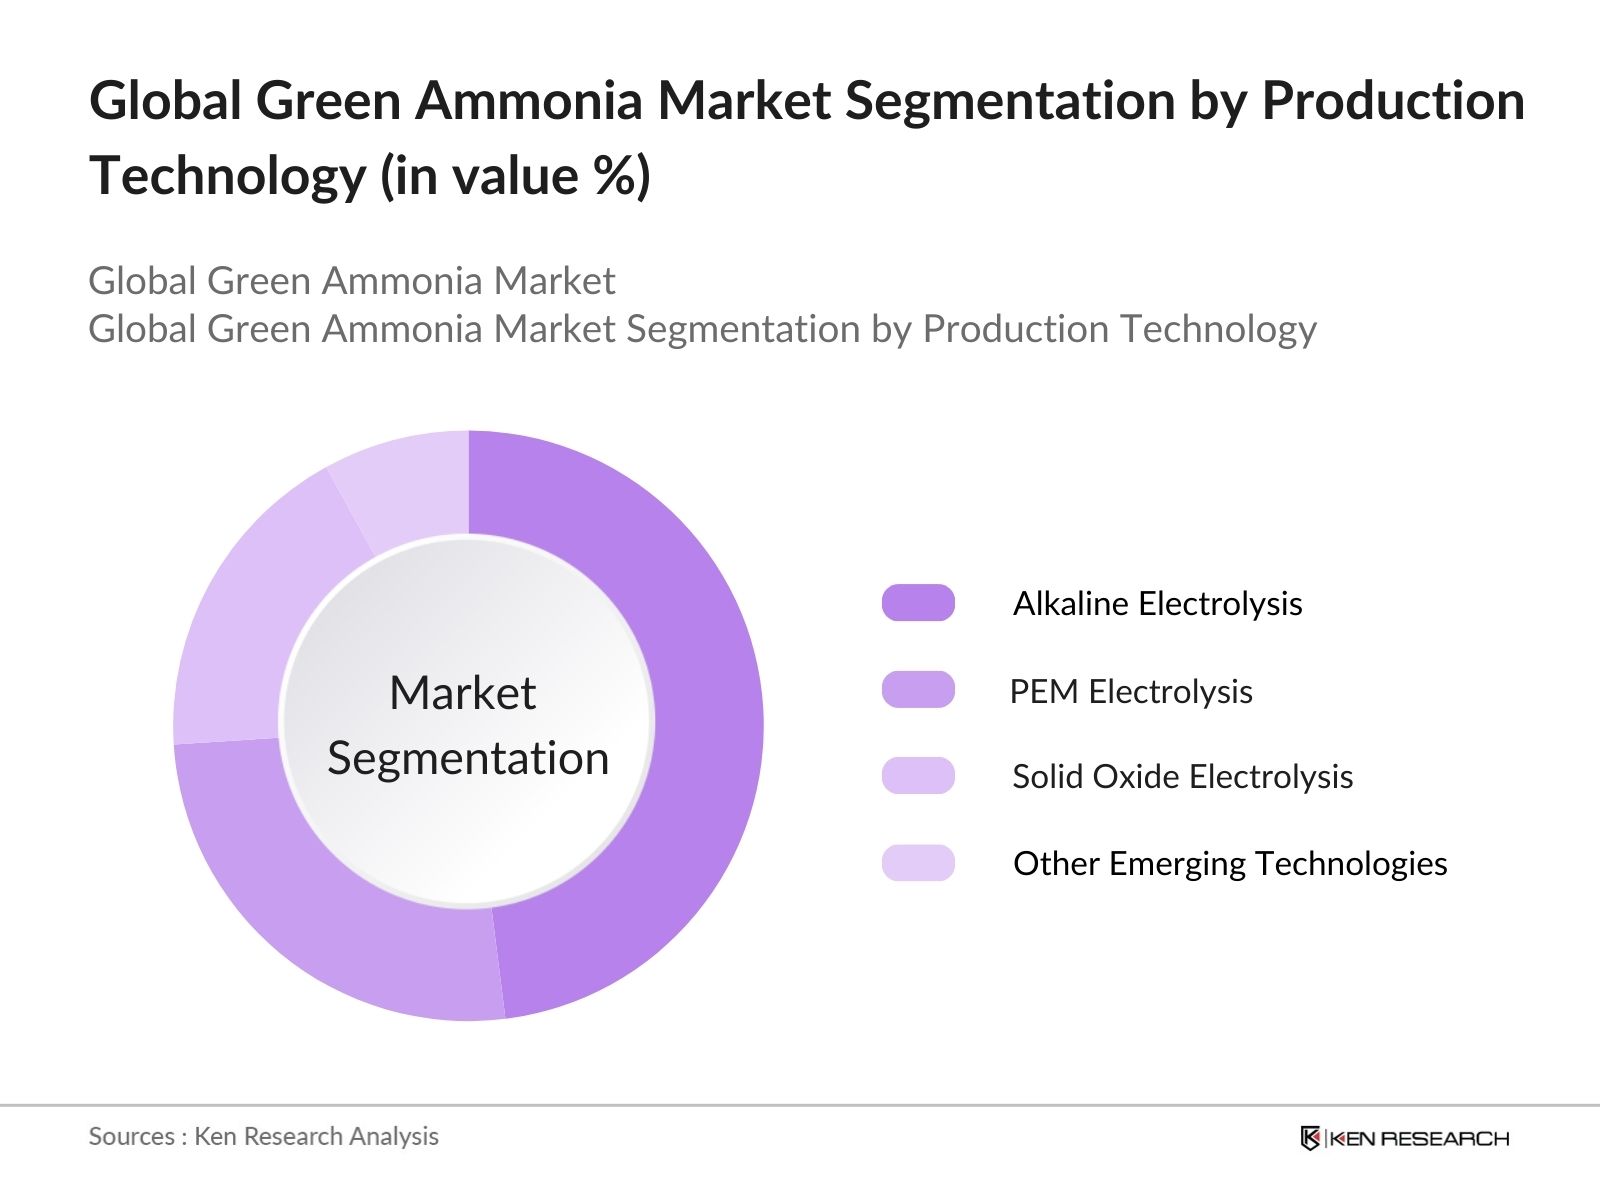
By Production Technology: The global green ammonia market is segmented by production technology into alkaline electrolysis, PEM electrolysis, solid oxide electrolysis, and other emerging technologies.
Alkaline electrolysis dominates this segment due to its proven efficiency and cost-effectiveness in large-scale ammonia production. As one of the oldest electrolysis methods, it benefits from established infrastructure and lower capital costs, making it the most widely adopted technology for green ammonia production. The availability of cheap renewable energy sources, especially in countries like the U.S. and Australia, supports its dominance.
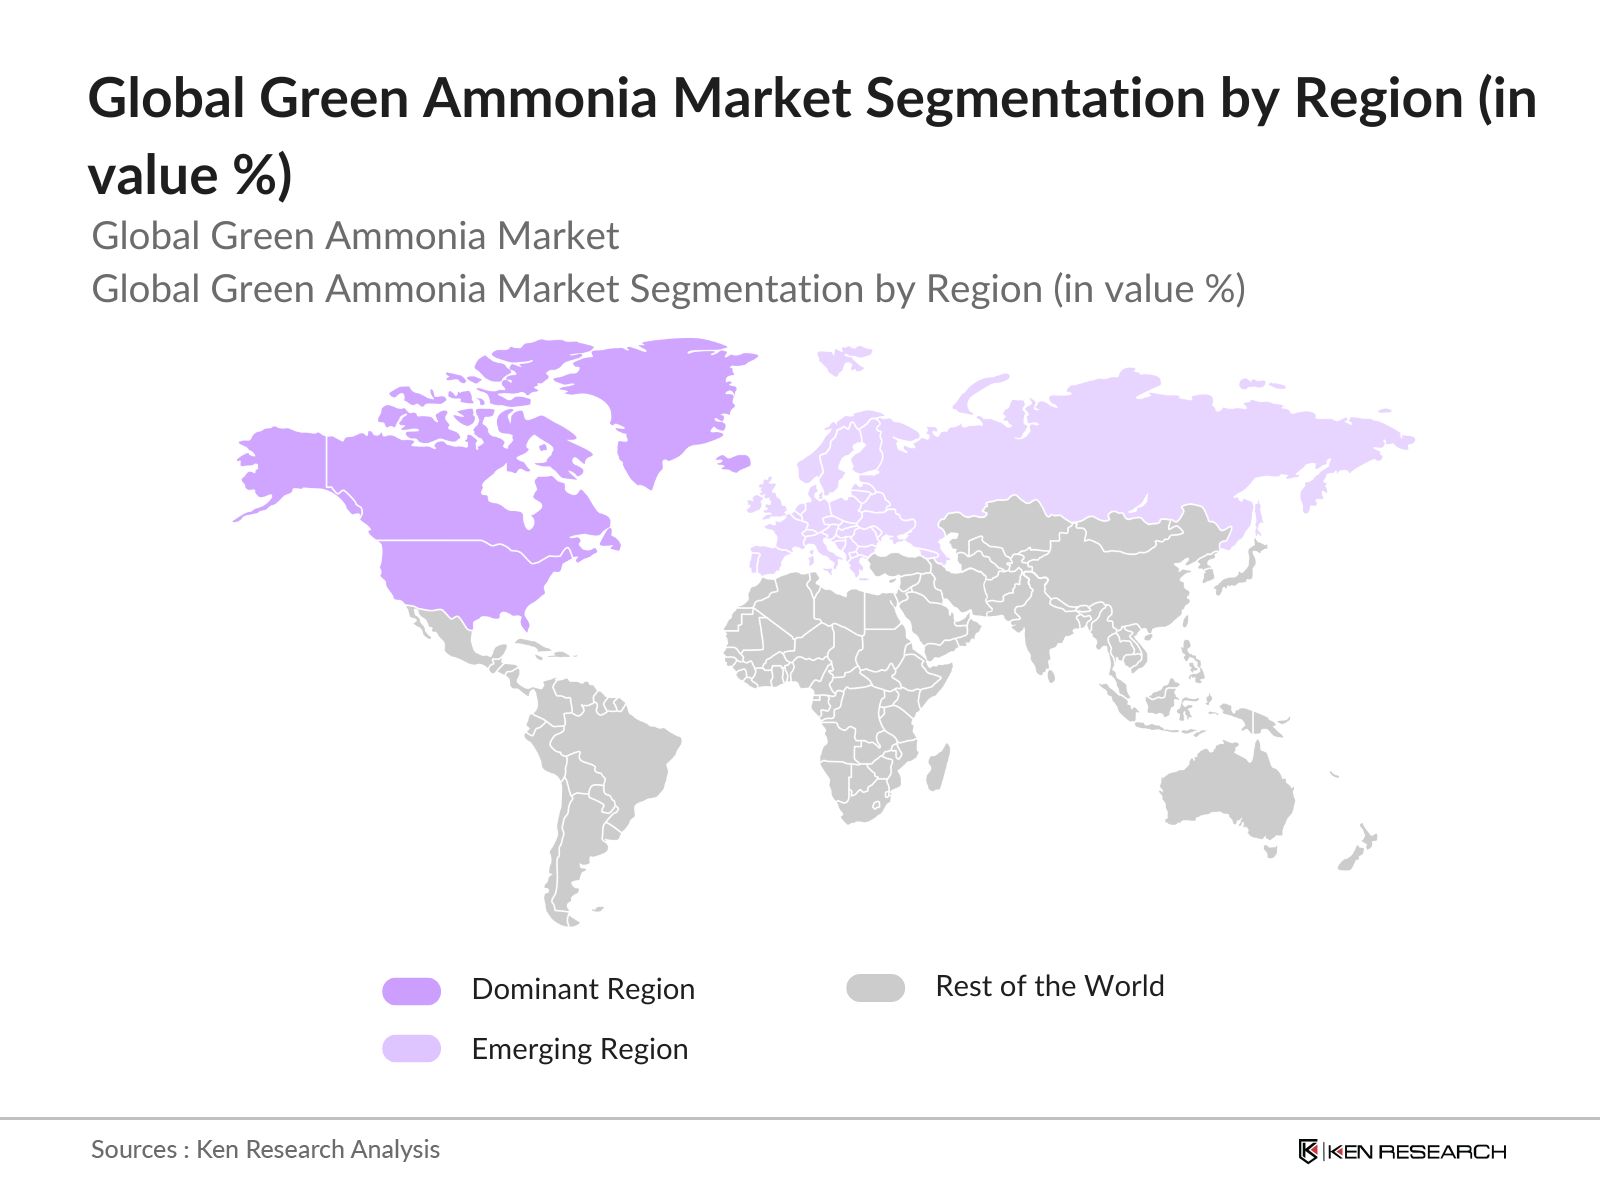
By Region: By region, the market is segmented in North America, Europe, Asia Pacific, Latin America and Middle East & Africa. North America dominates the global green ammonia market. The region's leadership is driven by the United States, which has significant investments in renewable energy infrastructure and green hydrogen production facilities. Strong governmental support and large-scale ammonia projects further enhance the region's dominance in the market.
Global Green Ammonia Market Competitive Landscape
The global green ammonia market is characterized by key players focusing on technological innovation, renewable energy partnerships, and strategic expansions. The market is consolidated with a few major companies dominating production and distribution networks. Leading firms leverage their expertise in renewable energy and hydrogen production to strengthen their foothold in the green ammonia space.
|
Company Name |
Establishment Year |
Headquarters |
Electrolyzer Technology |
Renewable Energy Partner |
Production Capacity |
Geographical Reach |
R&D Investment |
Strategic Partnerships |
Green Hydrogen Utilization |
|
Yara International ASA |
1905 |
Oslo, Norway |
- | - | - | - | - | - | - |
|
Siemens AG |
1847 |
Berlin, Germany |
- | - | - | - | - | - | - |
|
ITM Power |
2001 |
Sheffield, UK |
- | - | - | - | - | - | - |
|
CF Industries |
1946 |
Illinois, USA |
- | - | - | - | - | - | - |
|
ThyssenKrupp |
1811 |
Essen, Germany |
- | - | - | - | - | - | - |
Global Green Ammonia Market Analysis
Growth Drivers
- Adoption of Clean Energy Solutions: The demand for clean energy solutions, such as green hydrogen, is rising as governments prioritize decarbonization strategies. In 2024, the European Union allocated $100 billion towards renewable energy development, including hydrogen energy initiatives aimed at reducing carbon emissions. Similarly, the U.S. Department of Energy dedicated $8 billion for regional clean hydrogen hubs. These investments are accelerating the growth of green ammonia production, with significant focus on clean energy adoption and reduction in emissions through the use of green fertilizers in the agricultural sector.
- Hydrogen Energy Subsidies: Governments are offering substantial subsidies to support green hydrogen and ammonia production. For instance, the U.S. Inflation Reduction Act of 2023 provided a tax credit of $3 per kilogram of green hydrogen produced. Similarly, the Indian government introduced a green hydrogen production subsidy of $2 billion, supporting new green ammonia plants. These financial aids directly influence market dynamics, as manufacturers benefit from reduced production costs, stimulating green ammonia output and reducing dependency on traditional fertilizers.
- Technological Advancements in Electrolysis: Technological innovations in water electrolysis for hydrogen production are driving the green ammonia market. The efficiency of Proton Exchange Membrane (PEM) electrolyzers has improved by over 30% between 2020 and 2023, reducing electricity consumption during hydrogen production. Electrolysis is critical for green ammonia production as it uses renewable energy to generate hydrogen, a key component. The advancement in PEM electrolyzers ensures faster and more efficient hydrogen production, making the green ammonia process more cost-effective and energy-efficient.
Market Challenges
- Limited Hydrogen Infrastructure: Despite growing interest in green ammonia, hydrogen infrastructure remains underdeveloped. According to the European Hydrogen Backbone Initiative, Europe had only 500 kilometers of dedicated hydrogen pipelines by 2024. In contrast, natural gas pipelines span over 200,000 kilometers. This lack of infrastructure makes it difficult to transport and store hydrogen, limiting the scalability of green ammonia production. Developing new pipelines or retrofitting existing ones to transport hydrogen remains a costly and slow process.
- Energy Loss During Hydrogen Production: Green ammonia production is energy-intensive, with significant energy losses during the hydrogen generation process. Electrolysis, used to produce hydrogen, has an energy efficiency of only 60-80%, resulting in energy wastage. For every 10 units of energy put into the system, only about 6 to 8 units are converted into usable hydrogen. This inefficiency is a critical barrier to the widespread adoption of green ammonia, especially in regions where renewable energy is expensive or limited.
Global Green Ammonia Market Future Outlook
Over the next five years, the global green ammonia market is expected to experience robust growth, driven by increased investments in renewable energy projects and a strong push for sustainable agriculture practices. The continuous development of green hydrogen infrastructure and the integration of ammonia as a carbon-neutral fuel in the maritime and power sectors will further fuel market expansion. Technological advancements in electrolyzes, combined with government incentives for green energy, are also projected to accelerate adoption in industrial applications.
Market Opportunities
- Strategic Collaborations with Renewable Energy Providers: Collaborations between green ammonia producers and renewable energy companies present substantial growth opportunities. For example, in 2023, a joint venture between rsted, a leading renewable energy company, and Yara, a major fertilizer company, aimed to develop green ammonia using offshore wind energy. By tapping into renewable energy sources, companies can ensure a steady and sustainable supply of electricity for ammonia production, reducing costs. In addition, the USAs Department of Energy has pledged $8 billion for clean hydrogen hubs, emphasizing strategic partnerships as a key growth driver for green ammonia production.
- Expansion of Offshore Wind-Powered Ammonia Projects: The development of offshore wind energy projects to power green ammonia production offers a significant opportunity for growth. In 2024, Europes offshore wind capacity reached over 30 gigawatts, with plans to expand further. The United Kingdom has led the way, investing over 3 billion in offshore wind projects aimed at producing green hydrogen and ammonia. Offshore wind farms are becoming a crucial component in reducing carbon emissions and producing clean ammonia, particularly in regions where land-based renewable energy projects are constrained.
Scope of the Report
|
By Production Technology |
Alkaline Electrolysis PEM Electrolysis Solid Oxide Electrolysis Other Emerging Technologies |
|
By Application |
Fertilizers Industrial Feedstock Marine Fuel Power Generation |
|
By Energy Source |
Solar-Powered Ammonia Wind-Powered Ammonia Hydro-Powered Ammonia Biomass-Powered Ammonia |
|
By End-Use Industry |
Agriculture Maritime Power & Energy, Chemicals |
|
By Region |
North America Europe Asia-Pacific Latin America Middle East & Africa |
Products
Key Target Audience
Green Ammonia Producers
Renewable Energy Suppliers
Hydrogen Technology Providers
Agricultural Input Manufacturers
Government and Regulatory Bodies (e.g., U.S. Department of Energy, European Commission)
Maritime Industry Leaders
Investments and Venture Capitalist Firms
Power Generation Companies
Companies
Players Mentioned in the Report:
Yara International ASA
Siemens AG
ITM Power
CF Industries
ThyssenKrupp
Air Products and Chemicals, Inc.
BASF SE
Engie SA
Linde Plc
Fertiglobe
Table of Contents
1. Global Green Ammonia Market Overview
1.1. Definition and Scope
1.2. Market Taxonomy
1.3. Market Growth Rate (Green ammonia production capacity, energy efficiency metrics, hydrogen feedstock availability)
1.4. Market Segmentation Overview (Production Technology, Application, Energy Source, End-Use Industry, Region)
2. Global Green Ammonia Market Size (In USD Bn)
2.1. Historical Market Size
2.2. Year-On-Year Growth Analysis (Production volumes, Renewable energy integration)
2.3. Key Market Developments and Milestones (Hydrogen-based ammonia projects, renewable energy mandates)
3. Global Green Ammonia Market Analysis
3.1. Growth Drivers
3.1.1. Increasing Demand for Green Fertilizers
3.1.2. Global Decarbonization Goals (Net-zero targets, carbon footprint reduction)
3.1.3. Government Incentives and Subsidies (Hydrogen energy subsidies, renewable energy credits)
3.1.4. Renewable Energy Advancements (Cost efficiency of solar and wind energy)
3.2. Market Challenges
3.2.1. High Initial Capital Investment (Electrolysis infrastructure, renewable energy infrastructure)
3.2.2. Limited Hydrogen Supply Chain (Hydrogen transportation and storage)
3.2.3. Energy Conversion Efficiency (Loss in green hydrogen production)
3.3. Opportunities
3.3.1. Strategic Collaborations with Renewable Energy Providers
3.3.2. Expansion of Offshore Wind-Powered Ammonia Projects
3.3.3. Technological Innovations in Electrolyzers and Hydrogen Storage
3.4. Trends
3.4.1. Shift Toward Carbon-Neutral Shipping Fuel (Ammonia as marine fuel)
3.4.2. Development of Small-Scale Green Ammonia Plants
3.4.3. Industrial Adoption of Green Ammonia for Power Generation
3.5. Government Regulation
3.5.1. Renewable Energy Policies and Green Hydrogen Legislation
3.5.2. Ammonia Emission Standards (Emission reduction mandates)
3.5.3. Carbon Pricing and Credits
3.6. SWOT Analysis
3.7. Stakeholder Ecosystem (Renewable energy suppliers, ammonia producers, industrial users)
3.8. Porters Five Forces (Renewable energy suppliers, hydrogen technology providers)
3.9. Competitive Ecosystem
4. Global Green Ammonia Market Segmentation
4.1. By Production Technology (In Value %)
4.1.1. Alkaline Electrolysis
4.1.2. Proton Exchange Membrane (PEM) Electrolysis
4.1.3. Solid Oxide Electrolysis
4.1.4. Other Emerging Technologies
4.2. By Application (In Value %)
4.2.1. Fertilizers
4.2.2. Industrial Feedstock
4.2.3. Marine Fuel
4.2.4. Power Generation
4.3. By Energy Source (In Value %)
4.3.1. Solar-Powered Ammonia
4.3.2. Wind-Powered Ammonia
4.3.3. Hydro-Powered Ammonia
4.3.4. Biomass-Powered Ammonia
4.4. By End-Use Industry (In Value %)
4.4.1. Agriculture
4.4.2. Maritime
4.4.3. Power & Energy
4.4.4. Chemicals
4.5. By Region (In Value %)
4.5.1. North America
4.5.2. Europe
4.5.3. Asia-Pacific
4.5.4. Latin America
4.5.5. Middle East & Africa
5. Global Green Ammonia Market Competitive Analysis
5.1 Detailed Profiles of Major Companies
5.1.1. Yara International ASA
5.1.2. Siemens AG
5.1.3. ITM Power
5.1.4. Nel Hydrogen
5.1.5. ThyssenKrupp
5.1.6. CF Industries
5.1.7. Air Products and Chemicals, Inc.
5.1.8. BASF SE
5.1.9. Engie SA
5.1.10. Linde Plc
5.1.11. Fertiglobe
5.1.12. Haldor Topsoe
5.1.13. Trafigura Group
5.1.14. Shell Plc
5.1.15. Iberdrola SA
5.2 Cross Comparison Parameters (Production Capacity, Electrolyzer Technology, Renewable Energy Integration, Green Hydrogen Utilization, R&D Investment, Geographical Presence, Strategic Partnerships, Revenue Share from Green Ammonia)
5.3 Market Share Analysis
5.4 Strategic Initiatives (Partnerships, alliances with renewable energy firms)
5.5 Mergers and Acquisitions
5.6 Investment Analysis
5.7 Venture Capital Funding
5.8 Government Grants
5.9 Private Equity Investments
6. Global Green Ammonia Market Regulatory Framework
6.1 Renewable Energy Regulations (Green hydrogen policies, ammonia production standards)
6.2 Compliance Requirements (Hydrogen purity standards, safety regulations)
6.3 Certification Processes (Certifications for green hydrogen, renewable ammonia labeling)
7. Global Green Ammonia Future Market Size (In USD Bn)
7.1 Future Market Size Projections
7.2 Key Factors Driving Future Market Growth (Growth in renewable energy, demand for sustainable agriculture)
8. Global Green Ammonia Future Market Segmentation
8.1 By Production Technology (In Value %)
8.2 By Application (In Value %)
8.3 By Energy Source (In Value %)
8.4 By End-Use Industry (In Value %)
8.5 By Region (In Value %)
9. Global Green Ammonia Market Analysts' Recommendations
9.1 TAM/SAM/SOM Analysis (Total Addressable Market, Serviceable Available Market, Serviceable Obtainable Market)
9.2 Customer Cohort Analysis (Agriculture, maritime, energy customers)
9.3 Marketing Initiatives (Outreach for renewable ammonia, sustainability messaging)
9.4 White Space Opportunity Analysis (Emerging markets, unaddressed energy sources)
Research Methodology
Step 1: Identification of Key Variables
The research begins with constructing an ecosystem map to outline the major stakeholders within the global green ammonia market. This process involves extensive desk research utilizing proprietary databases and industry reports to identify critical variables influencing the market.
Step 2: Market Analysis and Construction
This phase involves compiling and analyzing historical data related to the green ammonia market. Data points such as production capacity, energy source integration, and ammonia utilization in different industries are assessed to construct accurate market models.
Step 3: Hypothesis Validation and Expert Consultation
In this step, industry hypotheses are validated through consultations with industry experts and green ammonia producers. Primary interviews provide operational insights that help refine market forecasts and ensure accurate projections.
Step 4: Research Synthesis and Final Output
Finally, the data is synthesized, and conclusions are drawn based on a mix of top-down and bottom-up approaches. The findings are verified through direct engagement with green ammonia producers, ensuring accuracy and depth in the market analysis.
Frequently Asked Questions
01. How big is the Global Green Ammonia Market?
The global green ammonia market is valued at USD 700 Million, driven by rising demand in sustainable agriculture and decarbonization efforts across industrial sectors.
02. What are the challenges in the Global Green Ammonia Market?
Key challenges in the global green ammonia market include high capital investment for production infrastructure, limited hydrogen supply chain development, and energy efficiency concerns in electrolysis technology.
03. Who are the major players in the Global Green Ammonia Market?
Key players in the global green ammonia market include Yara International, Siemens AG, ITM Power, CF Industries, and ThyssenKrupp, who dominate due to their strong renewable energy partnerships and production capacity.
04. What are the growth drivers of the Global Green Ammonia Market?
Growth of global green ammonia market is driven by increasing adoption of green ammonia in sustainable agriculture, its potential as a carbon-neutral fuel in the maritime sector, and supportive government policies.
Why Buy From Us?
 Framework")
What makes us stand out is that our consultants follows Robust, Refine and Result (RRR) methodology. i.e. Robust for clear definitions, approaches and sanity checking, Refine for differentiating respondents facts and opinions and Result for presenting data with story

We have set a benchmark in the industry by offering our clients with syndicated and customized market research reports featuring coverage of entire market as well as meticulous research and analyst insights.

While we don't replace traditional research, we flip the method upside down. Our dual approach of Top Bottom & Bottom Top ensures quality deliverable by not just verifying company fundamentals but also looking at the sector and macroeconomic factors.

With one step in the future, our research team constantly tries to show you the bigger picture. We help with some of the tough questions you may encounter along the way: How is the industry positioned? Best marketing channel? KPI's of competitors? By aligning every element, we help maximize success.

Our report gives you instant access to the answers and sources that other companies might choose to hide. We elaborate each steps of research methodology we have used and showcase you the sample size to earn your trust.

If you need any support, we are here! We pride ourselves on universe strength, data quality, and quick, friendly, and professional service.