


Global Industrial Nitrogen Generator Market Outlook to 2030
Region:Global
Author(s):Mukul
Product Code:KROD10229
November 2024
83
About the Report
Global Industrial Nitrogen Generator Market Overview
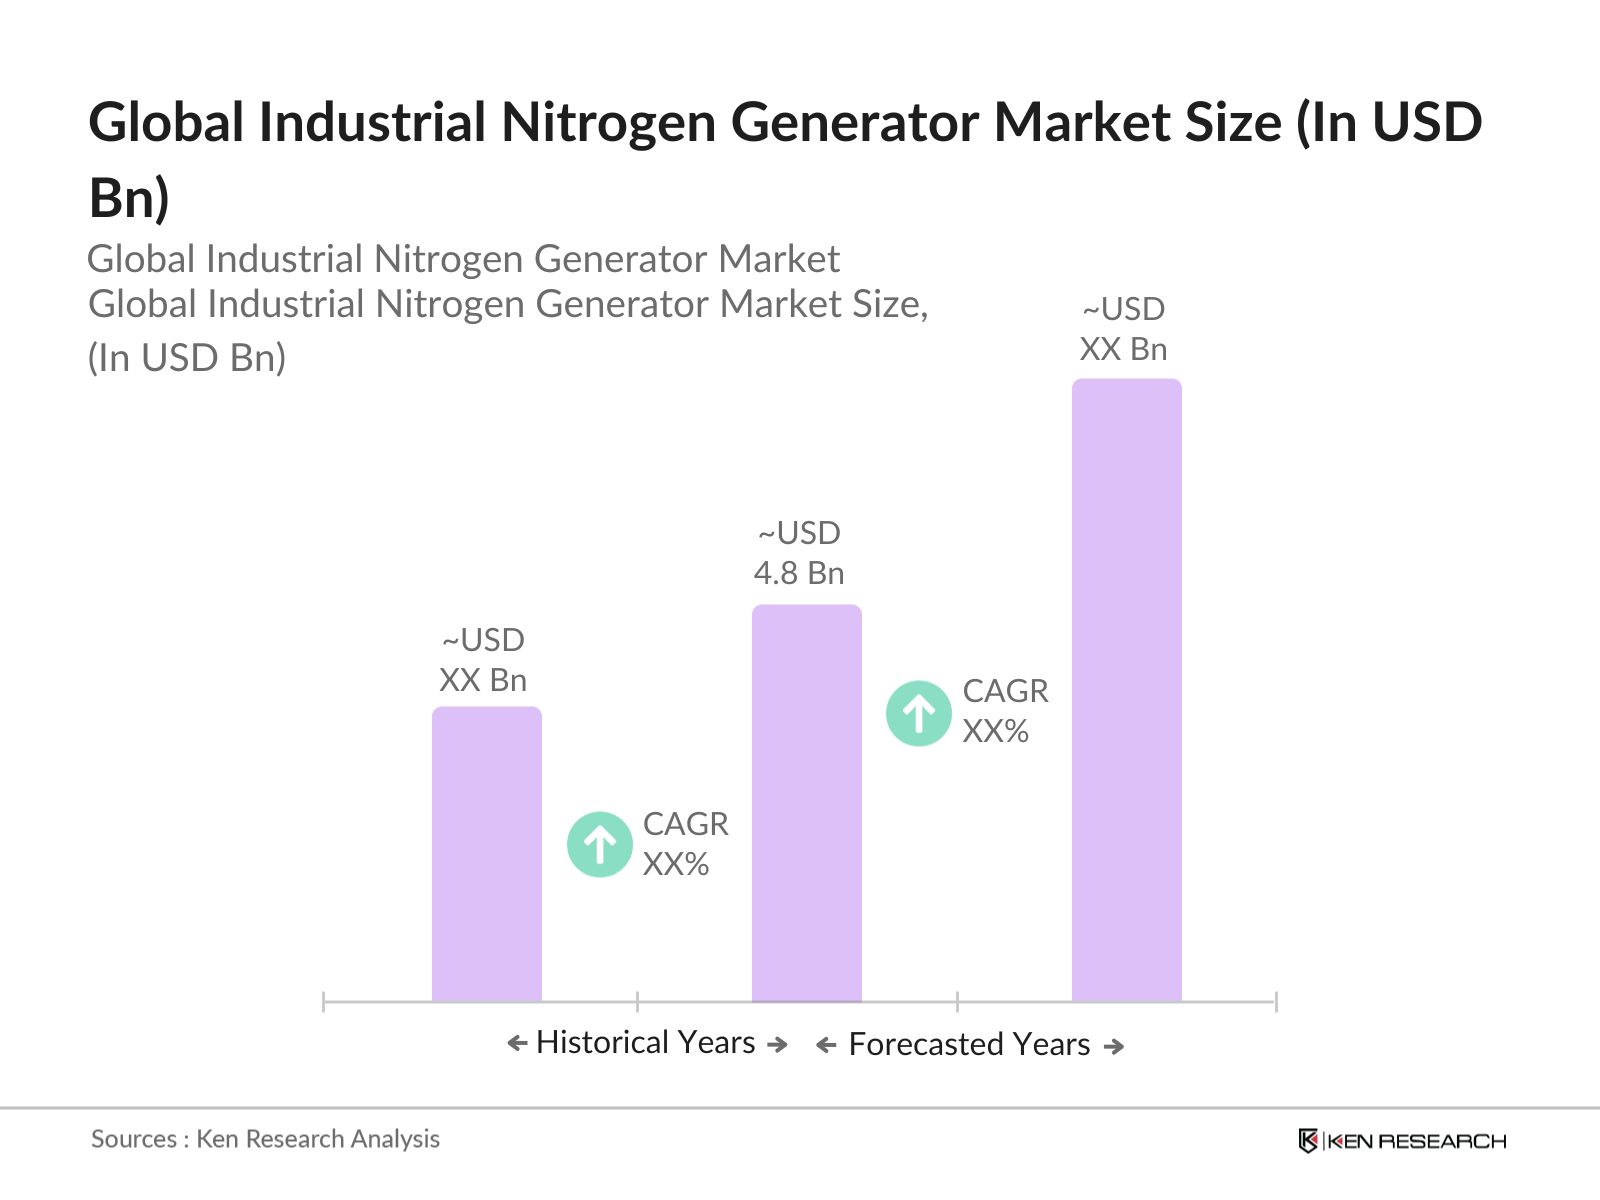
- The global industrial nitrogen generator market is valued at USD 4.8 billion, driven by increasing demand for nitrogen across industries such as food & beverage, chemical, and electronics manufacturing. The growing adoption of on-site nitrogen generators for cost-efficiency and the need for pure nitrogen in packaging and preservation processes are key market drivers. Additionally, industries like pharmaceuticals and oil & gas have steadily contributed to the demand due to stringent quality and safety standards requiring nitrogen for production and processing.
- Countries like the United States, China, and Germany dominate the industrial nitrogen generator market due to their well-established industrial infrastructure, advanced technological capabilities, and high demand from various end-use sectors. The United States, with its robust food processing and pharmaceutical industries, and China, driven by rapid industrialization and growth in electronics and chemicals, lead the global market.
- Environmental regulations have tightened in recent years, with governments enforcing stricter controls on emissions from industrial nitrogen generation processes. The U.S. Environmental Protection Agency reported in 2024 that nitrogen production facilities are now required to reduce greenhouse gas emissions by 10% under new federal guidelines. Compliance with these regulations is essential for industries that produce nitrogen on-site, and failure to do so can result in hefty fines and operational shutdowns. The push for cleaner industrial processes continues to shape the nitrogen generator market.
Global Industrial Nitrogen Generator Market Segmentation
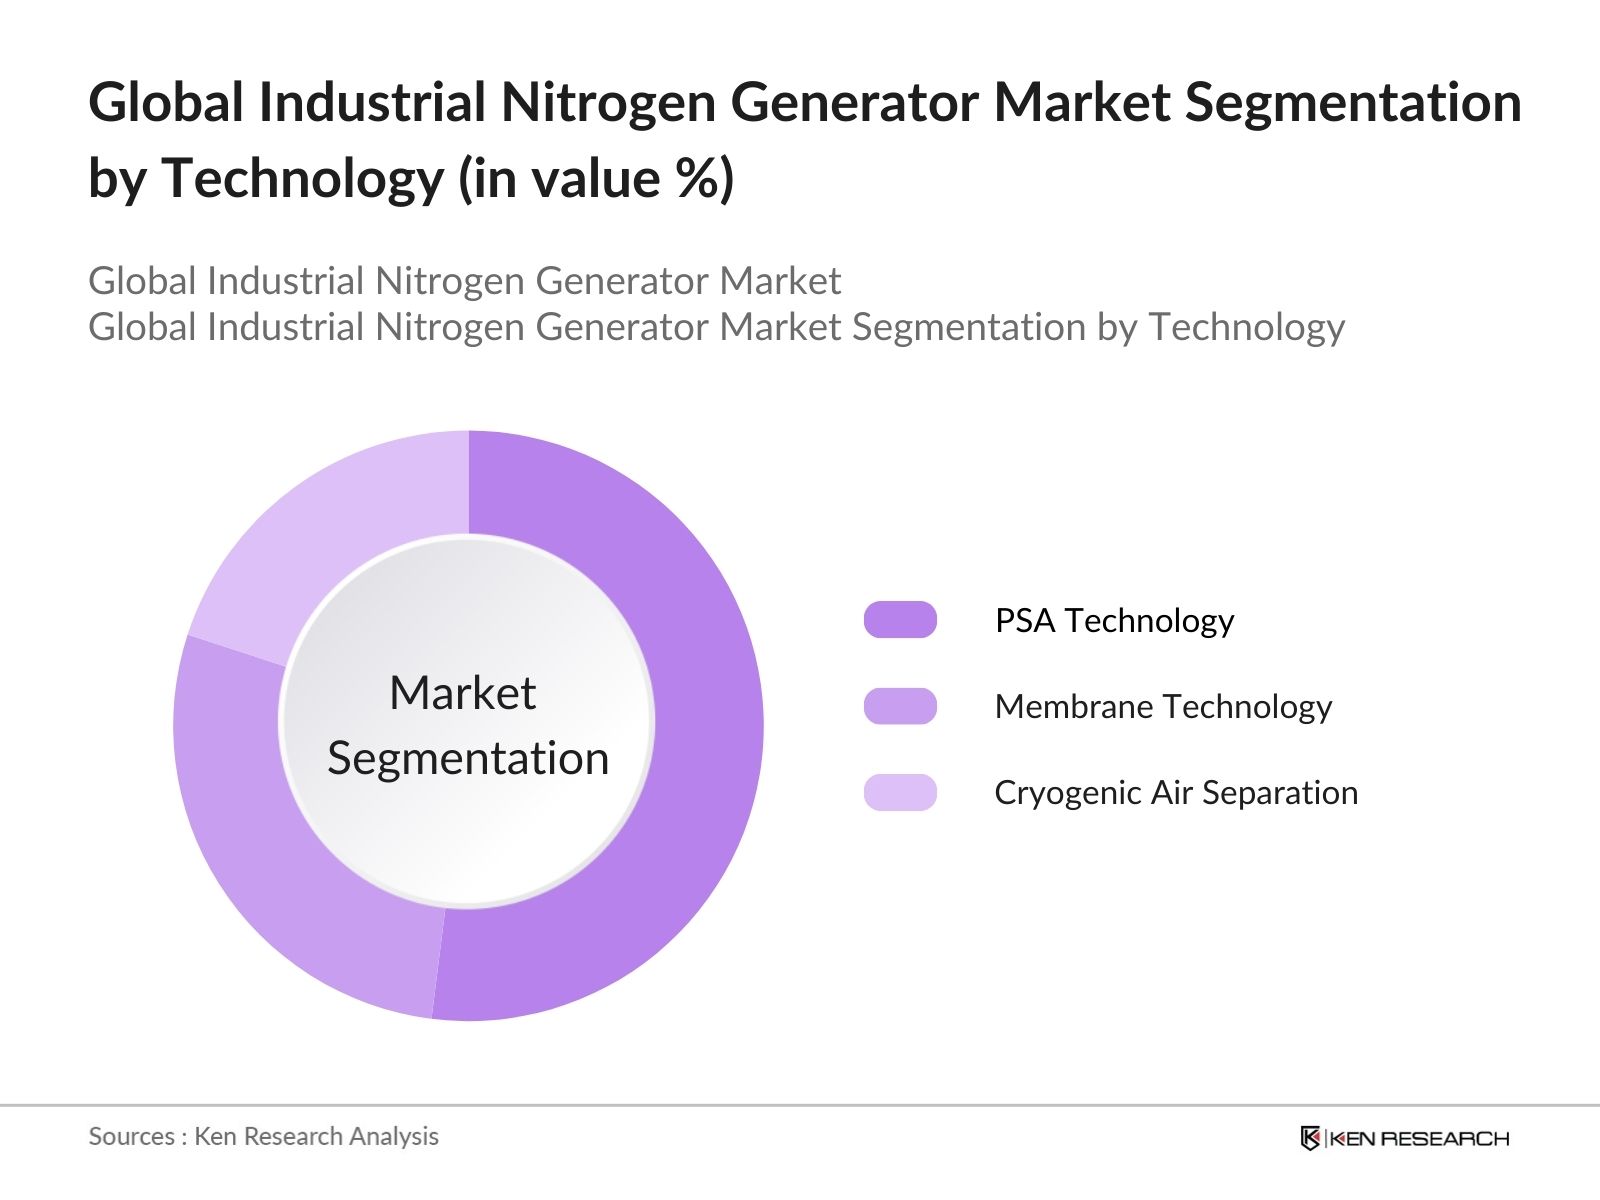
- By Technology: The industrial nitrogen generator market is segmented by technology into Pressure Swing Adsorption (PSA), Membrane Technology, and Cryogenic Air Separation. PSA technology dominates this segment as it offers a reliable, cost-effective method for generating high-purity nitrogen on-site. This technology has gained popularity, particularly in industries like food & beverage and pharmaceuticals, where nitrogen purity is critical. Membrane technology, although more energy-efficient, is generally used for lower purity needs, while cryogenic separation remains relevant in high-demand industrial applications.
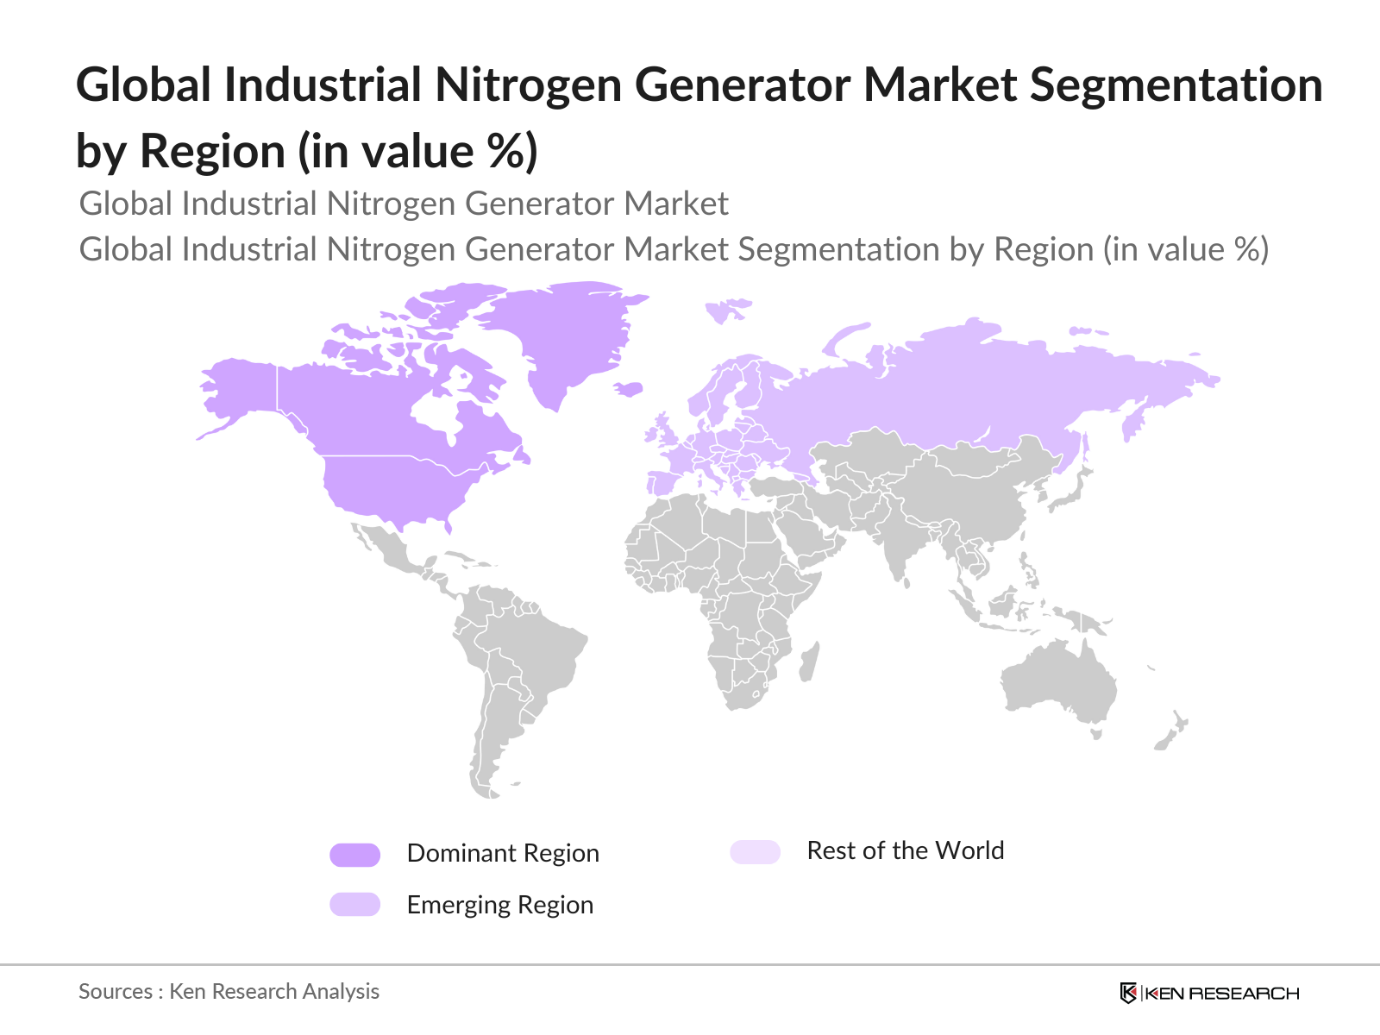
- By Region: The industrial nitrogen generator market is segmented into North America, Europe, Asia-Pacific, Latin America, and Middle East & Africa. North America leads the market, driven by demand from its established food processing, electronics, and chemical industries. The Asia-Pacific region, particularly China and India, is expected to witness rapid growth due to rising industrialization and expanding end-use industries.
- By End-Use Industry: The market is segmented by end-use into Food & Beverage, Chemicals & Pharmaceuticals, Electronics Manufacturing, Oil & Gas, and Automotive & Aerospace. The food & beverage sector holds a dominant share in the market due to the growing need for nitrogen in packaging, preservation, and storage of perishable goods. Nitrogens role in enhancing food safety by displacing oxygen and inhibiting spoilage makes it essential. The pharmaceuticals industry is also a key user of high-purity nitrogen for drug production and research processes.
Global Industrial Nitrogen Generator Market Competitive Landscape
The industrial nitrogen generator market is consolidated, with a few key players dominating due to their technological advancements, extensive distribution networks, and strategic acquisitions. Major players include Air Products and Chemicals, Atlas Copco, Parker Hannifin, and Linde plc. These companies benefit from strong R&D investments, enabling them to offer innovative solutions, such as energy-efficient and compact nitrogen generators that cater to the needs of diverse industries.
|
Company |
Establishment Year |
Headquarters |
Production Capacity |
R&D Investment |
Revenue (USD) |
Market Share (%) |
Technology Portfolio |
No. of Employees |
|
Air Products and Chemicals, Inc. |
1940 |
Pennsylvania, USA |
- |
- |
- |
- |
- |
- |
|
Atlas Copco |
1873 |
Nacka, Sweden |
- |
- |
- |
- |
- |
- |
|
Parker Hannifin |
1917 |
Cleveland, USA |
- |
- |
- |
- |
- |
- |
|
Linde plc |
1879 |
Dublin, Ireland |
- |
- |
- |
- |
- |
- |
|
Air Liquide |
1902 |
Paris, France |
- |
- |
- |
- |
- |
- |
Global Industrial Nitrogen Generator Industry Analysis
Growth Drivers
- Increasing Demand from Food & Beverage Industry: The food and beverage industry has seen a surge in demand for nitrogen generators, particularly for food preservation, where nitrogen is used to displace oxygen and slow down the oxidation process. According to the U.S. Department of Agriculture, the global food industry is valued at $8.1 trillion in 2023, showing robust growth due to increased consumption. Nitrogen generators help maintain the freshness of packaged food, beverages, and dairy products. This demand has grown significantly in 2024, especially in Asia, where food processing and packaging industries are rapidly expanding.
- Rising Industrial Automation: The automation industry has grown globally, driven by increased demand for high precision in manufacturing. By 2023, global manufacturing output reached $16.3 trillion, largely driven by the transition to automated systems that rely on nitrogen to maintain inert atmospheres. The World Economic Forum highlights how automation has become integral in the chemical and electronics sectors, where nitrogen generators are key to process control and safety. These generators ensure a consistent supply of nitrogen, improving efficiency and reducing operational downtime.
- Growing Chemical and Pharmaceutical Sectors: Chemical and pharmaceutical industries heavily rely on nitrogen for inerting, blanketing, and packaging to prevent contamination and ensure product stability. The global pharmaceutical industry was valued at $1.5 trillion in 2023, with significant growth in production facilities requiring cost-efficient on-site nitrogen generation. In 2024, the World Health Organization reported increasing pharmaceutical exports in emerging markets such as India and China, where nitrogen generators are being integrated into new facilities to meet production demands.
Market Restraints
- Fluctuating Raw Material Prices: Raw materials required for the production of nitrogen generators, including metals such as stainless steel and aluminum, have seen fluctuating prices due to supply chain disruptions. In 2024, the International Monetary Fund reported that global metal prices increased by 5-10%, driven by geopolitical instability and inflationary pressures. These fluctuations affect the overall production cost of nitrogen generators, making it difficult for manufacturers to maintain consistent pricing. The volatile nature of commodity markets poses an ongoing challenge for equipment producers and buyers alike.
- Complexity in Technology Integration: Integrating nitrogen generators into existing industrial processes can be complex, particularly for sectors with legacy systems. The transition from traditional nitrogen supply methods (e.g., gas cylinders) to on-site generation requires reconfiguration of pipelines, safety systems, and operational processes. In 2022, 30% of industrial manufacturers in North America reported difficulties in retrofitting nitrogen generation systems into their operations, according to the U.S. Bureau of Labor Statistics. This complexity can lead to delays in adoption, especially for industries that rely on continuous production.
Global Industrial Nitrogen Generator Future Outlook
Over the next five years, the global industrial nitrogen generator market is expected to experience significant growth due to the rising demand for high-purity nitrogen in critical applications such as food packaging, pharmaceuticals, and electronics manufacturing. The market will also benefit from advancements in membrane and PSA technologies that offer energy efficiency and reduced operational costs. Additionally, the increasing adoption of on-site nitrogen generation solutions is expected to drive further growth, as industries seek to cut reliance on third-party suppliers.
Market Opportunities
- Expansion into Emerging Markets: Emerging markets in Asia and Africa present significant opportunities for nitrogen generator manufacturers. According to the World Bank, industrial production in these regions grew by 4.5% annually between 2022 and 2023, driven by increased foreign direct investment in manufacturing and infrastructure projects. Countries like India, Vietnam, and Nigeria are expanding their industrial base, leading to heightened demand for nitrogen generators across sectors such as pharmaceuticals, chemicals, and food processing. This trend continues in 2024, supported by government initiatives to enhance domestic manufacturing capabilities.
- Technological Advancements in Membrane and PSA Systems: Technological innovations in Pressure Swing Adsorption (PSA) and membrane nitrogen generators have made these systems more efficient and scalable. In 2023, the global industrial sector saw a 15% reduction in energy consumption for nitrogen production due to improved PSA systems, as reported by the International Energy Agency. These advancements have reduced operational costs and improved the purity levels of generated nitrogen, making them attractive to industries that require highly pure nitrogen, such as electronics and pharmaceuticals. The continued development of these technologies presents significant growth opportunities in 2024.
Scope of the Report
|
Technology |
Pressure Swing Adsorption (PSA) |
|
End-use Industry |
Food & Beverage |
|
Purity Level |
95% - 99% |
|
Delivery Mode |
On-site Generation |
|
Region |
North America |
Products
Key Target Audience
Food & Beverage Manufacturers
Pharmaceutical Companies
Electronics Manufacturers
Chemical Processing Companies
Oil & Gas Industry
Automotive & Aerospace Industries
Investor and Venture Capitalist Firms
Government and Regulatory Bodies (e.g., US Environmental Protection Agency, European Food Safety Authority)
Companies
Players Mentioned in the Report:
Air Products and Chemicals, Inc.
Atlas Copco
Parker Hannifin
Linde plc
Air Liquide
Hitachi Industrial Equipment Systems Co., Ltd.
Peak Scientific
NOVAIR
Oxymat A/S
On Site Gas Systems, Inc.
South-Tek Systems
GENERON
PCI Gases
Proton OnSite
Ingersoll Rand
Table of Contents
1. Global Industrial Nitrogen Generator Market Overview
1.1. Definition and Scope
1.2. Market Taxonomy (Industry Players, Production Process, End-use Industries)
1.3. Market Growth Rate
1.4. Market Segmentation Overview (Based on Technology, End-use, Purity Level, Region)
2. Global Industrial Nitrogen Generator Market Size (In USD Bn)
2.1. Historical Market Size
2.2. Year-On-Year Growth Analysis
2.3. Key Market Developments and Milestones (Production Volume, Installation Base)
3. Global Industrial Nitrogen Generator Market Analysis
3.1. Growth Drivers
3.1.1. Increasing Demand from Food & Beverage Industry
3.1.2. Rising Industrial Automation
3.1.3. Growing Chemical and Pharmaceutical Sectors
3.1.4. Demand for Cost-effective On-site Nitrogen Generation 3.2. Market Challenges
3.2.1. High Initial Investment Cost
3.2.2. Fluctuating Raw Material Prices
3.2.3. Complexity in Technology Integration 3.3. Opportunities
3.3.1. Expansion into Emerging Markets
3.3.2. Technological Advancements in Membrane and PSA Systems
3.3.3. Increasing Applications in Additive Manufacturing
3.4. Trends
3.4.1. Use of IoT in Nitrogen Generators for Monitoring Efficiency
3.4.2. Energy-efficient Systems
3.4.3. Integration with Renewable Energy Sources
3.5. Government Regulation
3.5.1. Environmental Compliance for Nitrogen Generation
3.5.2. Standards for Food-grade Nitrogen (FDA, ISO Certifications)
3.5.3. Emission Control Norms in Industrial Applications
3.6. SWOT Analysis
3.6.1. Strengths (Customization Capabilities, Technological Innovation)
3.6.2. Weaknesses (Capital Intensity, Limited Adoption in SMEs)
3.6.3. Opportunities (Growing Demand from Developing Economies)
3.6.4. Threats (Alternative Technologies)
3.7. Stakeholder Ecosystem
3.7.1. Raw Material Suppliers
3.7.2. Equipment Manufacturers
3.7.3. End-users and Distributors
3.8. Porters Five Forces
3.8.1. Bargaining Power of Suppliers
3.8.2. Bargaining Power of Buyers
3.8.3. Threat of New Entrants
3.8.4. Threat of Substitutes
3.8.5. Competitive Rivalry
3.9. Competition Ecosystem
3.9.1. Product Differentiation
3.9.2. Pricing Strategies
3.9.3. Technological Capabilities
4. Global Industrial Nitrogen Generator Market Segmentation
4.1. By Technology (In Value %)
4.1.1. Pressure Swing Adsorption (PSA)
4.1.2. Membrane Technology
4.1.3. Cryogenic Air Separation
4.2. By End-use Industry (In Value %)
4.2.1. Food & Beverage
4.2.2. Chemicals & Pharmaceuticals
4.2.3. Electronics Manufacturing
4.2.4. Oil & Gas
4.2.5. Automotive & Aerospace
4.3. By Purity Level (In Value %)
4.3.1. 95% - 99%
4.3.2. 99% - 99.9%
4.3.3. 99.9% - 99.999%
4.4. By Delivery Mode (In Value %)
4.4.1. On-site Generation
4.4.2. Bulk Supply
4.4.3. Cylinder-based Supply
4.5. By Region (In Value %)
4.5.1. North America
4.5.2. Europe
4.5.3. Asia-Pacific
4.5.4. Latin America
4.5.5. Middle East & Africa
5. Global Industrial Nitrogen Generator Market Competitive Analysis
5.1. Detailed Profiles of Major Companies
5.1.1. Air Products and Chemicals, Inc.
5.1.2. Atlas Copco
5.1.3. Parker Hannifin
5.1.4. Linde plc
5.1.5. Air Liquide
5.1.6. Ingersoll Rand
5.1.7. Hitachi Industrial Equipment Systems Co., Ltd.
5.1.8. Peak Scientific
5.1.9. NOVAIR
5.1.10. Oxymat A/S
5.1.11. On Site Gas Systems, Inc.
5.1.12. South-Tek Systems
5.1.13. GENERON
5.1.14. PCI Gases
5.1.15. Proton OnSite
5.2. Cross Comparison Parameters
5.2.1. Production Capacity
5.2.2. Headquarters
5.2.3. Revenue (In USD Mn)
5.2.4. Inception Year
5.2.5. R&D Investment
5.2.6. Regional Presence
5.2.7. No. of Employees
5.2.8. Market Share
5.3. Market Share Analysis
5.4. Strategic Initiatives
5.5. Mergers and Acquisitions
5.6. Investment Analysis
5.7. Venture Capital Funding
5.8. Government Grants
5.9. Private Equity Investments
6. Global Industrial Nitrogen Generator Market Regulatory Framework
6.1. Environmental Standards
6.2. Compliance Requirements
6.3. Certification Processes (ISO 8573, FDA Guidelines)
7. Global Industrial Nitrogen Generator Future Market Size (In USD Bn)
7.1. Future Market Size Projections
7.2. Key Factors Driving Future Market Growth
8. Global Industrial Nitrogen Generator Future Market Segmentation
8.1. By Technology (In Value %)
8.2. By End-use Industry (In Value %)
8.3. By Purity Level (In Value %)
8.4. By Delivery Mode (In Value %)
8.5. By Region (In Value %)
9. Global Industrial Nitrogen Generator Market Analysts Recommendations
9.1. TAM/SAM/SOM Analysis
9.2. Customer Cohort Analysis
9.3. Marketing Initiatives
9.4. White Space Opportunity Analysis
Research Methodology
Step 1: Identification of Key Variables
The initial step involved mapping the global industrial nitrogen generator ecosystem, including stakeholders such as manufacturers, suppliers, and end-users. This was supported by extensive desk research from secondary databases and proprietary sources to identify critical market variables such as demand drivers and technological innovations.
Step 2: Market Analysis and Construction
This phase involved compiling historical data on nitrogen generator sales and industry applications. We analyzed market penetration rates across various sectors, such as food & beverage and pharmaceuticals, to understand their impact on revenue generation and market growth.
Step 3: Hypothesis Validation and Expert Consultation
Through telephone interviews with industry experts and key market players, market hypotheses were validated. These consultations helped refine the understanding of market dynamics, technological trends, and the competitive landscape.
Step 4: Research Synthesis and Final Output
The final stage included primary interviews with nitrogen generator manufacturers to gain insights into segment-specific performance, customer preferences, and sales trends. This data was used to confirm the findings from our bottom-up approach, ensuring a comprehensive analysis of the market.
Frequently Asked Questions
01. How big is the global industrial nitrogen generator market?
The global industrial nitrogen generator market is valued at USD 4.8 billion, driven by strong demand from industries like food & beverage, pharmaceuticals, and electronics.
02. What are the key challenges in the global industrial nitrogen generator market?
The market faces challenges such as high initial investment costs and fluctuating raw material prices, which impact profitability and deter small- and medium-sized enterprises from adopting these systems.
03. Who are the major players in the global industrial nitrogen generator market?
Key players include Air Products and Chemicals, Atlas Copco, Parker Hannifin, Linde plc, and Air Liquide. These companies dominate due to their technological innovations and strong distribution networks.
04. What are the growth drivers of the global industrial nitrogen generator market?
The market is driven by the rising demand for high-purity nitrogen in critical applications, the cost advantages of on-site generation, and advancements in PSA and membrane technologies that enhance energy efficiency.
Why Buy From Us?
 Framework")
What makes us stand out is that our consultants follows Robust, Refine and Result (RRR) methodology. i.e. Robust for clear definitions, approaches and sanity checking, Refine for differentiating respondents facts and opinions and Result for presenting data with story

We have set a benchmark in the industry by offering our clients with syndicated and customized market research reports featuring coverage of entire market as well as meticulous research and analyst insights.

While we don't replace traditional research, we flip the method upside down. Our dual approach of Top Bottom & Bottom Top ensures quality deliverable by not just verifying company fundamentals but also looking at the sector and macroeconomic factors.

With one step in the future, our research team constantly tries to show you the bigger picture. We help with some of the tough questions you may encounter along the way: How is the industry positioned? Best marketing channel? KPI's of competitors? By aligning every element, we help maximize success.

Our report gives you instant access to the answers and sources that other companies might choose to hide. We elaborate each steps of research methodology we have used and showcase you the sample size to earn your trust.

If you need any support, we are here! We pride ourselves on universe strength, data quality, and quick, friendly, and professional service.