
Global Maple Syrup Market Outlook 2030
Region:Global
Author(s):Shivani Mehra
Product Code:KROD11386
December 2024
84
About the Report
Global Maple Syrup Market Overview
- The global maple syrup market has seen significant growth, with the market valued at USD 932.2million, driven by increasing consumer demand for natural sweeteners and health-conscious food alternatives. Maple syrup, a natural sweetener rich in antioxidants and minerals, is gaining preference over artificial sweeteners due to rising health awareness. This growth is further supported by the expanding food and beverage industry, where maple syrup is used in various products, including bakery items, beverages, and sauces.

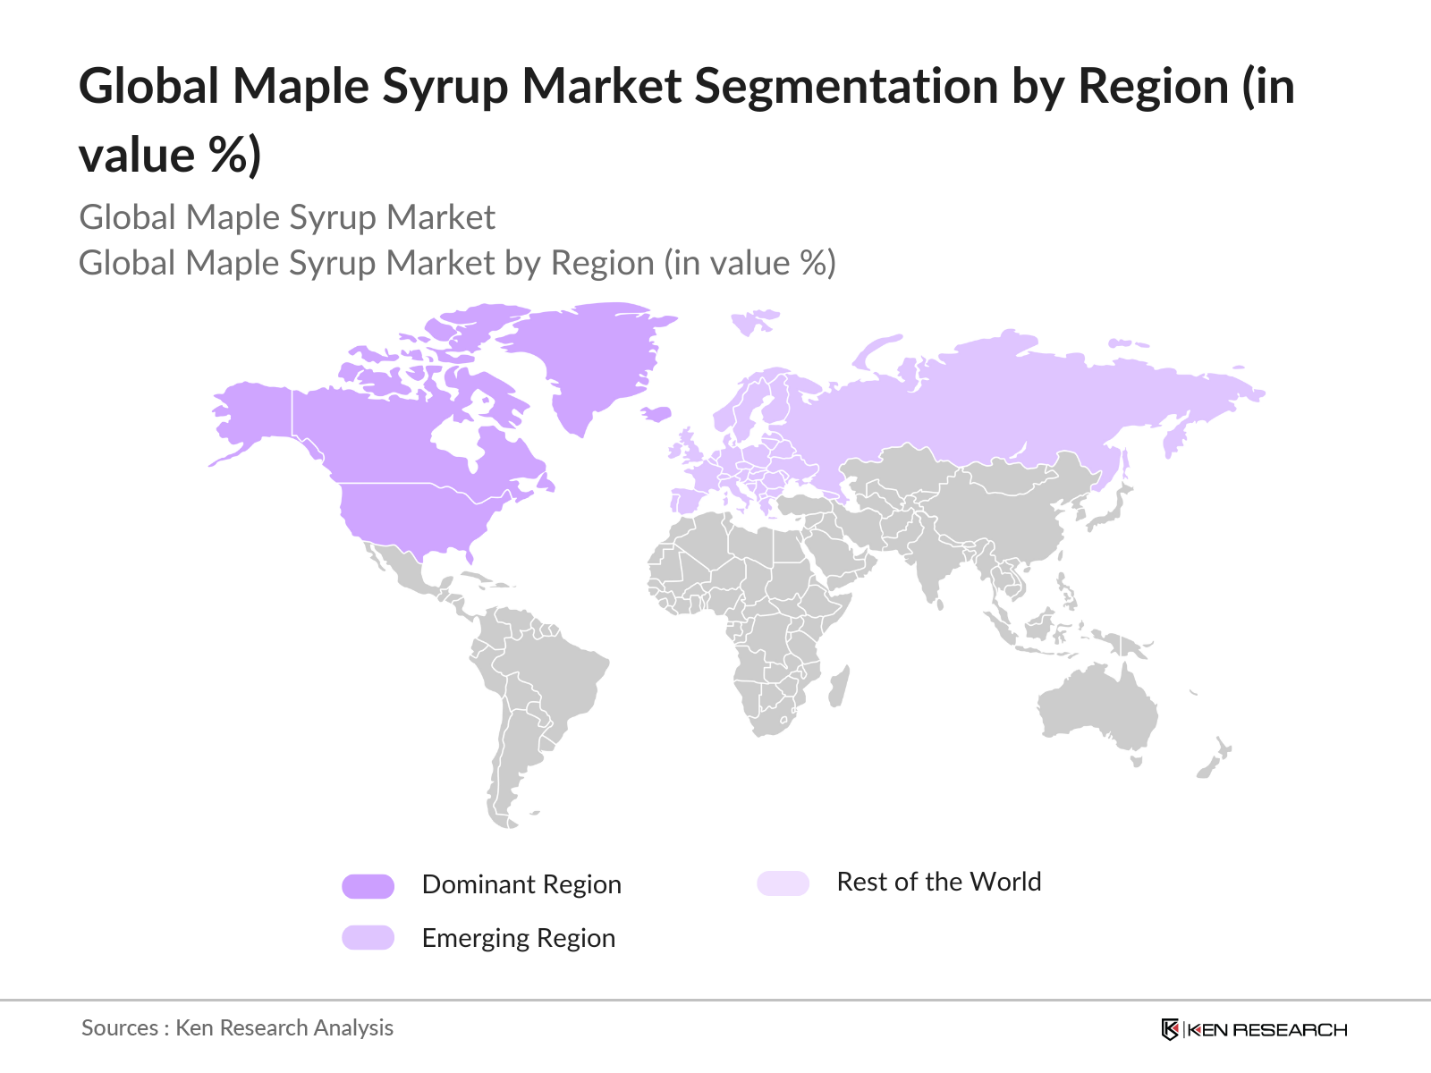
- North America, particularly Canada and the United States, dominates the maple syrup market due to its vast production capacity and long-standing tradition of maple syrup extraction. Favorable climatic conditions, such as cold winters and mild spring temperatures, make these regions ideal for maple tree cultivation. The dominance of these regions is further reinforced by their well-established infrastructure and government support for maple syrup producers.
- Governments are increasingly implementing environmental standards to promote sustainable agriculture, impacting maple syrup production. In 2023, the USDA announced stricter regulations on land use and deforestation, which are expected to impact maple syrup producers who rely on maple forests. These regulations aim to protect ecosystems and ensure sustainable production practices, which will be crucial for the long-term viability of the industry. Adherence to these standards will likely raise production costs but will also enhance the marketability of maple syrup as a sustainable product.
Global Maple Syrup Market Segmentation
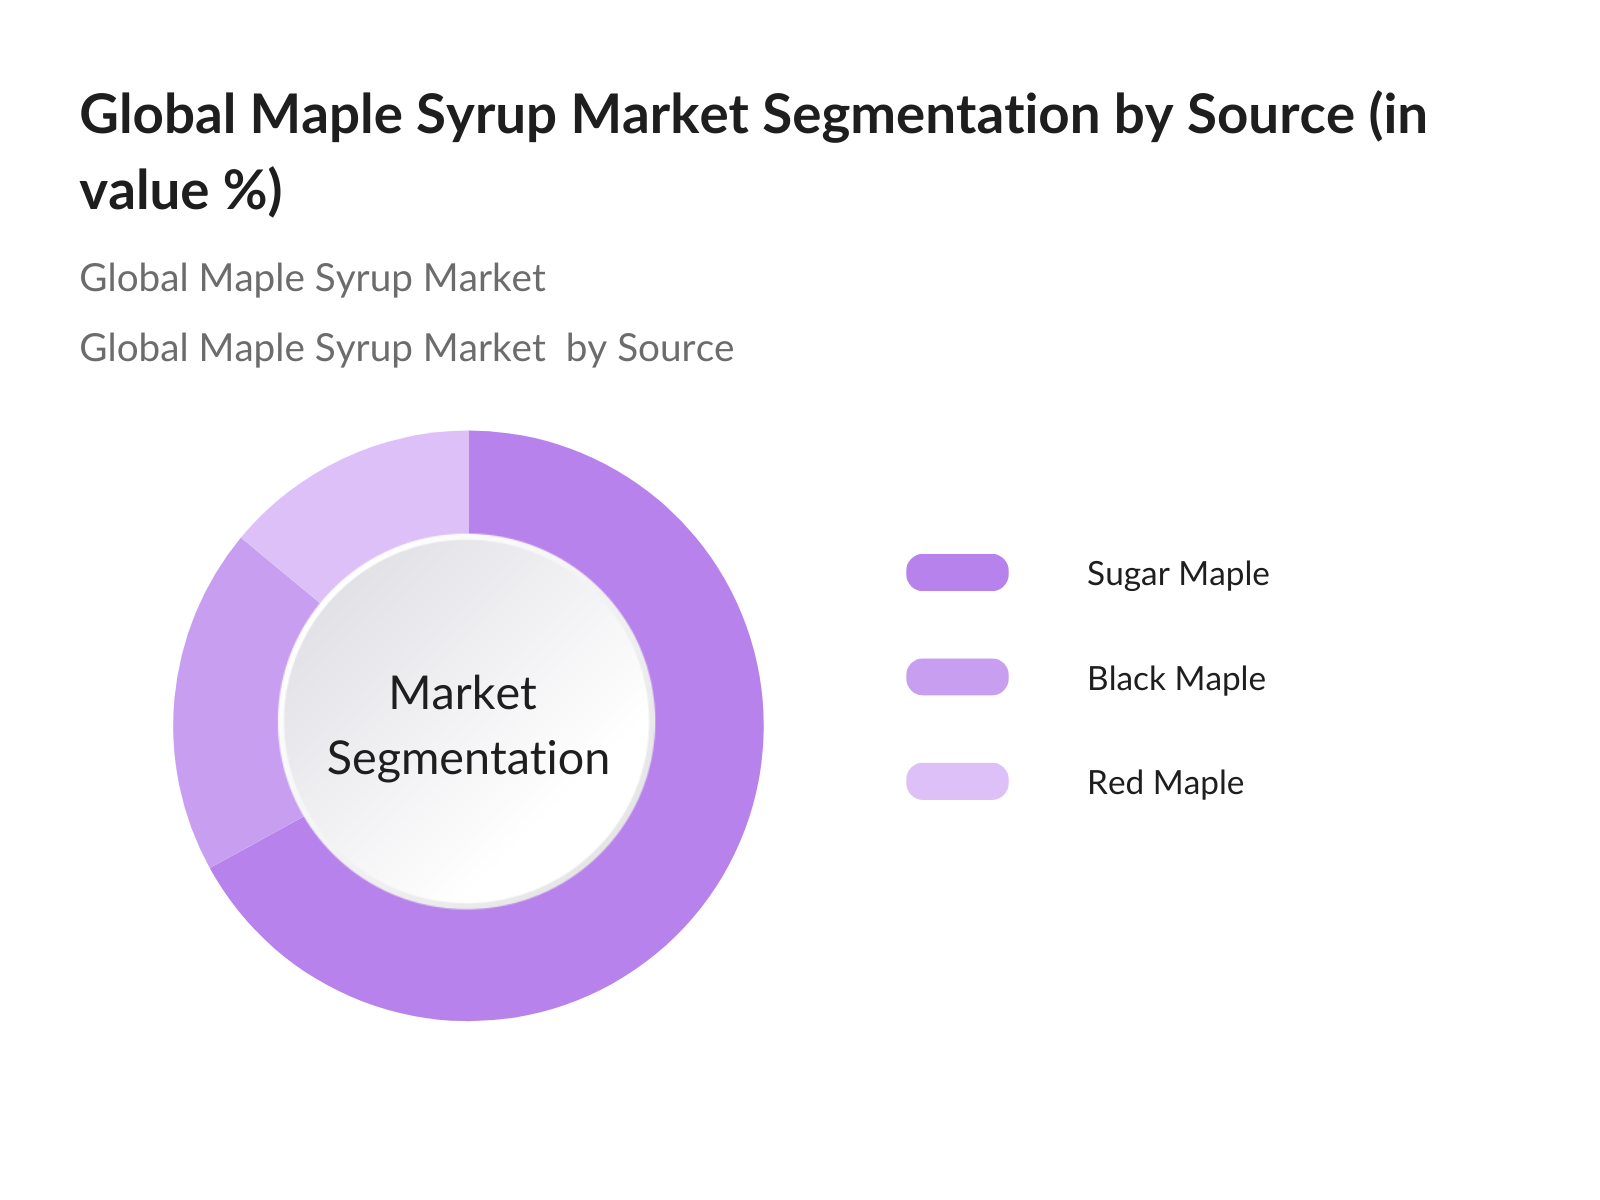
By Source: The global maple syrup market is segmented by source into Sugar Maple, Black Maple, and Red Maple. Sugar Maple is the leading source, accounting for the highest market share due to its rich sap content and wide availability in North America. The widespread use of sugar maple sap in producing high-quality syrup makes it the most preferred option among manufacturers. This segments dominance is also supported by the fact that sugar maple trees produce a higher yield of sap, leading to better profitability for producers.
By Region: The global maple syrup market includes North America, Europe, Asia-Pacific, South America, and Middle East & Africa. North America holds the largest share, driven by Canada and the United States' dominance in maple syrup production. Europe's growing preference for natural sweeteners and Asia-Pacific's increasing disposable income and health-conscious population have fueled demand in these regions.
Global Maple Syrup Market Competitive Landscape
The global maple syrup market is highly consolidated, with key players dominating the landscape. This consolidation is evident in North America, where traditional maple syrup producers continue to hold a significant share of the market. Major companies focus on expanding their product lines, investing in sustainable production methods, and leveraging e-commerce platforms to reach a broader audience.
|
Company |
Established Year |
Headquarters |
Revenue (2023) |
Employees |
Production Capacity (Tons) |
Sustainability Programs |
Product Range |
Certifications |
Distribution Network |
|
B & G Foods, Inc. |
1996 |
New Jersey, USA |
$2.05 billion |
- |
- |
- |
- |
- |
- |
|
The J.M. Smucker Co. |
1897 |
Ohio, USA |
$8.0 billion |
- |
- |
- |
- |
- |
- |
|
Federation of Quebec Maple Syrup Producers |
1966 |
Quebec, Canada |
$350 million |
- |
- |
- |
- |
- |
- |
|
Les Industries Bernard et Fils Ltee |
1920 |
Quebec, Canada |
$500 million |
- |
- |
- |
- |
- |
- |
|
Bascom Maple Farms |
1853 |
New Hampshire, USA |
$250 million |
- |
- |
- |
- |
- |
- |
Global Maple Syrup Market Analysis
Market Growth Drivers
- Increasing Demand for Organic Sweeteners: The demand for organic sweeteners like maple syrup has surged due to increasing consumer preferences for natural products. According to World Bank data, global consumer expenditure on organic foods reached $140 billion in 2023, with a growing portion being allocated to natural sweeteners like maple syrup. North America and Europe are witnessing the highest consumption rates of organic products, further driving the demand for maple syrup. In 2023, the organic food industry is expected to see significant growth, primarily driven by the push towards healthy eating habits, underpinned by rising disposable income across key regions.
- Expanding Applications in Food & Beverage Industry (Culinary and Bakery Use): Maple syrup is becoming an essential ingredient in the food and beverage industry, particularly in bakery and culinary applications. The food industry has seen a consistent rise in the use of natural sweeteners in recent years, with maple syrup finding applications in bread, pastries, sauces, and marinades. The Food and Agriculture Organization (FAO) reported that the global bakery market was valued at over $200 billion in 2023, with an increasing trend towards natural sweeteners. Restaurants and food processors are adopting maple syrup for its unique flavor profile, contributing to its rising demand in this segment.
- Rising Online Retail Penetration (Growth in E-commerce): The growth of e-commerce has significantly contributed to the accessibility of maple syrup. According to the United Nations Conference on Trade and Development (UNCTAD), global e-commerce sales surpassed $5 trillion in 2023, with food and beverage products constituting a large share. Online retail platforms have allowed consumers to purchase organic and premium products like maple syrup more conveniently, particularly in regions where it was traditionally difficult to obtain. This shift has also made it easier for small producers to reach international markets, further driving demand for maple syrup.
Market Challenges:
- Climate Change Impact on Sap Production: Climate change poses a significant challenge to maple syrup production, as sap flow is highly dependent on specific temperature conditions. A report by the Intergovernmental Panel on Climate Change (IPCC) in 2023 noted that rising global temperatures are disrupting the sap collection season, shortening it in several maple-producing regions, particularly in North America. This impacts yield and could reduce production capacity, threatening the long-term sustainability of the industry. Variability in temperature patterns has also caused a reduction in the sugar content of sap, affecting both quantity and quality.
- Competition from Alternative Sweeteners (Honey, Agave, etc.): Maple syrup faces increasing competition from alternative sweeteners such as honey, agave syrup, and coconut sugar. According to the FAO, global honey production reached 1.9 million metric tons in 2023, with consumption continuing to rise due to its health benefits and versatility. Similarly, agave syrup, popular for its lower glycemic index, has seen growing demand, particularly in Latin America and Europe. This competition is squeezing market share for maple syrup, particularly in regions where these alternatives are more affordable or easier to produce domestically.
Global Maple Syrup Market Future Outlook
Over the next five years, the global maple syrup market is expected to witness significant growth, driven by increased consumer demand for natural and organic sweeteners, the expansion of product applications in various industries, and rising health consciousness. The growing adoption of maple syrup as an alternative to artificial sweeteners in both household and commercial settings is anticipated to boost market growth. The e-commerce sector will continue to play a crucial role in facilitating this expansion by enabling manufacturers to reach a global audience more effectively.
Market Opportunities:
- Expanding Global Distribution (Asia-Pacific and Europe Market Penetration): Maple syrup is gaining traction in markets outside North America, particularly in Asia-Pacific and Europe. According to the World Trade Organization (WTO), international trade in organic food products, including natural sweeteners like maple syrup, increased by 7% in 2023. Countries like Japan, South Korea, and Germany have shown a growing interest in organic and clean-label products, making these regions key opportunities for market expansion. European imports of maple syrup have grown steadily, driven by demand in the food service sector and health-conscious consumers.
- Organic and Natural Product Preferences (Consumer Shift to Natural Ingredients): There is a clear consumer shift towards organic and natural ingredients, with the organic food sector experiencing rapid growth. The World Bank reported that in 2023, global consumer spending on organic foods increased to $140 billion. Maple syrup, as a natural and minimally processed sweetener, benefits from this trend. More consumers are choosing maple syrup over artificial sweeteners due to its perceived health benefits and organic nature. This growing demand for organic products is expected to drive further growth in the maple syrup market.
Scope of the Report
|
By Source |
Sugar Maple Black Maple Red Maple |
|
By Distribution Channel |
Offline Online |
|
By Application |
Bakery & Confectionery Beverages Breakfast Products Sauces & Dressings |
|
By Packaging Type |
Bottles Jars Sachets Pouches |
|
By Region |
North America Europe Asia-Pacific South America Middle East & Africa |
Products
Key Target Audience
Maple syrup producers
Food and beverage manufacturers
Retailers and distributors (supermarkets, specialty stores)
E-commerce platforms
Investments and venture capitalist firms
Government and regulatory bodies (FDA, USDA)
Organic certification bodies
Sustainability-focused organizations
Companies
Players Mention in the Report
B & G Foods, Inc.
The J.M. Smucker Co.
Federation of Quebec Maple Syrup Producers
Bascom Maple Farms
Les Industries Bernard et Fils Ltee
Coombs Family Farms
Butternut Mountain Farm
LB Maple Treat Corporation
Conagra Brands Inc.
Ferguson Farm Vermont Maple Syrup
Highland Sugarworks
Maple Grove Farms
Spring Tree Maple Syrup
Crown Maple Syrup
Atkinson Maple Syrup
Table of Contents
1. Global Maple Syrup Market Overview
1.1. Definition and Scope
1.2. Market Taxonomy
1.3. Market Dynamics Overview
1.4. Market Segmentation Overview
2. Global Maple Syrup Market Size (in USD)
2.1. Historical Market Size (in USD)
2.2. Year-on-Year Growth Analysis (In Percentage)
2.3. Key Market Developments and Milestones
3. Global Maple Syrup Market Analysis
3.1. Growth Drivers
3.1.1. Increasing Demand for Organic Sweeteners
3.1.2. Rising Health Consciousness and Nutritional Benefits (Maple Syrup vs. Artificial Sweeteners)
3.1.3. Expanding Applications in Food & Beverage Industry (Culinary and Bakery Use)
3.1.4. Rising Online Retail Penetration (Growth in E-commerce)
3.2. Market Challenges
3.2.1. Climate Change Impact on Sap Production
3.2.2. Competition from Alternative Sweeteners (Honey, Agave, etc.)
3.2.3. Price Volatility and Production Costs (Sustainability Concerns)
3.3. Market Opportunities
3.3.1. Expanding Global Distribution (Asia-Pacific and Europe Market Penetration)
3.3.2. Innovations in Packaging and Product Diversification
3.3.3. Growing Demand for Clean-label Products
3.4. Market Trends
3.4.1. Organic and Natural Product Preferences (Consumer Shift to Natural Ingredients)
3.4.2. Increasing Popularity of Maple-Infused Products
3.4.3. Growth in Health-Conscious Consumer Segment (Nutritional Focus)
3.5. Government Regulations and Sustainability Efforts
3.5.1. Environmental Standards for Sustainable Production
3.5.2. Certification Processes for Organic Products
3.5.3. Industry Initiatives on Reducing Carbon Footprint
3.6. SWOT Analysis
3.7. Stakeholder Ecosystem
3.8. Porters Five Forces Analysis
3.9. Competition Ecosystem
4. Global Maple Syrup Market Segmentation
4.1. By Source (in Value %)
4.1.1. Sugar Maple
4.1.2. Black Maple
4.1.3. Red Maple
4.2. By Distribution Channel (in Value %)
4.2.1. Offline (Supermarkets, Hypermarkets, Specialty Stores)
4.2.2. Online (E-commerce)
4.3. By Application (in Value %)
4.3.1. Bakery and Confectionery
4.3.2. Beverages
4.3.3. Breakfast and Cereal Products
4.3.4. Sauces and Dressings
4.4. By Packaging Type (in Value %)
4.4.1. Bottles
4.4.2. Jars
4.4.3. Sachets and Pouches
4.5. By Region (in Value %)
4.5.1. North America
4.5.2. Europe
4.5.3. Asia-Pacific
4.5.4. South America
4.5.5. Middle East & Africa
5. Global Maple Syrup Market Competitive Analysis
5.1. Profiles of Major Companies (In Value %)
5.1.1. B & G Foods, Inc.
5.1.2. The J.M. Smucker Co.
5.1.3. Federation of Quebec Maple Syrup Producers
5.1.4. Bascom Maple Farms
5.1.5. Les Industries Bernard et Fils Ltee
5.1.6. Butternut Mountain Farm
5.1.7. Coombs Family Farms
5.1.8. Conagra Brands Inc.
5.1.9. LB Maple Treat Corporation
5.1.10. Ferguson Farm Vermont Maple Syrup
5.1.11. Highland Sugarworks
5.1.12. Maple Grove Farms
5.1.13. Spring Tree Maple Syrup
5.1.14. Crown Maple Syrup
5.1.15. Atkinson Maple Syrup
5.2. Cross Comparison Parameters (Number of Employees, Headquarters, Revenue, Production Capacity, Market Share, Sustainability Initiatives, Product Innovations, Distribution Network)
5.3. Strategic Initiatives (Mergers & Acquisitions, Partnerships, Expansion Plans)
5.4. Investment Analysis
5.5. Market Share Analysis
5.6. Government Grants and Subsidies
6. Global Maple Syrup Market Regulatory Framework
6.1. Environmental and Sustainability Regulations
6.2. Organic Certification Requirements
6.3. Trade Regulations for Maple Syrup Export/Import
7. Global Maple Syrup Future Market Size (In USD)
7.1. Future Market Size Projections
7.2. Key Factors Driving Future Market Growth (Increased Consumer Demand for Natural Sweeteners)
8. Global Maple Syrup Future Market Segmentation
8.1. By Source (In Value %)
8.2. By Distribution Channel (In Value %)
8.3. By Application (In Value %)
8.4. By Region (In Value %)
9. Global Maple Syrup Market Analysts Recommendations
9.1. TAM/SAM/SOM Analysis
9.2. Customer Cohort Analysis
9.3. White Space Opportunity Analysis
Disclaimer Contact UsResearch Methodology
Step 1: Identification of Key Variables
In this stage, we identified critical variables influencing the global maple syrup market, such as consumer preferences, production trends, and regulatory factors. This phase involved extensive desk research using secondary sources like industry databases and government reports.
Step 2: Market Analysis and Construction
This step involved analyzing historical data to construct accurate market size estimates for 2023. We assessed market penetration, production capacities, and sales data from maple syrup producers to ensure reliable figures.
Step 3: Hypothesis Validation and Expert Consultation
We conducted interviews with industry experts, including maple syrup producers and distributors, to validate our market assumptions. These consultations provided insights into market trends and operational challenges.
Step 4: Research Synthesis and Final Output
The final phase included synthesizing the research findings into a comprehensive report. Multiple data validation steps were taken to ensure the final output is accurate, reliable, and actionable for stakeholders.
Frequently Asked Questions
1. How big is the Global Maple Syrup Market?
The global maple syrup market was valued at USD 932.2million, driven by increasing demand for natural sweeteners and consumer health awareness.
2. What are the key challenges in the Global Maple Syrup Market?
Key challenges include the impact of climate change on maple tree sap production and competition from alternative sweeteners like honey and agave syrup.
3. Who are the major players in the Global Maple Syrup Market?
Major players include B & G Foods, The J.M. Smucker Co., Federation of Quebec Maple Syrup Producers, Bascom Maple Farms, and Les Industries Bernard et Fils Ltee.
4. What drives the growth of the Global Maple Syrup Market?
The market is propelled by the rising consumer preference for organic and natural products, expanding applications in the food and beverage industry, and increased e-commerce adoption.
Why Buy From Us?
 Framework")
What makes us stand out is that our consultants follows Robust, Refine and Result (RRR) methodology. i.e. Robust for clear definitions, approaches and sanity checking, Refine for differentiating respondents facts and opinions and Result for presenting data with story

We have set a benchmark in the industry by offering our clients with syndicated and customized market research reports featuring coverage of entire market as well as meticulous research and analyst insights.

While we don't replace traditional research, we flip the method upside down. Our dual approach of Top Bottom & Bottom Top ensures quality deliverable by not just verifying company fundamentals but also looking at the sector and macroeconomic factors.

With one step in the future, our research team constantly tries to show you the bigger picture. We help with some of the tough questions you may encounter along the way: How is the industry positioned? Best marketing channel? KPI's of competitors? By aligning every element, we help maximize success.

Our report gives you instant access to the answers and sources that other companies might choose to hide. We elaborate each steps of research methodology we have used and showcase you the sample size to earn your trust.

If you need any support, we are here! We pride ourselves on universe strength, data quality, and quick, friendly, and professional service.