
Global Observability Tools Market Outlook to 2030
Region:Global
Author(s):Naman Rohilla
Product Code:KROD1303
November 2024
86
About the Report
Global Observability Tools Market Overview
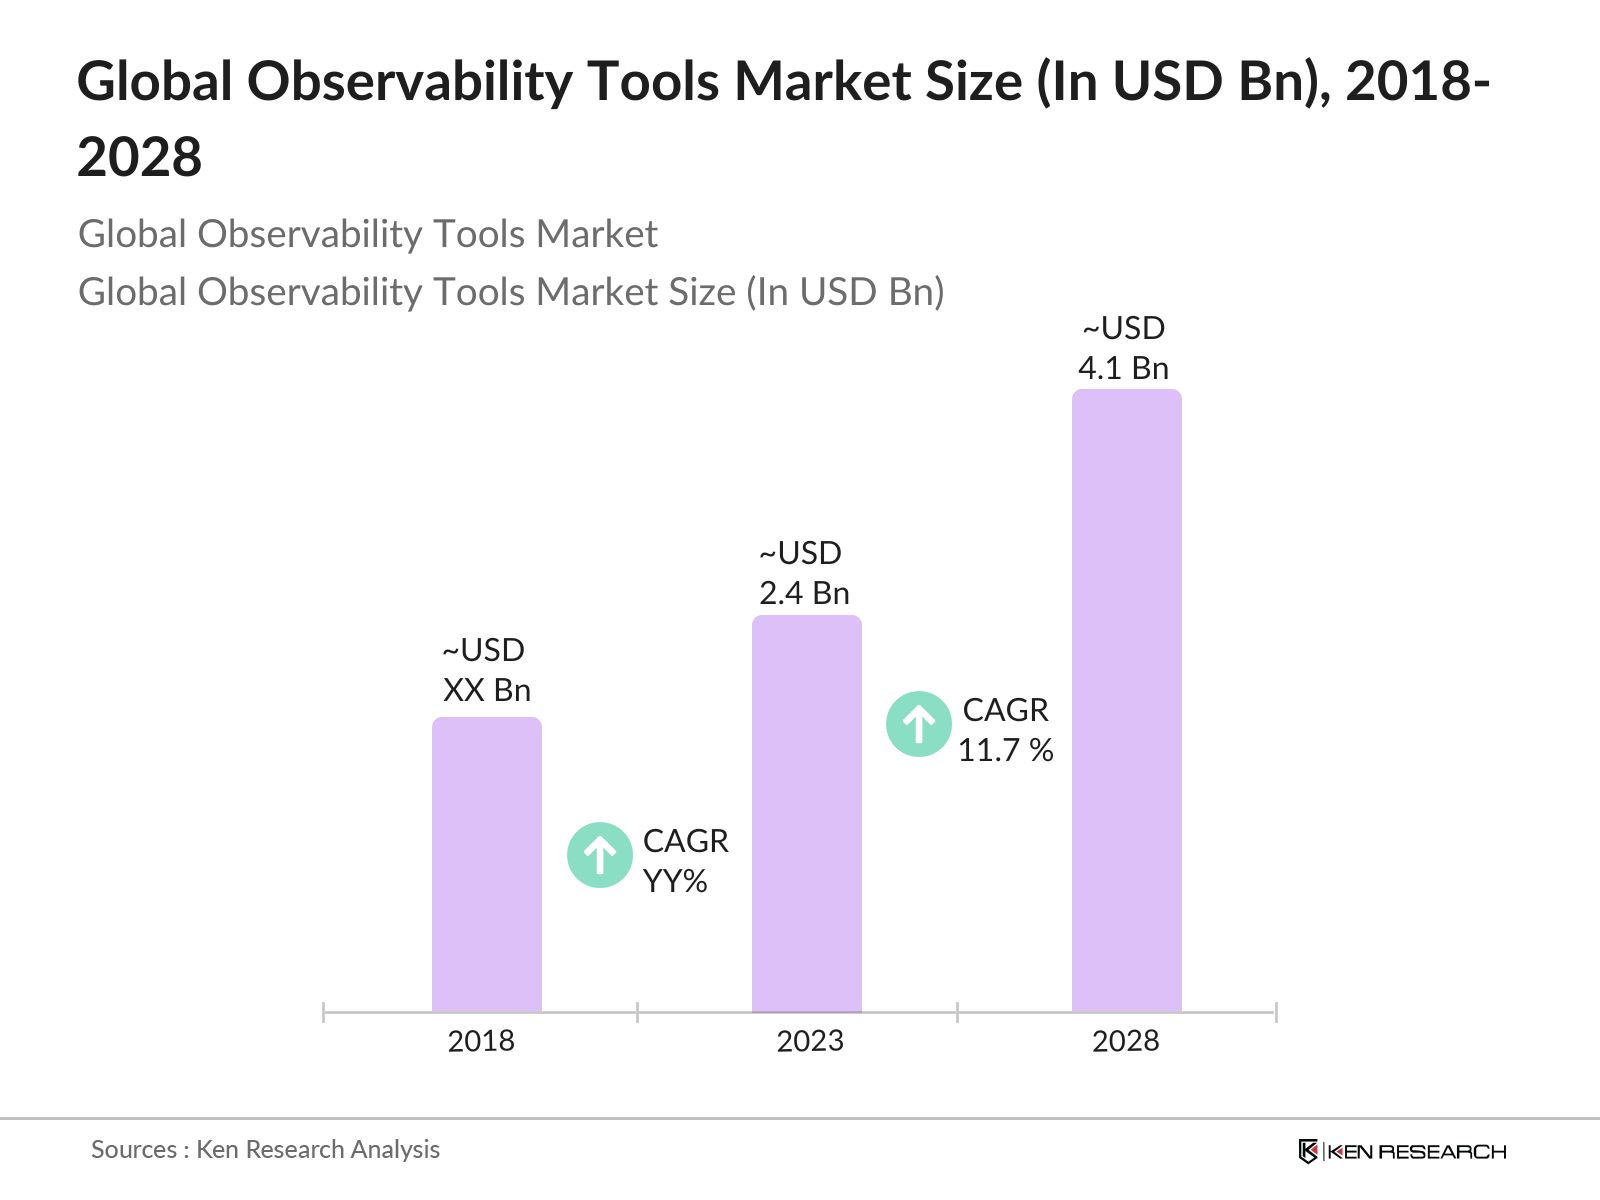
- The Global Observability Tools Market was valued at USD 2.4 billion in 2023. The market is driven by the increasing need for comprehensive monitoring and management of complex IT infrastructures across various industries such as banking, healthcare, retail, and telecommunications. The growing adoption of cloud-native technologies, microservices, and DevOps practices has further fueled the demand for advanced observability tools, which provide deep visibility into system performance, enabling proactive troubleshooting and optimization.
- The major players in the global Observability Tools market include Datadog, Inc., New Relic, Inc., Dynatrace LLC, Splunk Inc., and Elastic NV. These companies are at the forefront of developing cutting-edge observability solutions, focusing on enhancing their capabilities to address the evolving needs of modern IT environments.
- In 2023, Datadog, Inc. launched a new AI-driven observability platform that integrates with cloud services and on-premises systems, offering end-to-end visibility and advanced analytics. This innovation reflects the industry's shift towards AI-powered solutions to enhance system performance and reduce operational risks.
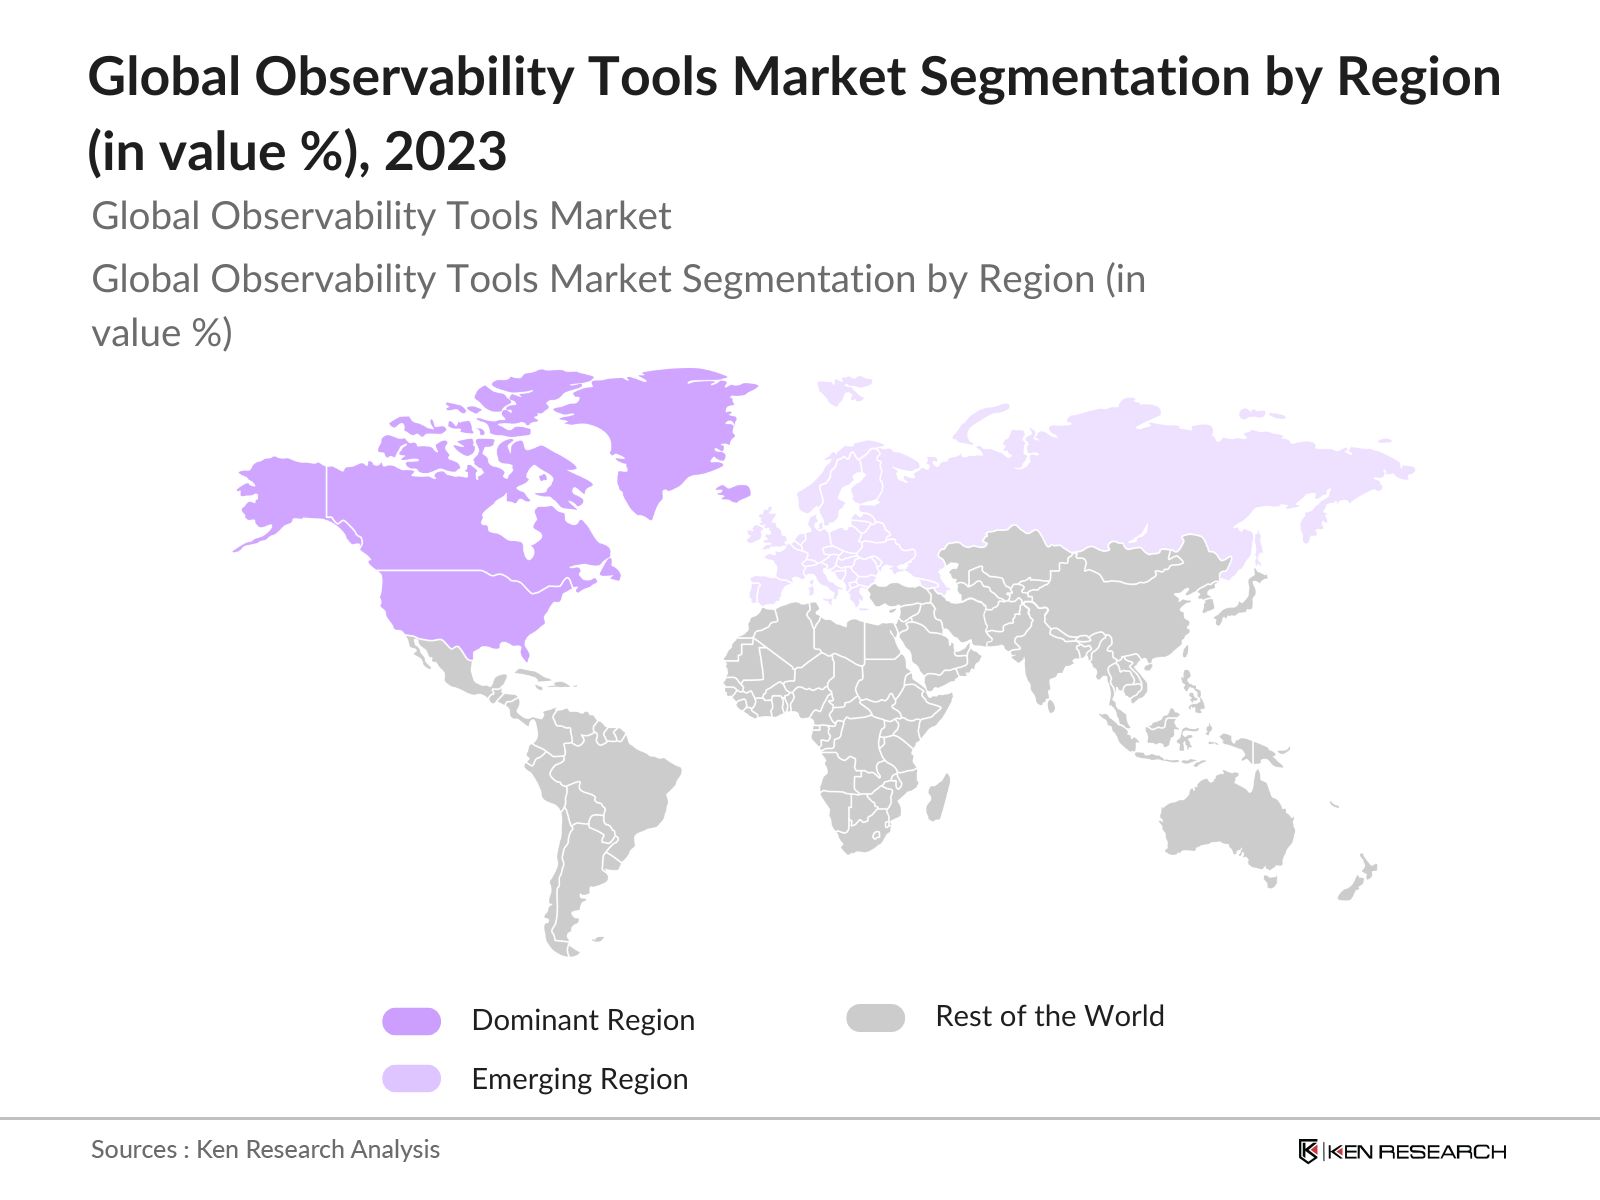
- In 2023, North America dominated the global observability tools market due to the strong presence of technology giants, substantial investments in IT infrastructure, and the rapid adoption of cloud and microservices architectures.
Global Observability Tools Market Segmentation
The global observability tools market is segmented by component, deployment mode and region.
- By Component: The market is segmented into solutions and services. In 2023, the solutions segment held the highest market share, driven by the widespread adoption of observability platforms that provide comprehensive insights into application performance and infrastructure health.
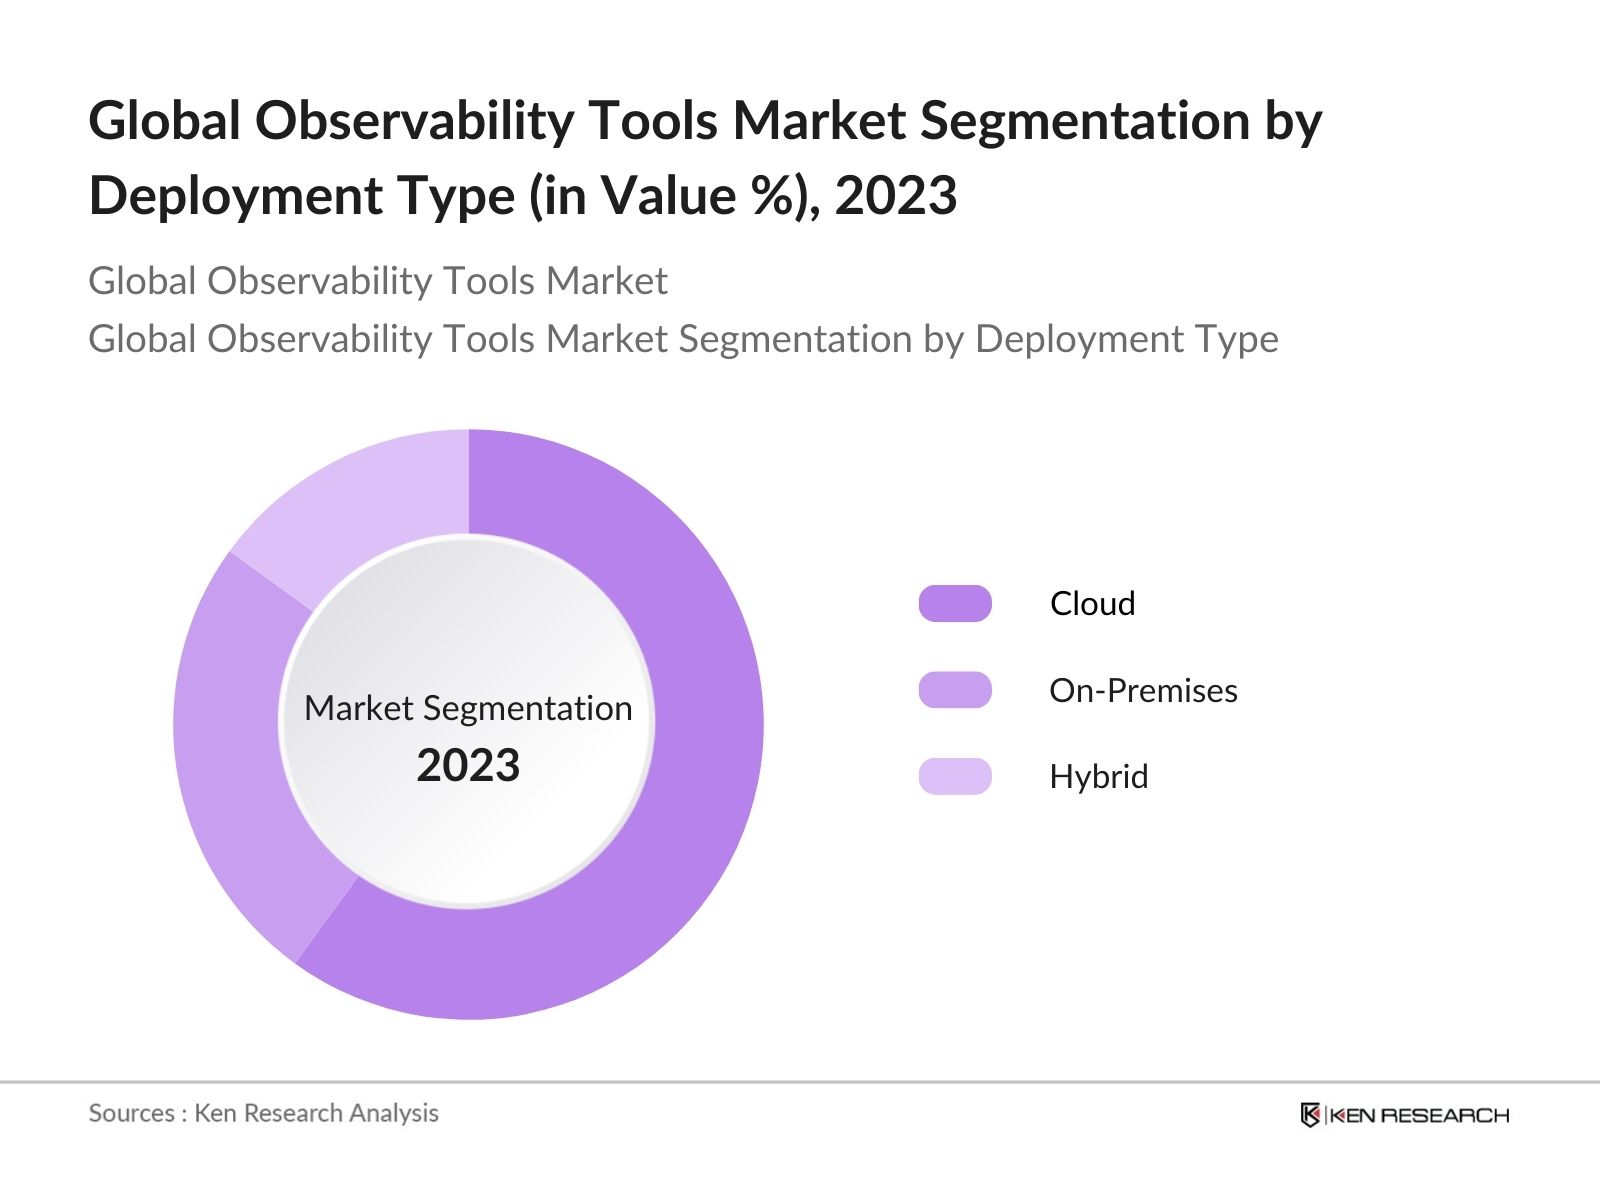
- By Deployment Mode: The market is segmented into cloud-based, on-premises, and hybrid. In 2023, the cloud-based segment held the largest market share due to its flexibility, scalability, and ease of integration with existing IT systems.
- By Region: The global observability tools market is segmented into North America, Europe, Asia-Pacific (APAC), Middle East & Africa (MEA), and Latin America. In 2023, North America held the largest market share, supported by technological advancements in IT operations and the strong presence of major market players.
Global Observability Tools Market Competitive Landscape
|
Company |
Establishment Year |
Headquarters |
|
Datadog, Inc. |
2010 |
New York, USA |
|
New Relic, Inc. |
2008 |
San Francisco, USA |
|
Dynatrace LLC |
2005 |
Waltham, Massachusetts, USA |
|
Splunk Inc. |
2003 |
San Francisco, USA |
|
Elastic NV |
2012 |
Mountain View, California, USA |
- Dynatrace LLC: In 2024, Dynatrace launched several innovations, including AI Observability for large language models and a unified observability platform on AWS in Japan. The company was recognized as a leader in the GigaOm Radar Report for Cloud Observability Solutions and expanded partnerships with Google Cloud, enhancing its market position in the global observability tools market.
- New Relic, Inc.: On July 31, 2023, New Relic announced that it would be acquired by Francisco Partners and TPG for $6.5 billion, with shareholders set to receive $87.00 per share in cash. This acquisition was approved by shareholders on November 1, 2023, and completed on November 8, 2023. Following the acquisition, New Relic has transitioned to a private company, which is expected to provide it with greater flexibility to enhance its observability platform and meet customer needs more effectively.
Global Observability Tools Market Analysis
Global Observability Tools Market Growth Drivers:
- Increasing Complexity of IT Environments: In 2022, 70% of executives report that IT complexity has become a challenge for their organizations in recent years. This complexity arises from the shift towards cloud-native applications, microservices, and hybrid cloud environments. Observability tools are essential in providing comprehensive insights that enable organizations to monitor, troubleshoot, and optimize their systems effectively, ensuring operational efficiency despite the intricate nature of modern IT infrastructures.
- Adoption of DevOps Practices: In 2022, more than half (54%) of tech professionals utilized monitoring strategies to manage IT complexity, underscoring the demand for observability tools that support DevOps practices. These tools facilitate continuous monitoring, automation, and collaboration between development and operations teams. By integrating observability into DevOps workflows, organizations can enhance their software development lifecycle, improve deployment frequency, and reduce lead times for changes, ultimately driving better performance and reliability.
- Growing Demand for AI-Powered Analytics: According to a Dynatrace survey in 2024, organizations that adopt AI-driven analytics are five times more likely to achieve improved cybersecurity outcomes. This illustrates the growing demand for AI capabilities in observability tools. The integration of artificial intelligence and machine learning enhances the ability to predict and prevent system failures, optimize resource usage, and improve overall system reliability. As businesses increasingly rely on data-driven insights, AI-powered observability tools become essential for maintaining operational excellence.
Global Observability Tools Market Challenges:
- High Implementation Costs: The initial investment in advanced observability tools can indeed be substantial, particularly for small and medium-sized enterprises (SMEs). Organizations often face costs related to licensing, integration, and training. As noted, observability tools can be one of the highest costs after infrastructure, with companies sometimes targeting up to 10% of their operational budgets for full-stack observability.
- Data Security and Privacy Concerns: The collection and analysis of large volumes of data across distributed systems raise legitimate concerns about data security and privacy. Organizations must ensure compliance with stringent data protection regulations, as the complexity of managing sensitive data increases with the deployment of observability solutions. Compliance can be costly, requiring dedicated resources and expertise to manage effectively.
Global Observability Tools Market Government Initiatives:
- EUs Digital Europe Program: The European Union's Digital Europe program aims to enhance digital capabilities across member states, with 70% of businesses indicating that they expect to benefit from increased funding for digital transformation initiatives, including observability tools. This initiative aims to enhance the digital capabilities of European businesses and public administrations, promoting innovation in IT operations and cybersecurity.
- US Federal IT Modernization Plan: The US government's IT modernization plan has led to a 70% increase in federal agencies adopting cloud services, emphasizing the need for advanced monitoring and observability tools to ensure the security and reliability of these systems. The plan supports the integration of observability tools to ensure the reliability and resilience of critical infrastructure.
Global Observability Tools Market Future Market Outlook
The Global Observability Tools Market is expected to grow over the coming years, driven by the increasing complexity of IT environments, the adoption of DevOps practices, and advancements in AI-powered analytics.
Global Observability Tools Market Future Market Trends:
- Increased Adoption in Cloud-Native Environments: By 2028, the adoption of observability tools in cloud-native environments is expected to accelerate, driven by the need for real-time monitoring and optimization of complex, distributed systems. 88% of organizations mentioned the increasing complexity of their technology stack, making it challenging to achieve end-to-end observability. Observability platforms that offer seamless integration with cloud services and support for microservices architectures will be in high demand.
- Focus on End-to-End Visibility: By 2028, organizations increasingly seek observability solutions that provide end-to-end visibility across their entire IT stack, from infrastructure applications. This trend is driving the development of unified observability platforms capable of monitoring, analyzing, and optimizing every aspect of the IT environment. 70% of organizations leveraging observability tools successfully reduce latency and gain a competitive advantage, emphasizing the importance of comprehensive monitoring for operational efficiency.
Scope of the Report
|
By Component |
Solutions Services |
|
By Deployment Mode |
Cloud-Based On-Premises Hybrid |
|
By Industry Vertical |
IT & Telecom BFSI Healthcare Retail Others |
|
By Technology |
AI and Machine Learning Log Management Cloud Monitoring |
|
By Region |
North America Europe Asia-Pacific (APAC) Middle East & Africa (MEA) Latin America |
Products
Key Target Audience Organizations and Entities Who Can Benefit by Subscribing This Report:
Government and Regulatory Bodies
Banks and Financial Institutes
Investors and Venture Capitalists
IT Companies
Software Companies
Survey Companies
Time Period Captured in the Report
Historical Period: 2018-2023
Base Year: 2023
Forecast Period: 2023-2028
Companies
Dynatrace
Splunk
Datadog
New Relic
Cisco
Elastic
SolarWinds
IBM
Microsoft
Google Cloud
AppDynamics
LogicMonitor
Grafana Labs
PagerDuty
SignalFx
Table of Contents
1. Global Observability Tools Market Overview
1.1. Definition and Scope
1.2. Market Taxonomy
1.3. Market Growth Rate
1.4. Market Segmentation Overview
2. Global Observability Tools Market Size (in USD Bn), 2018-2023
2.1. Historical Market Size
2.2. Year-on-Year Growth Analysis
2.3. Key Market Developments and Milestones
3. Global Observability Tools Market Analysis
3.1. Growth Drivers
3.1.1. Increasing IT Complexity
3.1.2. Adoption of Cloud-Native Architectures
3.1.3. Demand for Enhanced Customer Experience
3.1.4. AI and Machine Learning Advancements
3.2. Restraints
3.2.1. High Implementation Costs
3.2.2. Data Privacy and Security Concerns
3.2.3. Integration Challenges
3.3. Opportunities
3.3.1. Expansion in SMEs
3.3.2. Growth in Emerging Markets
3.3.3. Increased Demand for Automation
3.4. Trends
3.4.1. Adoption of AI-Driven Monitoring
3.4.2. Integration with DevOps and CI/CD
3.4.3. Rise of Open-Source Tools
3.5. Government Regulation
3.5.1. Data Protection Regulations
3.5.2. Cloud Smart Policies
3.5.3. Cybersecurity Requirements
3.5.4. Compliance with Industry Standards
3.6. SWOT Analysis
3.7. Stake Ecosystem
3.8. Competition Ecosystem
4. Global Observability Tools Market Segmentation, 2023
4.1. By Deployment Type (in Value %)
4.1.1. Cloud
4.1.2. On-Premises
4.1.3. Hybrid
4.2. By Component (in Value %)
4.2.1. Solutions
4.2.2. Services
4.3. By Industry Vertical (in Value %)
4.3.1. IT & Telecom
4.3.2. BFSI
4.3.3. Healthcare
4.3.4. Retail
4.3.5. Others
4.4. By Technology (in Value %)
4.4.1. AI and Machine Learning
4.4.2. Log Management
4.4.3. Cloud Monitoring
4.5. By Region (in Value %)
4.5.1. North America
4.5.2. Europe
4.5.3. Asia-Pacific (APAC)
4.5.4. Middle East & Africa (MEA)
4.5.5. Latin America
5. Global Observability Tools Market Cross Comparison
5.1. Detailed Profiles of Major Companies
5.1.1. Dynatrace
5.1.2. Splunk
5.1.3. Datadog
5.1.4. New Relic
5.1.5. Cisco
5.1.6. Elastic
5.1.7. SolarWinds
5.1.8. IBM
5.1.9. Microsoft
5.1.10. Google Cloud
5.1.11. AppDynamics
5.1.12. LogicMonitor
5.1.13. Grafana Labs
5.1.14. PagerDuty
5.1.15. SignalFx
5.2. Cross Comparison Parameters (No. of Employees, Headquarters, Inception Year, Revenue)
6. Global Observability Tools Market Competitive Landscape
6.1. Market Share Analysis
6.2. Strategic Initiatives
6.3. Mergers and Acquisitions
6.4. Investment Analysis
6.4.1. Venture Capital Funding
6.4.2. Government Grants
6.4.3. Private Equity Investments
7. Global Observability Tools Market Regulatory Framework
7.1. Data Privacy and Protection Regulations
7.2. Compliance Requirements
7.3. Certification Processes
8. Global Observability Tools Market Future Market Size (in USD Bn), 2023-2028
8.1. Future Market Size Projections
8.2. Key Factors Driving Future Market Growth
9. Global Observability Tools Market Future Market Segmentation, 2028
9.1. By Deployment Type (in Value %)
9.2. By Component (in Value %)
9.3. By Industry Vertical (in Value %)
9.4. By Technology (in Value %)
9.5. By Region (in Value %)
10. Global Observability Tools Market Analysts Recommendations
10.1. TAM/SAM/SOM Analysis
10.2. Customer Cohort Analysis
10.3. Marketing Initiatives
10.4. White Space Opportunity Analysis
11. Disclaimer
12. Contact Us
Research Methodology
Step: 1 Identifying Key Variables
Ecosystem creation for all the major entities and referring to multiple secondary and proprietary databases to perform desk research around the market to collate market-level information.
Step: 2 Market Building
Collating statistics on the Global Observability Tools market over the years and analyzing the penetration of products as well as the ratio of suppliers to compute the revenue generated for the market. We will also review product quality statistics to ensure accuracy behind the data points shared.
Step: 3 Validating and Finalizing
Building market hypotheses and conducting CATIs with market experts from different companies to validate statistics and seek operational and financial information from company representatives.
Step: 4 Research Output
Our team will approach multiple Observability Tools companies to understand the nature of product segments and sales, consumer preference, and other parameters, which will support us in validating statistics derived through the bottom-to-top approach from these Observability Tools companies.
Frequently Asked Questions
01. How big is the Global Observability Tools Market?
The Global Observability Tools Market was valued at USD 2.4 billion in 2023. The market is growing rapidly due to the increasing complexity of IT environments, driving demand for advanced monitoring and analytics solutions across industries.
02. Who are the major players in the Global Observability Tools market?
The major players in the Global Observability Tools market include Dynatrace, Splunk, Datadog, New Relic, Cisco, Elastic, SolarWinds, IBM, Microsoft, Google Cloud, AppDynamics, LogicMonitor, Grafana Labs, PagerDuty, and SignalFx, leading the market with innovative solutions.
03. What are the growth drivers of the Global Observability Tools market?
The growth drivers of the Global Observability Tools market is driven by the widespread adoption of cloud-native architectures, the growing emphasis on enhancing customer experience, and advancements in AI and machine learning, which are enabling more sophisticated and automated observability solutions.
04. What are the challenges in the Global Observability Tools market?
The Global Observability Tools market include the high costs associated with implementing and maintaining advanced observability tools, growing data privacy and security concerns, and the complexity of integrating these tools into diverse and evolving IT environments.
Why Buy From Us?
 Framework")
What makes us stand out is that our consultants follows Robust, Refine and Result (RRR) methodology. i.e. Robust for clear definitions, approaches and sanity checking, Refine for differentiating respondents facts and opinions and Result for presenting data with story

We have set a benchmark in the industry by offering our clients with syndicated and customized market research reports featuring coverage of entire market as well as meticulous research and analyst insights.

While we don't replace traditional research, we flip the method upside down. Our dual approach of Top Bottom & Bottom Top ensures quality deliverable by not just verifying company fundamentals but also looking at the sector and macroeconomic factors.

With one step in the future, our research team constantly tries to show you the bigger picture. We help with some of the tough questions you may encounter along the way: How is the industry positioned? Best marketing channel? KPI's of competitors? By aligning every element, we help maximize success.

Our report gives you instant access to the answers and sources that other companies might choose to hide. We elaborate each steps of research methodology we have used and showcase you the sample size to earn your trust.

If you need any support, we are here! We pride ourselves on universe strength, data quality, and quick, friendly, and professional service.