


Global Quantum Dot Technology Market Outlook to 2030
Region:Global
Author(s):Sanjna Verma
Product Code:KROD1337
December 2024
87
About the Report
Global Quantum Dot Technology Market Overview
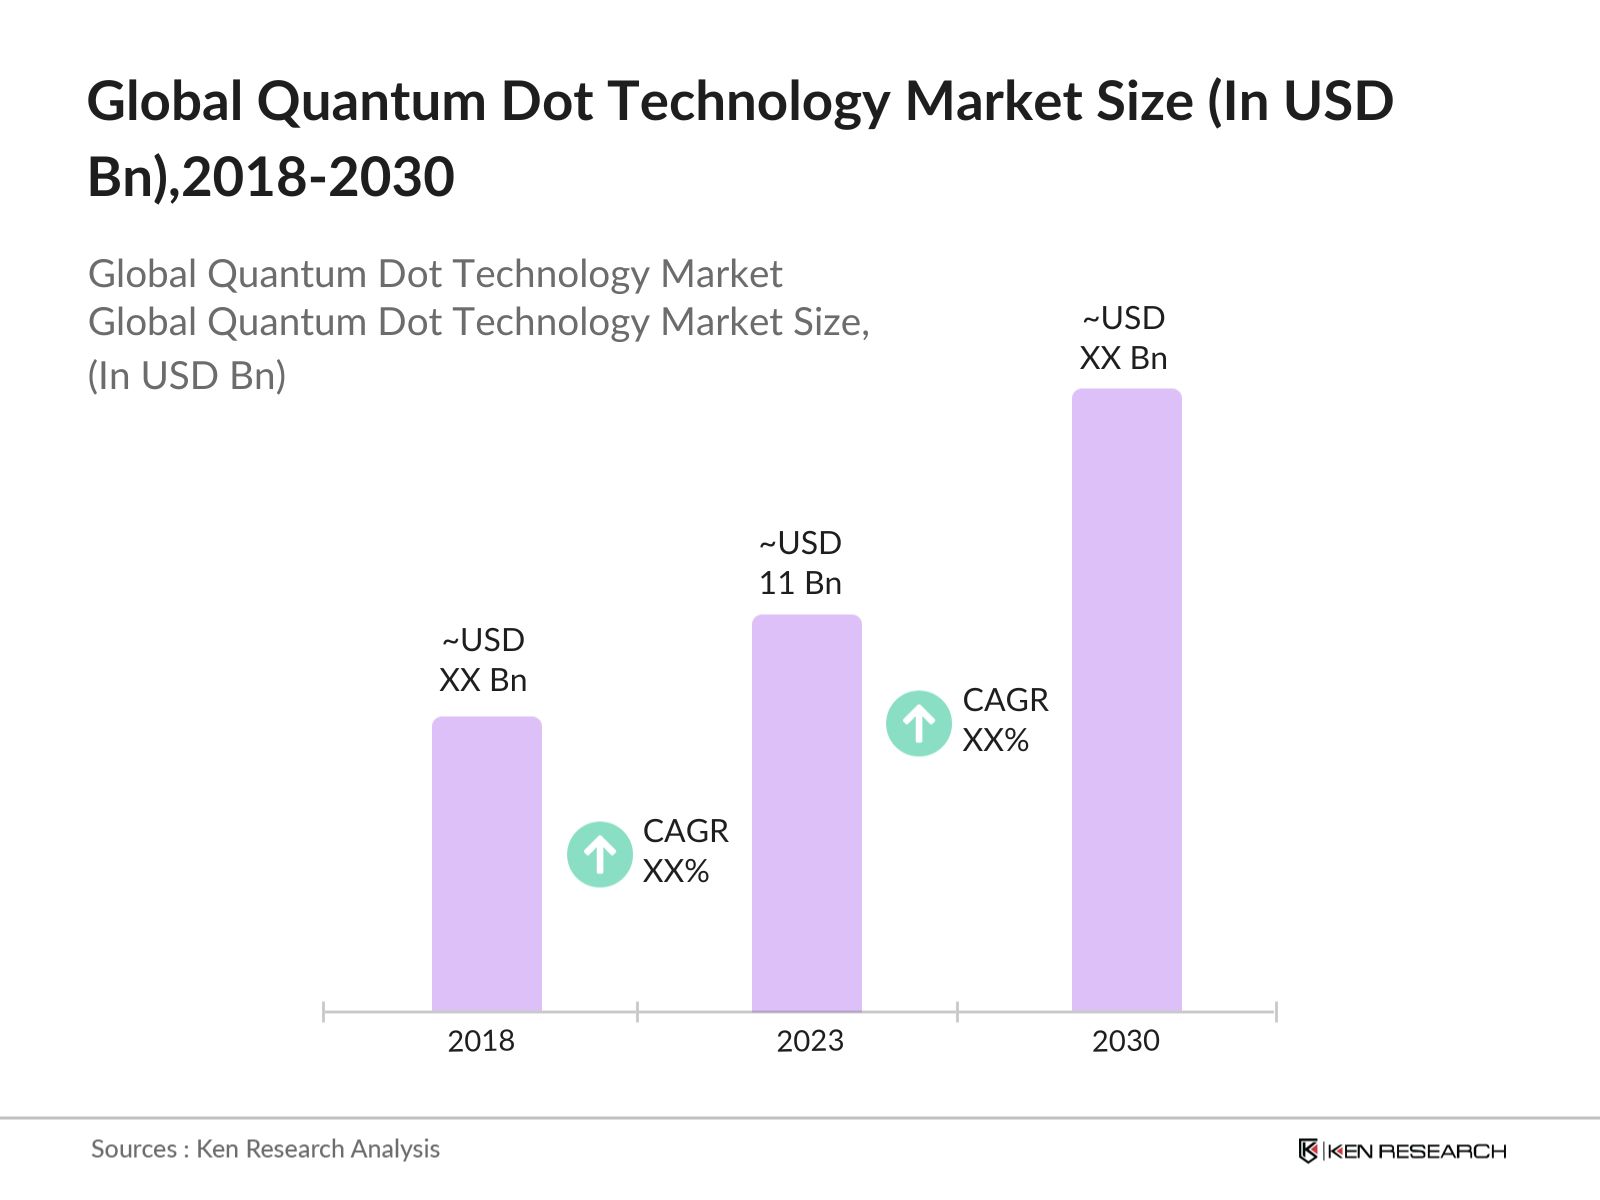
- Global Quantum Dot Technology Market was valued at USD 11 billion in 2023. This growth is driven primarily by the increasing adoption of quantum dots in display technologies, such as QLED TVs and monitors, due to their ability to provide brighter, more vibrant colors and improved energy efficiency.
- Quantum Dot Technology Market is dominated by key players such as Samsung Electronics Co., Ltd., Nanosys Inc., and QD Vision Inc. These companies have established strong market positions through extensive R&D efforts and strategic partnerships.
- In 2023, Sony has made its first significant move into quantum computing by investing USD 52.5 million in the UK-based firm Quantum Motion. This investment aims to enhance Sony's capabilities in silicon quantum chip development and facilitate the introduction of quantum computing technologies in Japan.
- Major cities like San Francisco, Seoul, and Shenzhen dominate the quantum dot technology market. These cities are home to leading technology firms and innovation hubs, fostering a conducive environment for research and development. In particular, San Franciscos Silicon Valley hosts numerous startups and tech giants focusing on quantum dot innovations, while Seoul benefits from substantial investment from South Korean conglomerates like Samsung.
Global Quantum Dot Technology Market Segmentation
The Global Quantum Dot Technology Market can be segmented based on several factors:
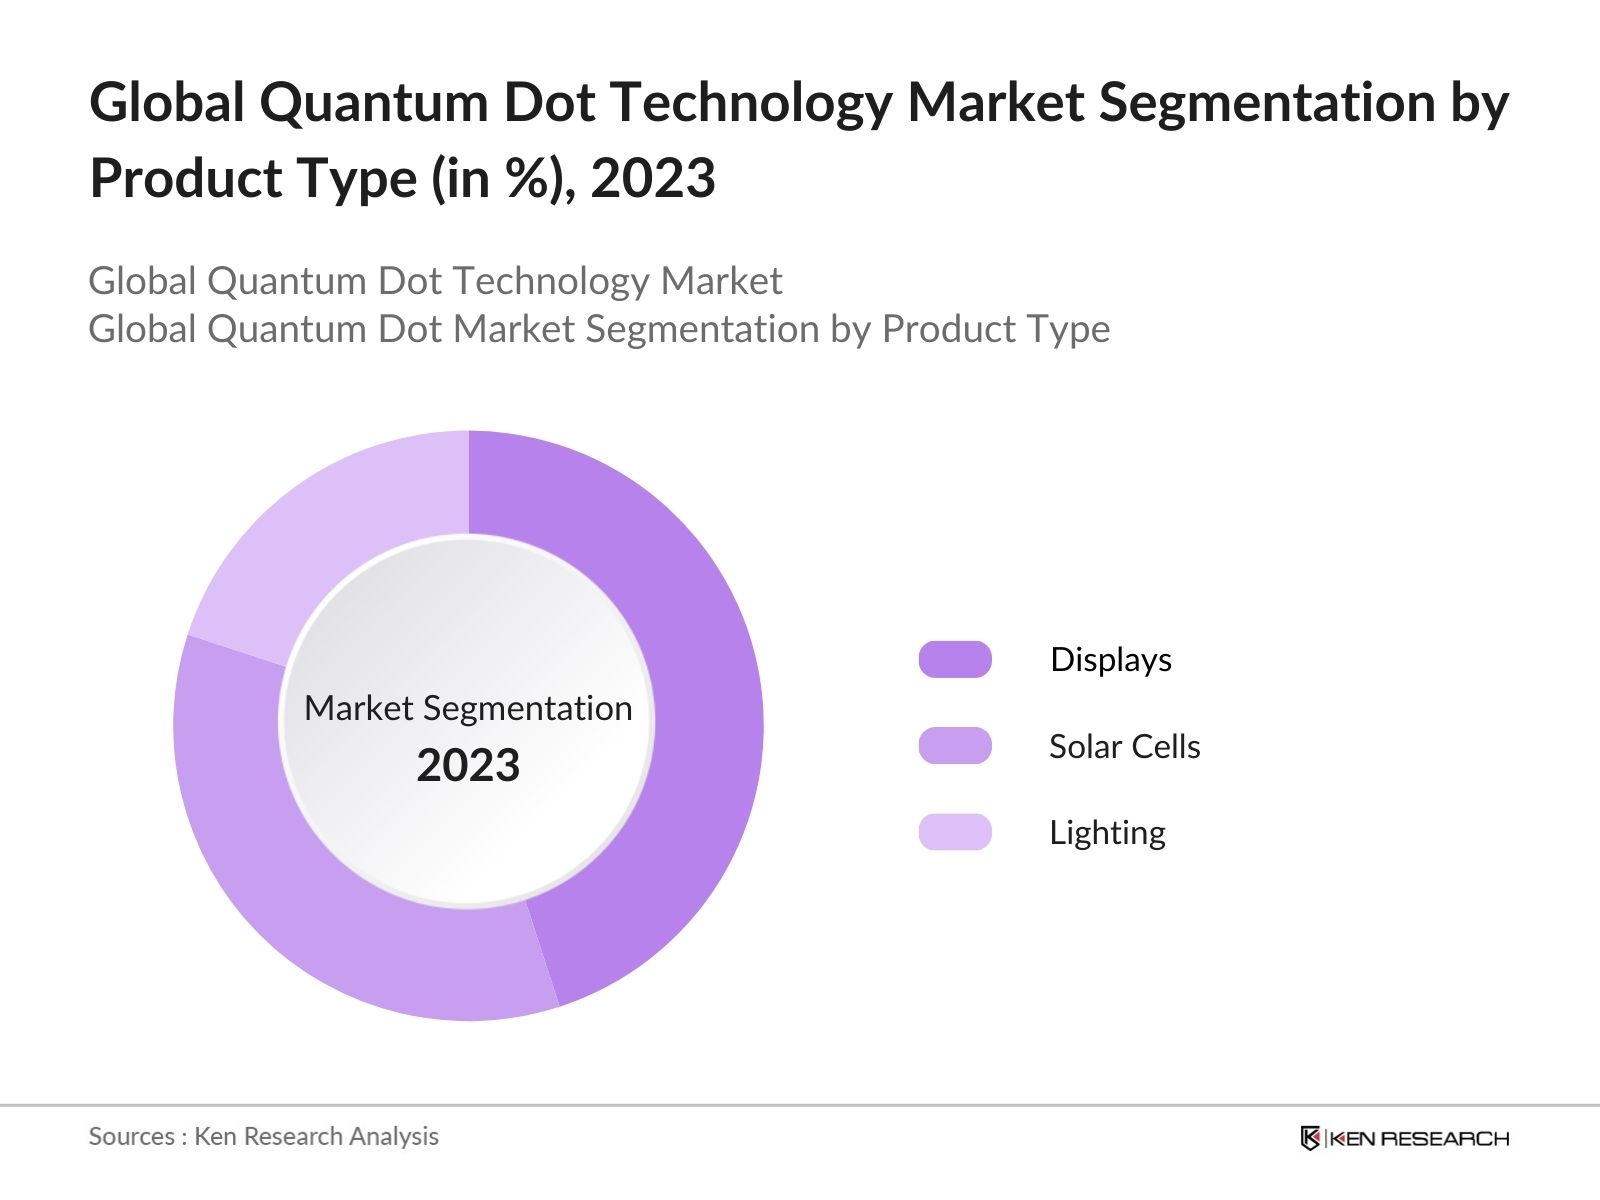
By Product Type: Global Quantum Dot Technology Market is segmented by product type into Displays, Solar Cells, and LED Lighting. In 2023, the Displays segment dominated this subsegment due to its widespread adoption in consumer electronics like televisions, monitors, and smartphones. The vibrant color quality and enhanced brightness of quantum dot displays make them a preferred choice for premium devices, further driven by major players such as Samsung and Sony investing heavily in this technology.
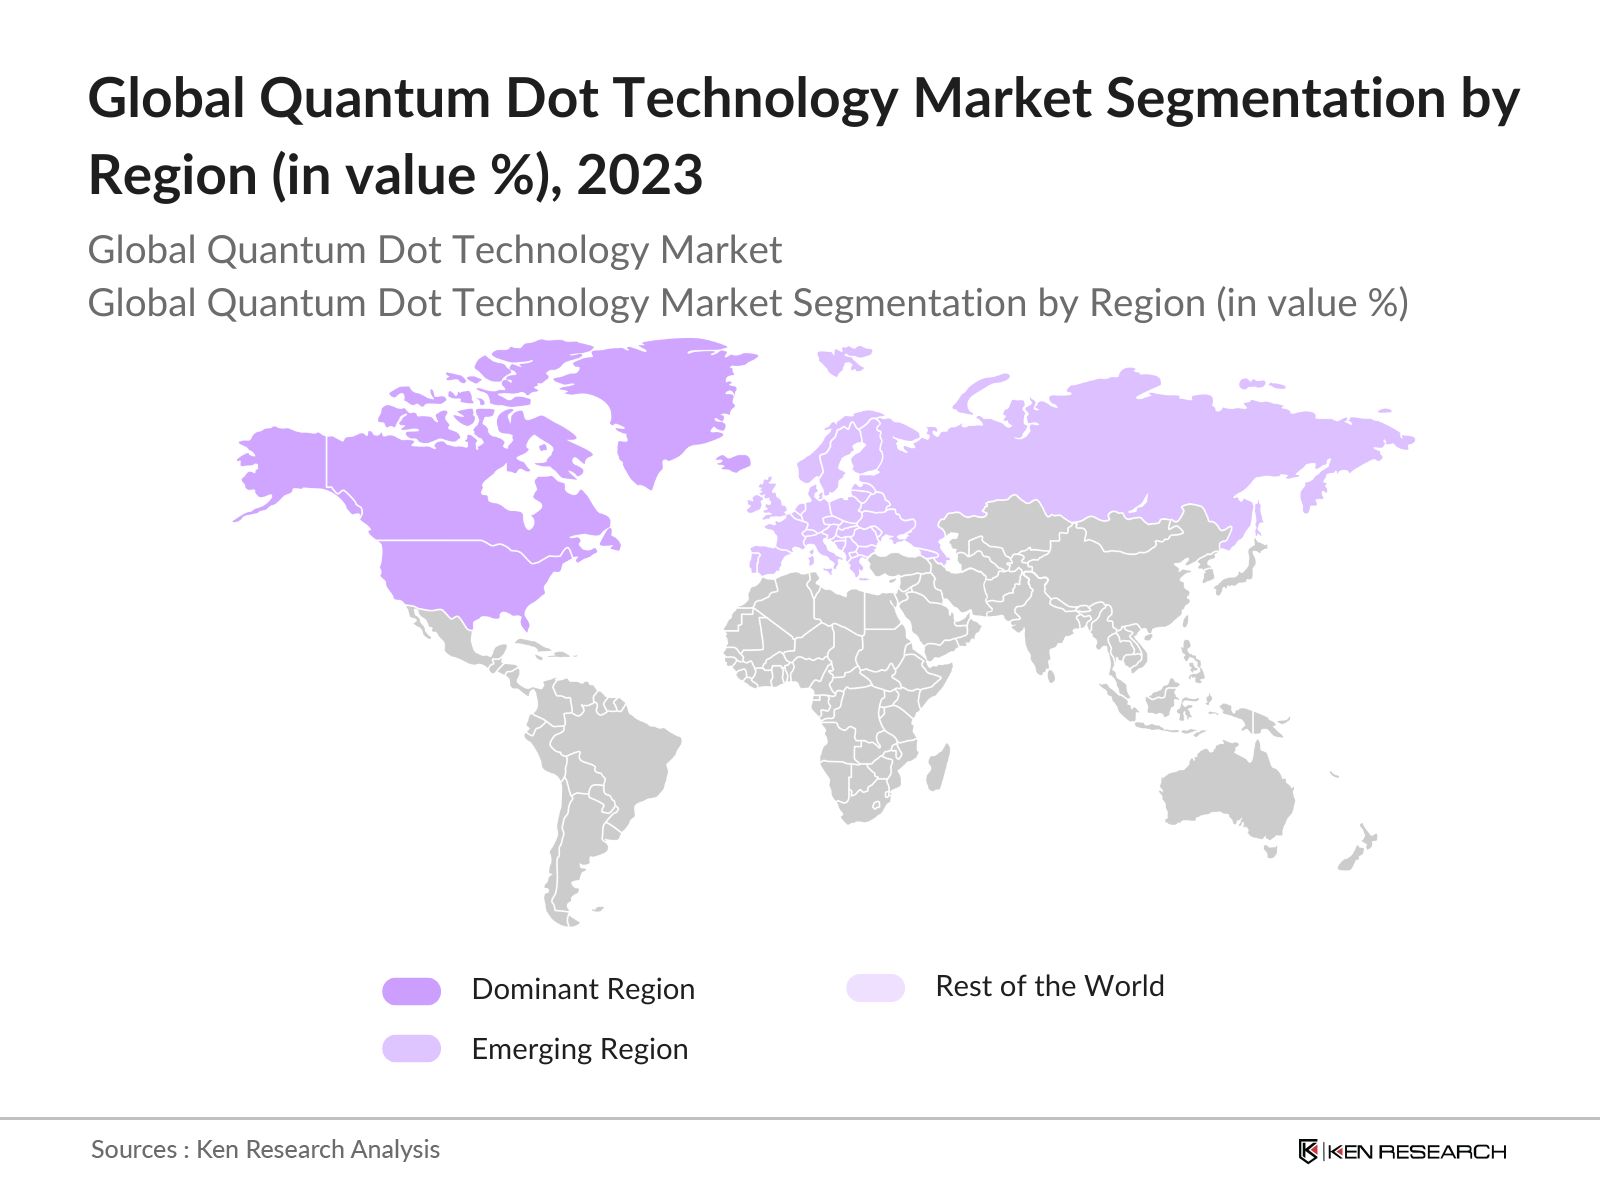
By Region: Global Quantum Dot Technology Market is segmented by region into North America, Europe, Asia-Pacific, Latin America, and Middle East & Africa. In 2023, Asia-Pacific led the market due to the high concentration of display manufacturers and increasing investments in quantum dot research and development. Countries like China, South Korea, and Japan are at the forefront, driven by major electronics companies and supportive government initiatives aimed at technological innovation.
By Material: Global Quantum Dot Technology Market is segmented by material type into Cadmium-based Quantum Dots, Cadmium-free Quantum Dots, and Silicon Quantum Dots. Cadmium-free Quantum Dots dominated the market in 2023 due to growing environmental concerns and stringent regulations in regions like Europe and North America. These quantum dots provide similar performance to their cadmium-based counterparts while being environmentally friendly, making them ideal for use in various applications, including displays and biomedical devices.
Global Quantum Dot Technology Market Competitive Landscape
|
Company Name |
Establishment Year |
Headquarters |
|
Samsung Electronics |
1969 |
Suwon, South Korea |
|
Nanosys Inc. |
2001 |
Milpitas, USA |
|
QD Vision Inc. |
2004 |
Lexington, USA |
|
LG Display |
1985 |
Seoul, South Korea |
|
Nanoco Group plc |
2001 |
Manchester, UK |
- LG Display Co.Ltd: In 2023, LG Display announced a significant investment of $2.1 million in InnoQD, a developer of quantum dot films. This move is part of LG Display's strategy to enhance its capabilities in quantum dot technology, which is increasingly being integrated into both LCD and OLED displays. This investment underscores LG Display's commitment to advancing display technology and maintaining a competitive edge in the rapidly evolving display market.
- Nanosys Inc. (2023): In 2023, Shoei Chemical, a leading advanced materials manufacturer, completed an acquisition of substantially all assets related to Nanosys' quantum dot business. This strategic move integrates Nanosys' sales, marketing, and R&D teams into Shoei, enhancing their capabilities in the quantum dot technology market. Shoei aims to leverage Nanosys' expertise to drive innovations in display technologies such as MiniLEDs and QD-OLEDs, while maintaining the Nanosys brand identity.
Global Quantum Dot Technology Industry Analysis
Growth Drivers:
- Increasing Demand for Quantum Dot Displays: Quantum dots can increase the color gamut of LCD displays by up to 50%, allowing for a wider range of colors to be displayed accurately. The overall ASP for smart TVs in India was $370 as of late 2022, reflecting an 8% decline year-over-year but is expected to rise due to increasing panel costs and a shift towards premium models, which are likely to drive the market's ASP higher in 2024.
- Advancements in Quantum Dot Solar Cells: There has been significant progress in the development of quantum dot solar cells, which are gaining traction due to their potential to offer higher efficiency and lower production costs than traditional photovoltaic cells. The current laboratory efficiency of quantum dot solar cells has reached 18.1%, marking a substantial increase from earlier efficiencies. For context, the first reported efficiency for quantum dot sensitized solar cells was only 0.12%.
- Expansion in Biomedical Imaging Applications: The biomedical sector is increasingly adopting quantum dot technology for imaging applications due to its ability to provide high-resolution images and greater specificity in targeting cells. QDs exhibit brightness that is 10 to 100 times greater than conventional organic fluorophores. This high brightness allows for clearer imaging of biological samples, making them suitable for real-time imaging applications.
Market Challenges:
- Environmental and Regulatory Concerns: Despite their advantages, quantum dots, especially cadmium-based variants, face significant regulatory challenges due to their potential environmental toxicity. This regulation led to a loss for companies producing cadmium-based quantum dots in Europe, as they scrambled to comply with new guidelines. These regulatory pressures are pushing companies to invest heavily in research for alternative, non-toxic materials, which increases production costs and impacts profitability.
- Limited Awareness and Adoption in Emerging Markets: While quantum dot technology is gaining popularity in developed markets, its adoption in emerging markets remains limited due to a lack of awareness and high costs. Additionally, macroeconomic challenges, such as lower disposable incomes and limited access to advanced technologies, hinder the growth of quantum dot technology in these markets.
Government Initiatives:
- National Quantum Initiative: This initiative continues to promote research and development in quantum information science. In October 2023, the Economic Development Administration designated 31 Tech Hubs, including two focused on quantum information science, to foster innovation and collaboration across the country. In December 2023, a supplement to the President's FY 2024 budget was released, highlighting the need for ongoing funding to support quantum technologies, which are vital for economic and national security priorities.
- National Quantum Mission (NQM): Approved in April 2023, the NQM has a budget of 6003.65 crore over eight years. It aims to foster scientific and industrial R&D in quantum technology, establishing thematic hubs for quantum computing, communication, sensing, and materials. The NQM positions India as the seventh country globally to have a dedicated quantum mission, following nations like the U.S., Canada, and China.
Global Quantum Dot Technology Future Market Outlook
Global Quantum Dot Technology market is poised for robust growth over the next five years, driven by advancements in display technologies, increasing adoption in renewable energy solutions, and expanding applications in biomedical imaging.
Future Market Trends
- Expansion of Quantum Dot Applications in Renewable Energy: Over the next five years, the quantum dot technology market is expected to see substantial growth in renewable energy applications, particularly in solar cells. Advancements in quantum dot materials will lead to higher efficiency solar panels that can convert more sunlight into electricity, making solar energy a more viable option for widespread adoption.
- Growth in Quantum Dot-Based Medical Diagnostics: The adoption of quantum dot technology in medical diagnostics is anticipated to increase significantly, driven by advancements in nanotechnology and the need for more precise and early disease detection methods. Quantum dots' ability to provide high-resolution imaging and their use in targeted drug delivery systems will revolutionize the healthcare sector, offering new solutions for diagnosing and treating various diseases, including cancer and neurological disorders.
Scope of the Report
|
By Region |
North America Europe Asia Pacific Latin America Middle East Africa |
|
By Product Type |
Displays Solar Cells LED Lighting |
|
By Material Type |
Cadmium-based Quantum Dots Cadmium-free Quantum Dots Silicon Quantum Dots |
|
By Application |
Healthcare Consumer Electronics Optoelectronics Others |
Products
Key Target Audience Organizations and Entities who can benefit by Subscribing This Report:
Solar Cell Manufacturers
Biomedical Device Companies
LED Manufacturers
Semiconductor Companies
Consumer Electronics Manufacturers
Healthcare and Medical Device Companies
Investment & Venture Capitalist Firms
Government and Regulatory Bodies (U.S. Department of Energy, European Commission)
Time Period Captured in the Report:
Historical Period: 2018-2023
Base Year: 2023
Forecast Period: 2023-2030
Companies
Players Mentioned in the Report:
Samsung Electronics Co., Ltd.
Nanosys Inc.
QD Vision Inc.
LG Display Co., Ltd.
Nanoco Group plc
OSRAM Licht AG
Sony Corporation
Quantum Materials Corp.
Merck Group
3M Company
Evident Technologies, Inc.
TCL Corporation
Aglient Technologies
NNCrystal US Corporation
QMC Quantum Materials Corp.
Table of Contents
1. Global Quantum Dot Technology Market Overview
1.1. Definition and Scope
1.2. Market Taxonomy
1.3. Market Growth Rate
2. Global Quantum Dot Technology Market Size (in USD Bn), 2018-2023
2.1. Historical Market Size
2.2. Year-on-Year Growth Analysis
2.3. Key Market Developments and Milestones
3. Global Quantum Dot Technology Market Analysis
3.1. Growth Drivers
3.1.1. Increasing Demand for Quantum Dot Displays
3.1.2. Rising Adoption in Healthcare and Biomedical Applications
3.1.3. Advancements in Quantum Dot Solar Cells
3.1.4. Government Support and Funding
3.2. Restraints
3.2.1. High Manufacturing Costs
3.2.2. Regulatory and Environmental Concerns
3.2.3. Limited Awareness and Adoption in Emerging Markets
3.3. Opportunities
3.3.1. Advancements in Quantum Dot Synthesis
3.3.2. Potential in Quantum Computing
3.3.3. Emerging Markets in Asia-Pacific
3.4. Trends
3.4.1. Integration with OLED Technology
3.4.2. Development of Cadmium-Free Quantum Dots
3.4.3. Increasing Use in Quantum Dot Photonic Devices
3.5. Government Regulation
3.5.1. National Quantum Initiative
3.5.2. National Quantum Mission (NQM)
3.5.3. International Standards and Certifications
3.6. SWOT Analysis
3.7. Stakeholder Ecosystem
3.8. Competition Ecosystem
4. Global Quantum Dot Technology Market Segmentation, 2023
4.1. By Product Type (in Value %)
4.1.1 Displays
4.1.2 Solar Cells
4.1.3 LED Lighting
4.2. By Application (in Value %)
4.2.1. Consumer Electronics
4.2.2. Healthcare
4.2.3. Defense and Security
4.2.4. Renewable Energy
4.3. By Material (in Value %)
4.3.1. Cadmium-Based Quantum Dots
4.3.2. Cadmium-Free Quantum Dots
4.3.3 Silicone-based Quantum Dots
4.4. By End-User (in Value %)
4.4.1. Manufacturers
4.4.2. Research Institutes
4.4.3. Original Equipment Manufacturers (OEMs)
4.5. By Region (in Value %)
4.5.1. North America
4.5.2. Europe
4.5.3. Asia-Pacific
4.5.4. Middle East & Africa
4.5.5. Latin America
5. Global Quantum Dot Technology Market Cross Comparison
5.1 Detailed Profiles of Major Companies
5.1.1 Samsung Electronics Co., Ltd.
5.1.2 Nanosys Inc.
5.1.3 QD Vision Inc.
5.1.4 LG Display Co., Ltd.
5.1.5 Nanoco Group plc
5.1.6 OSRAM Licht AG
5.1.7 Sony Corporation
5.1.8 Quantum Materials Corp.
5.1.9 Merck Group
5.1.10 3M Company
5.1.11 Evident Technologies, Inc.
5.1.12 TCL Corporation
5.1.13 Aglient Technologies
5.1.14 NNCrystal US Corporation
5.1.15 QMC Quantum Materials Corp.
5.2 Cross Comparison Parameters (No. of Employees, Headquarters, Inception Year, Revenue)
6. Global Quantum Dot Technology Market Competitive Landscape
6.1. Market Share Analysis
6.2. Strategic Initiatives
6.3. Mergers and Acquisitions
6.4. Investment Analysis
6.4.1. Venture Capital Funding
6.4.2. Government Grants
6.4.3. Private Equity Investments
7. Global Quantum Dot Technology Market Regulatory Framework
7.1. Environmental Standards
7.2. Compliance Requirements
7.3. Certification Processes
8. Global Quantum Dot Technology Future Market Size (in USD Bn), 2023-2028
8.1. Future Market Size Projections
8.2. Key Factors Driving Future Market Growth
9. Global Quantum Dot Technology Future Market Segmentation, 2028
9.1. By Product Type (in Value %)
9.2. By Application (in Value %)
9.3. By Material (in Value %)
9.4. By End-User (in Value %)
9.5. By Region (in Value %)
10. Global Quantum Dot Technology Market Analysts Recommendations
10.1. TAM/SAM/SOM Analysis
10.2. Customer Cohort Analysis
10.3. Marketing Initiatives
10.4. White Space Opportunity Analysis
Disclaimer
Contact UsResearch Methodology
Step 1: Identifying Key Variables:
Ecosystem creation for all the major entities and referring to multiple secondary and proprietary databases to perform desk research around market to collate industry level information.
Step 2: Market Building:
Collating statistics on Global Quantum Dot Technology Market over the years, penetration of marketplaces and service providers ratio to compute revenue generated for Quantum Dot Technology Market. We will also review service quality statistics to understand revenue generated which can ensure accuracy behind the data points shared.
Step 3: Validating and Finalizing:
Building market hypothesis and conducting CATIs with industry experts belonging to different companies to validate statistics and seek operational and financial information from company representatives.
Step 4: Research output:
Our team will approach multiple Quantum Dot Technology companies and understand nature of product segments and sales, consumer preference and other parameters, which will support us validate statistics derived through bottom to top approach from Quantum Dot Technology companies.
Frequently Asked Questions
01. How big is Global Quantum Dot Technology Market?
Global Quantum Dot Technology Market was valued at USD 11 billion in 2023. This growth is driven primarily by the increasing adoption of quantum dots in display technologies, such as QLED TVs and monitors, due to their ability to provide brighter, more vibrant colors and improved energy efficiency.
02. What are challenges in Global Quantum Dot Technology Market?
Challenges in the Global Quantum Dot Technology market include regulatory hurdles related to environmental concerns, high production costs due to the complexity of manufacturing processes, and limited awareness and adoption in emerging markets.
03. Who are the major players in Global Quantum Dot Technology Market?
Major players in the Global Quantum Dot Technology market include Samsung Electronics, Nanosys Inc., QD Vision Inc., LG Display, and Nanoco Group plc. These companies lead the market through extensive R&D, strategic partnerships, and innovative product offerings.
04 What are the growth drivers of the Global Quantum Dot Technology Market?
The Global Quantum Dot Technology market is driven by the increasing prevalence of chronic diseases, aging populations, and technological advancements in drug delivery systems. The demand for non-invasive and patient-friendly treatment options further propels market growth.
Why Buy From Us?
 Framework")
What makes us stand out is that our consultants follows Robust, Refine and Result (RRR) methodology. i.e. Robust for clear definitions, approaches and sanity checking, Refine for differentiating respondents facts and opinions and Result for presenting data with story

We have set a benchmark in the industry by offering our clients with syndicated and customized market research reports featuring coverage of entire market as well as meticulous research and analyst insights.

While we don't replace traditional research, we flip the method upside down. Our dual approach of Top Bottom & Bottom Top ensures quality deliverable by not just verifying company fundamentals but also looking at the sector and macroeconomic factors.

With one step in the future, our research team constantly tries to show you the bigger picture. We help with some of the tough questions you may encounter along the way: How is the industry positioned? Best marketing channel? KPI's of competitors? By aligning every element, we help maximize success.

Our report gives you instant access to the answers and sources that other companies might choose to hide. We elaborate each steps of research methodology we have used and showcase you the sample size to earn your trust.

If you need any support, we are here! We pride ourselves on universe strength, data quality, and quick, friendly, and professional service.