
Global Spatial Computing Market Outlook to 2030
Region:Global
Author(s):Shambhavi
Product Code:KROD523
December 2024
82
About the Report
Global Spatial Computing Market Overview
- The Global Spatial Computing Market was valued at USD 98 Billion in 2023. The market is driven by the increasing adoption of augmented and virtual reality technologies, advancements in artificial intelligence and machine learning, and the rising demand for spatial mapping and geospatial analysis across various industries. These factors are contributing significantly to the growth of spatial computing, enabling immersive experiences and real-time data visualization for a wide range of applications.

- The major players in the global spatial computing market include Microsoft Corporation, Apple Inc., Google LLC, Magic Leap, Inc., and Meta Platforms, Inc. These companies are at the forefront of developing cutting-edge spatial computing technologies, focusing on integrating advanced AI and machine learning capabilities to enhance user experiences and enable precise spatial mapping. In 2023, Microsoft Corporation launched its new version of HoloLens with enhanced mixed reality features, aimed at improving workplace productivity and enabling immersive learning experiences.
- The e-commerce sector has seen a significant increase in the use of spatial computing technologies to enhance online shopping experiences. According to a 2023 report by the U.S. Department of Commerce, 29% of online retailers have integrated AR features into their platforms, allowing customers to visualize products in real-time.
- In 2023, North America dominated the global spatial computing market due to the high adoption rate of advanced AR/VR technologies, significant investments in AI research, and the presence of leading technology providers in US and Canada. The increasing focus on digital transformation and the implementation of spatial computing solutions across industries such as healthcare, education, and retail.
Global Spatial Computing Market Segmentation
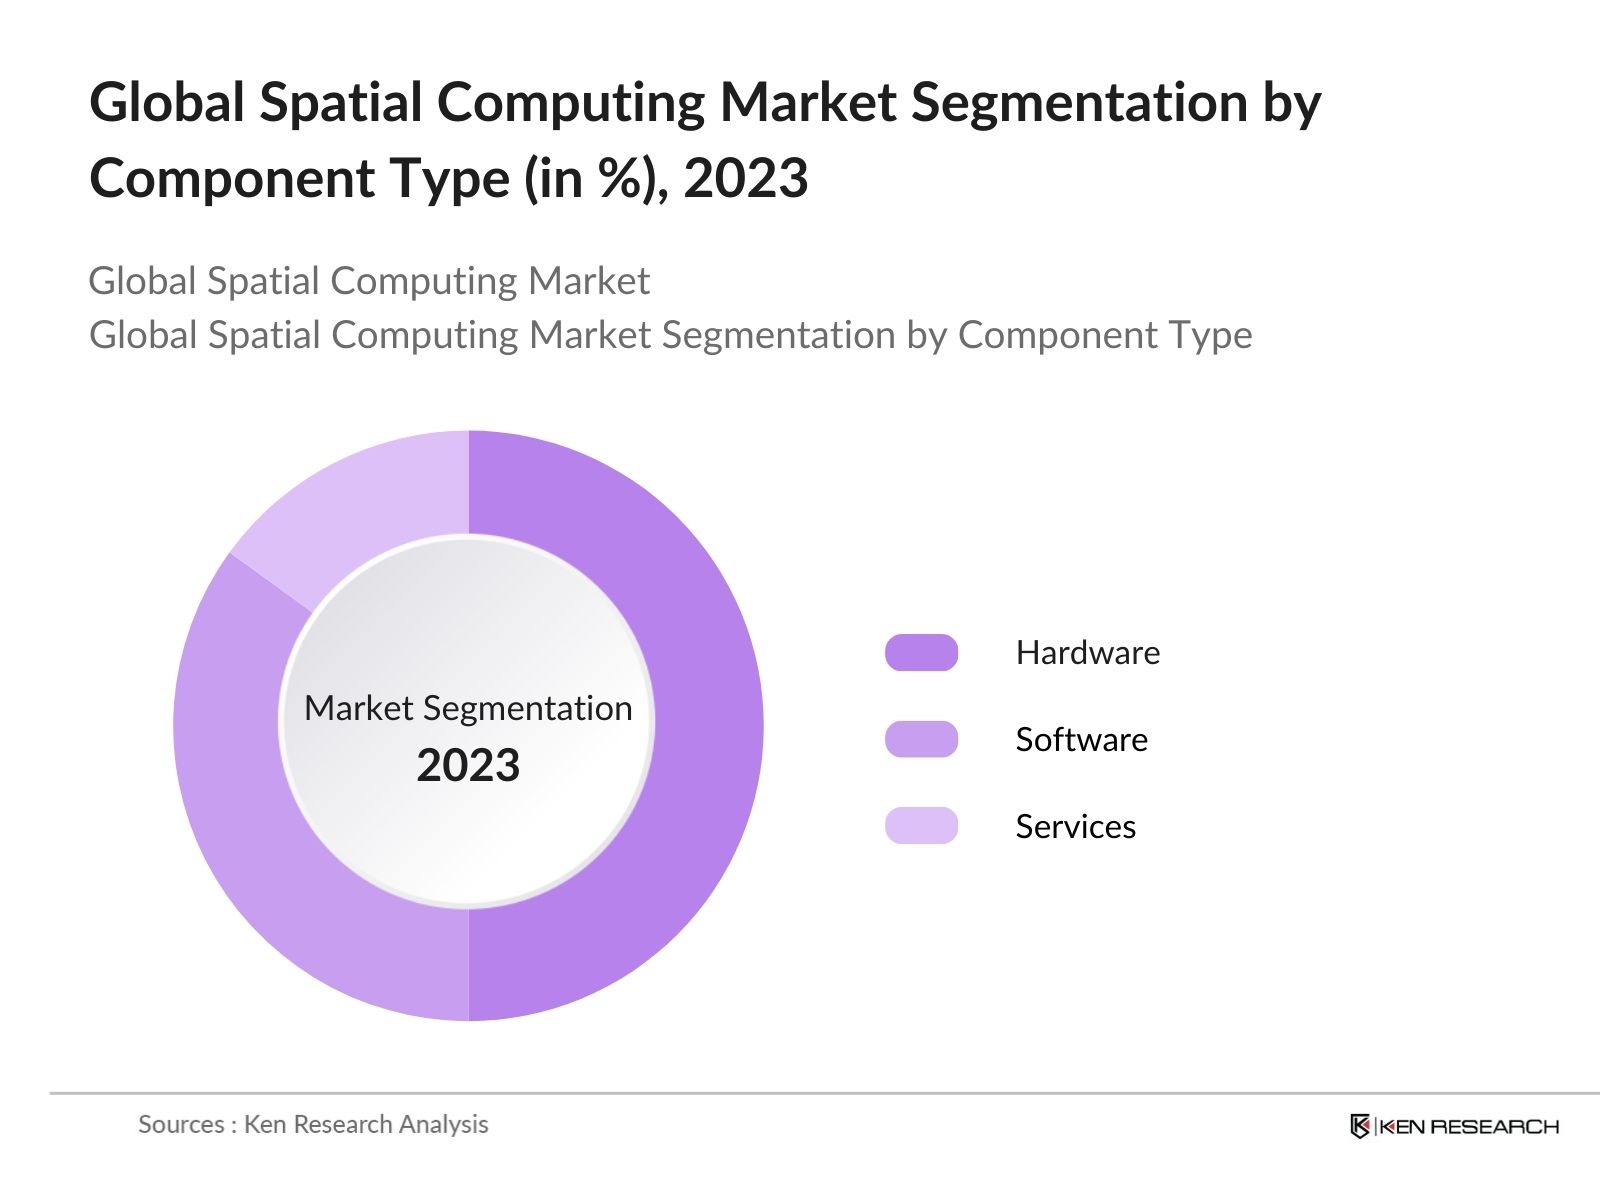
By Component: In 2023, the hardware segment held the largest share of the Asia-Pacific remote patient monitoring market, primarily due to rising demand for advanced AR/VR headsets, spatial sensors, and sophisticated computing devices. These technologies support immersive, interactive experiences that enhance patient engagement and enable more precise remote monitoring. Healthcare providers increasingly rely on these hardware solutions to facilitate real-time data collection and analysis, improving patient outcomes and enabling efficient care management.
|
Component Type |
Market Share (2023) |
|
Hardware |
50% |
|
Software |
35% |
|
Services |
15% |
By Application: The market is segmented into augmented reality, virtual reality, mixed reality, spatial mapping, and geospatial analytics. In 2023, the augmented reality segment accounted for the largest market share, fuelled by the growing use of AR applications in gaming, retail, and industrial training.
|
Application |
Market Share (in %) |
|
Augmented Reality (AR) |
40% |
|
Virtual Reality (VR) |
30% |
|
Mixed Reality (MR) |
15% |
|
Spatial Mapping |
10% |
|
Geospatial Analytics |
5% |
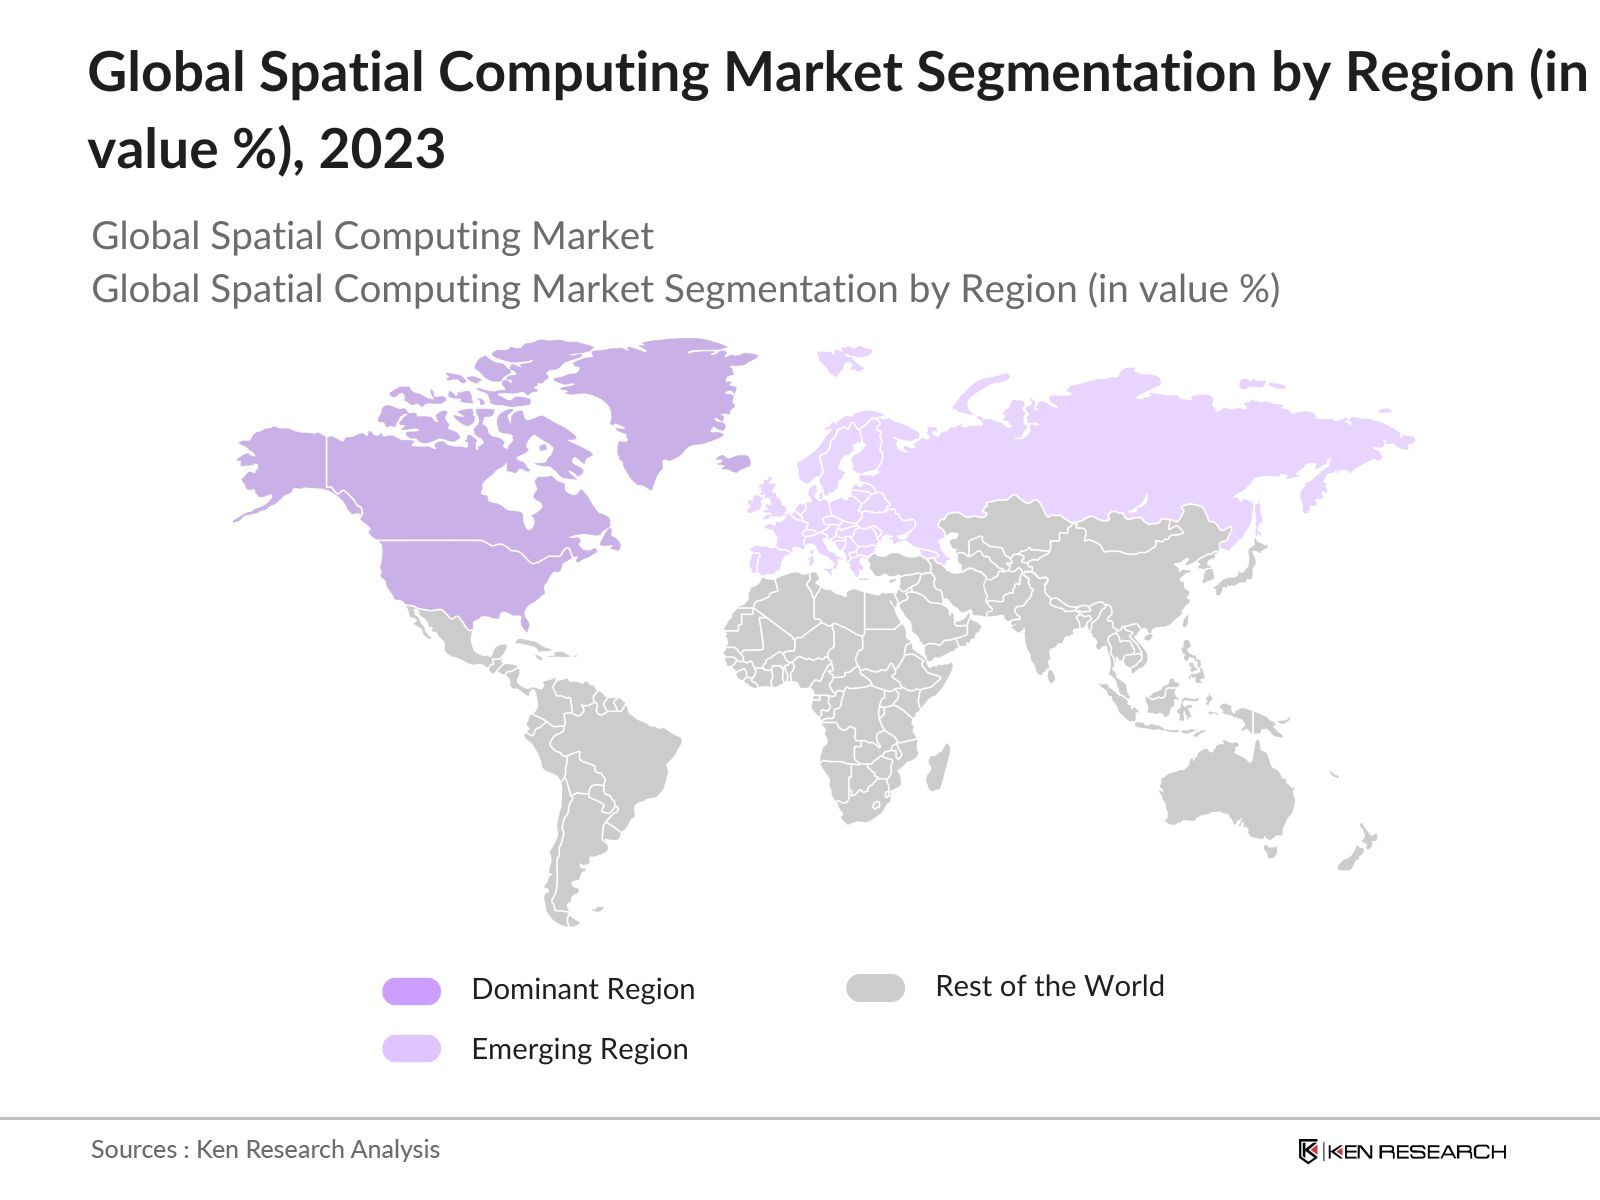
By Region: The global spatial computing market is segmented into North America, Europe, Asia-Pacific (APAC), Middle East & Africa (MEA), and Latin America. In 2023, North America dominated the global spatial computing market, holding the largest share due to its robust technology ecosystem and significant investments in research and development. This region is home to leading tech firms and innovation hubs that drive advancements in spatial computing, including AR, VR, and AI technologies. Government and private sector funding further fuel innovation, enabling the development of applications in sectors like healthcare, manufacturing, and retail.
Global Spatial Computing Market Competitive Landscape
|
Company |
Establishment Year |
Headquarters |
|
Microsoft Corporation |
1975 |
Redmond, Washington, USA |
|
Apple Inc. |
1976 |
Cupertino, California, USA |
|
Google LLC |
1998 |
Mountain View, California, USA |
|
Magic Leap, Inc. |
2010 |
Plantation, Florida, USA |
|
Meta Platforms, Inc. |
2004 |
Menlo Park, California, USA |
- Microsoft Corporation: In 2023, Microsoft introduced a new version of HoloLens with improved spatial computing capabilities, integrating advanced AI to enhance mixed reality experiences for enterprise applications. The company continues to invest heavily in spatial computing, HoloLens 2 is compatible with over 200 enterprise-ready mixed reality solutions, enhancing productivity across sectors such as healthcare, education, and manufacturing.
- Google Cloud: Google Cloud's focus on artificial intelligence (AI) has been pivotal, with the number of generative AI customer projects increasing more than150 timesfrom April to July 2023. This surge in AI usage complements the capabilities of the newly launched AR Cloud Services, enabling developers to leverage advanced AI tools for enhanced AR experiences.
Global Spatial Computing Market Analysis
Growth Drivers
- Increasing Investment in Spatial Computing Infrastructure: Investments in spatial computing infrastructure are growing significantly, particularly in developed regions like North America and Europe, driving market expansion. U.S. federal government allocated over $200 million in 2024 for the development of advanced AR/VR technologies as part of its broader initiative to enhance technological innovation and workforce capabilities. Similarly, the European Union's Digital Europe Programme allocated 200 million for spatial computing research and development to bolster digital infrastructure and innovation.
- Expansion of Enterprise Use Cases for Spatial Computing: The application of spatial computing technologies within enterprises is expanding rapidly, especially in sectors like healthcare and retail. According to the European Commission's 2023 report, over 2,500 healthcare facilities across Europe have integrated spatial computing solutions for purposes such as medical training and surgery simulations. These implementations have led to significant improvements in operational efficiency and patient outcomes.
- Growing Integration of Spatial Computing in Smart City Projects: Spatial computing technologies are increasingly being integrated into smart city projects worldwide to improve urban planning, infrastructure management, and public safety. The Singapore government invested approximately $50 million in 2024 in spatial computing technologies aimed at enhancing its smart city initiatives.
Challenges
- High Costs of Spatial Computing Technologies: The high cost associated with spatial computing technologies remains a significant barrier to market growth. A survey by the National Association of Software and Service Companies (NASSCOM) in 2023, revealed that more than half of small and medium-sized enterprises (SMEs) in India cited the high cost of AR/VR hardware and software as a major challenge to adoption.
- Data Privacy and Security Concerns: Data privacy and security issues are critical challenges facing the spatial computing market. The European Data Protection Board reported in 2024 that 54% of companies using spatial computing solutions have faced data breaches related to the collection and storage of sensitive location-based information. The misuse of geospatial data, coupled with inadequate security measures, has raised concerns about the potential risks to user privacy, thereby hindering the widespread adoption of spatial computing technologies.
Government Initiatives
U.S. Federal Funding for Spatial Computing Research: The U.S. government has significantly increased its investment in spatial computing research and development to maintain technological leadership. In 2023, the U.S. Department of Defense allocated USD 150 million for spatial computing projects, focusing on enhancing military training and simulation capabilities. This funding has accelerated the development of advanced spatial computing solutions, supporting both military and commercial applications.
European Unions Digital Strategy for AR/VR: The European Union has implemented a comprehensive digital strategy to promote the adoption of AR/VR technologies across member states. As part of this strategy, the EU launched the "Digital Europe Programme" in 2022, which allocated EUR 200 million for spatial computing initiatives aimed at fostering innovation in digital industries. This initiative supports startups and SMEs in developing cutting-edge AR/VR applications, driving the growth of the spatial computing market in Europe.
Global Spatial Computing Market Outlook
The Global Spatial Computing Market is expected to experience robust growth over the next five years, driven by continuous advancements in AR/VR technologies and the increasing integration of spatial computing solutions across various sectors.
Future Trends
- Enhanced Integration of Spatial Computing in Healthcare: By 2028, the healthcare sector is anticipated to lead in the adoption of spatial computing technologies, with applications ranging from remote surgeries to patient rehabilitation. It is projected that more than half of hospitals globally will use AR/VR tools for medical training and virtual consultations, leveraging spatial computing to enhance patient care and operational efficiency.
- Expansion of Spatial Computing in Industrial Automation: The manufacturing industry will increasingly adopt spatial computing for industrial automation and maintenance. By 2028, half of manufacturing companies worldwide will implement AR solutions for real-time equipment monitoring and predictive maintenance, reducing downtime and improving.
Scope of the Report
|
By Component Type |
Hardware Software Services |
|
By Application |
Augmented Reality (AR) Virtual Reality (VR) Mixed Reality (MR) Spatial Mapping Geospatial Analytics |
|
By End-Use Industry: |
Healthcare Education Retail Manufacturing Others |
|
By Technology |
Computer Vision Machine Learning Spatial Analytics Others |
|
By Region |
North America Europe Asia-Pacific (APAC) Middle East & Africa (MEA) Latin America |
Products
Key Target Audience Organizations and Entities Who Can Benefit by Subscribing This Report:
Government Agencies and Regulatory Bodies (DoD, NASA, ESA etc.)
Technology Developers and Providers
Educational Institutions and Training Centers
Healthcare Organizations and Medical Facilities
Retail and E-commerce Companies
Manufacturing and Industrial Firms
Real Estate and Urban Planning Entities
Government Agencies and Regulatory Bodies (DoD, NASA, ESA etc.)
Investors and Venture Capitalists
Time Period Captured in the Report
Historical Period: 2018-2023
Base Year: 2023
Forecast Period: 2023-2028
Companies
Players Mentioned in the Report:
Microsoft Corporation
Apple Inc.
Google LLC
Magic Leap, Inc.
Meta Platforms, Inc.
HTC Corporation
Vuzix Corporation
PTC Inc.
Unity Technologies
Niantic, Inc.
Table of Contents
1. Global Spatial Computing Market Overview
1.1. Definition and Scope
1.2. Market Taxonomy
1.3. Market Growth Rate
1.4. Market Segmentation Overview
2. Global Spatial Computing Market Size (in USD Bn), 2018-2023
2.1. Historical Market Size
2.2. Year-on-Year Growth Analysis
2.3. Key Market Developments and Milestones
3. Global Spatial Computing Market Analysis
3.1. Growth Drivers
3.1.1. Increasing Adoption of AR/VR Technologies
3.1.2. Advancements in AI and Machine Learning
3.1.3. Rising Demand for Spatial Mapping and Geospatial Analysis
3.2. Restraints
3.2.1. Data Privacy and Security Concerns
3.2.2. High Cost of Implementation
3.3. Opportunities
3.3.1. Technological Advancements in Spatial Computing
3.3.2. Expansion in Emerging Markets
3.4. Trends
3.4.1. Integration with AI and Machine Learning
3.4.2. Focus on Immersive Experiences
3.5. Government Regulation
3.5.1. US Governments AI Research Initiative
3.5.2. EUs Digital Strategy for AR/VR
3.6. SWOT Analysis
3.7. Stakeholder Ecosystem
3.8. Competition Ecosystem
4. Global Spatial Computing Market Segmentation, 2023
4.1. By Component (in Value %)
4.1.1. Hardware
4.1.2. Software
4.1.3. Services
4.2. By Application (in Value %)
4.2.1. Augmented Reality (AR)
4.2.2. Virtual Reality (VR)
4.2.3. Mixed Reality (MR)
4.2.4. Spatial Mapping
4.2.5. Geospatial Analytics
4.3. By End-Use Industry (in Value %)
4.3.1. Healthcare
4.3.2. Education
4.3.3. Retail
4.3.4. Manufacturing
4.3.5. Others
4.4. By Technology (in Value %)
4.4.1. Computer Vision
4.4.2. Machine Learning
4.4.3. Spatial Analytics
4.4.4. Others
4.5. By Region (in Value %)
4.5.1. North America
4.5.2. Europe
4.5.3. Asia-Pacific (APAC)
4.5.4. Middle East & Africa (MEA)
4.5.5. Latin America
5. Global Spatial Computing Market Cross Comparison
5.1. Detailed Profiles of Major Companies
5.1.1. Microsoft Corporation
5.1.2. Apple Inc.
5.1.3. Google LLC
5.1.4. Magic Leap, Inc.
5.1.5. Meta Platforms, Inc.
5.2. Cross Comparison Parameters (No. of Employees, Headquarters, Inception Year, Revenue)
6. Global Spatial Computing Market Competitive Landscape
6.1. Market Share Analysis
6.2. Strategic Initiatives
6.3. Mergers and Acquisitions
6.4. Investment Analysis
6.4.1. Venture Capital Funding
6.4.2. Government Grants
6.4.3. Private Equity Investments
7. Global Spatial Computing Market Regulatory Framework
7.1. Data Protection Standards
7.2. Compliance Requirements
7.3. Certification Processes
8. Global Spatial Computing Market Future Market Size (in USD Bn), 2023-2028
8.1. Future Market Size Projections
8.2. Key Factors Driving Future Market Growth
9. Global Spatial Computing Market Future Market Segmentation, 2028
9.1. By Component (in Value %)
9.2. By Application (in Value %)
9.3. By End-Use Industry (in Value %)
9.4. By Technology (in Value %)
9.5. By Region (in Value %)
10. Global Spatial Computing Market Analysts Recommendations
10.1. TAM/SAM/SOM Analysis
10.2. Customer Cohort Analysis
10.3. Marketing Initiatives
10.4. White Space Opportunity Analysis
Disclaimer Contact UsResearch Methodology
Step 1: Identifying Key Variables
Ecosystem creation for all major entities and referring to multiple secondary and proprietary databases to perform desk research around the market to collate market-level information.
Step 2: Market Building
Collating statistics on the Global Spatial Computing Market over the years, analyzing the penetration of spatial computing technologies, and computing the revenue generated for the market. This step also involves reviewing technology adoption rates and application effectiveness to ensure accuracy behind the data points shared.
Step 3: Validating and Finalizing
Building market hypotheses and conducting CATIs with market experts belonging to different companies to validate statistics and seek operational and financial information from company representatives.
Step 4: Research Output
Our team will approach multiple spatial computing companies to understand the nature of technology segments, consumer preferences, and other parameters. This supports validating statistics derived through a bottom-to-top approach from these spatial computing companies, ensuring accuracy and reliability in the report.
Frequently Asked Questions
01. How big is the Global Spatial Computing Market?
The Global Spatial Computing Market was valued at USD 98 billion in 2023, driven by the increasing adoption of AR/VR technologies and the growing demand for advanced spatial mapping and geospatial analytics.
02. Who are the major players in the Global Spatial Computing Market?
The major players in the global spatial computing market include Microsoft Corporation, Apple Inc., Google LLC, Magic Leap, Inc., and Meta Platforms, Inc., all of which are leaders in providing innovative spatial computing solutions and technologies.
03. What are the growth drivers of the Global Spatial Computing Market?
The growth drivers in the global spatial computing market include the increasing adoption of AR/VR technologies, advancements in AI and machine learning, and the rising demand for spatial mapping and geospatial analysis.
04. What are the challenges in the Global Spatial Computing Market?
The global spatial computing market faces challenges such as data privacy and security concerns, high cost of implementation, and the need for advanced technological infrastructure.
Why Buy From Us?
 Framework")
What makes us stand out is that our consultants follows Robust, Refine and Result (RRR) methodology. i.e. Robust for clear definitions, approaches and sanity checking, Refine for differentiating respondents facts and opinions and Result for presenting data with story

We have set a benchmark in the industry by offering our clients with syndicated and customized market research reports featuring coverage of entire market as well as meticulous research and analyst insights.

While we don't replace traditional research, we flip the method upside down. Our dual approach of Top Bottom & Bottom Top ensures quality deliverable by not just verifying company fundamentals but also looking at the sector and macroeconomic factors.

With one step in the future, our research team constantly tries to show you the bigger picture. We help with some of the tough questions you may encounter along the way: How is the industry positioned? Best marketing channel? KPI's of competitors? By aligning every element, we help maximize success.

Our report gives you instant access to the answers and sources that other companies might choose to hide. We elaborate each steps of research methodology we have used and showcase you the sample size to earn your trust.

If you need any support, we are here! We pride ourselves on universe strength, data quality, and quick, friendly, and professional service.