
Global Thermal Interface Materials Market Outlook to 2030
Region:Global
Author(s):Abhinav kumar
Product Code:KROD1399
December 2024
86
About the Report
Global Thermal Interface Materials Market Overview
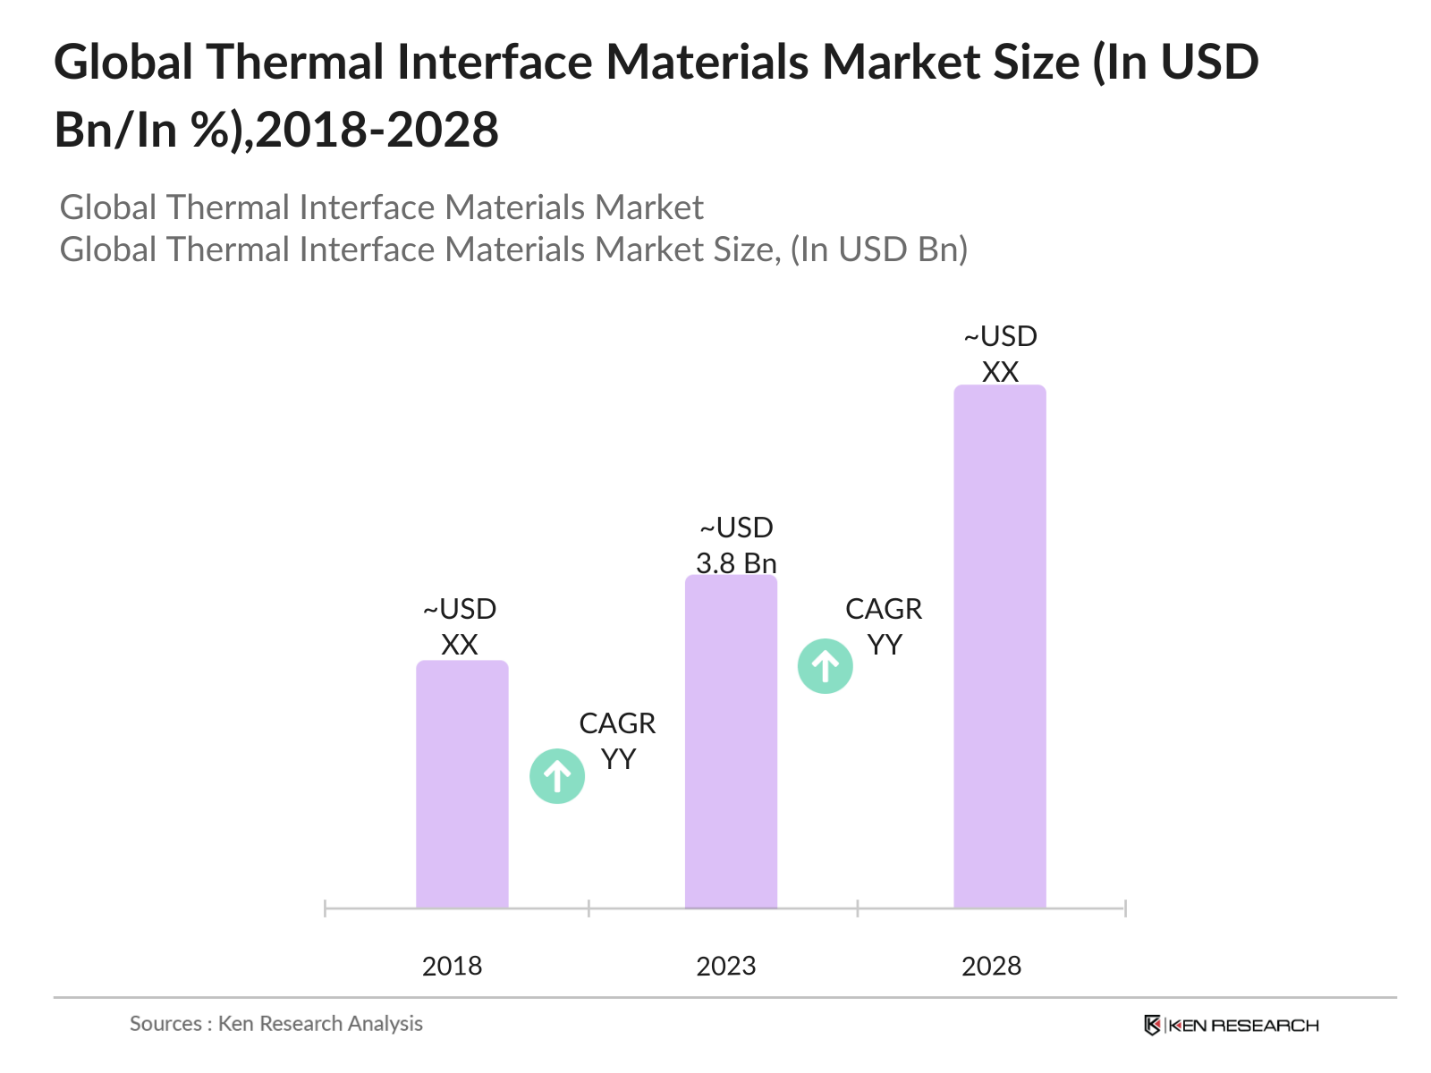
- The Global Thermal Interface Materials Market was valued at USD 3.8 billion in 2023. The market growth is primarily driven by the increasing demand for efficient heat management solutions across various industries, including electronics, automotive, and renewable energy.
- Major players in the global thermal interface materials market include Dow Inc., 3M Company, Henkel AG & Co. KGaA, Parker Hannifin Corporation, and Honeywell International Inc. These companies are leading the development of advanced thermal materials, focusing on enhancing thermal conductivity, reducing thermal resistance, and improving overall material performance for various industrial applications.
- In 2023, Dow Inc. expanded its production capabilities in Asia-Pacific, focusing on the development of high-performance thermal interface materials to meet the growing demand from electronics and automotive sectors. This strategic expansion is part of Dow's efforts to strengthen its market position and cater to the increasing need for efficient thermal management solutions in emerging markets.
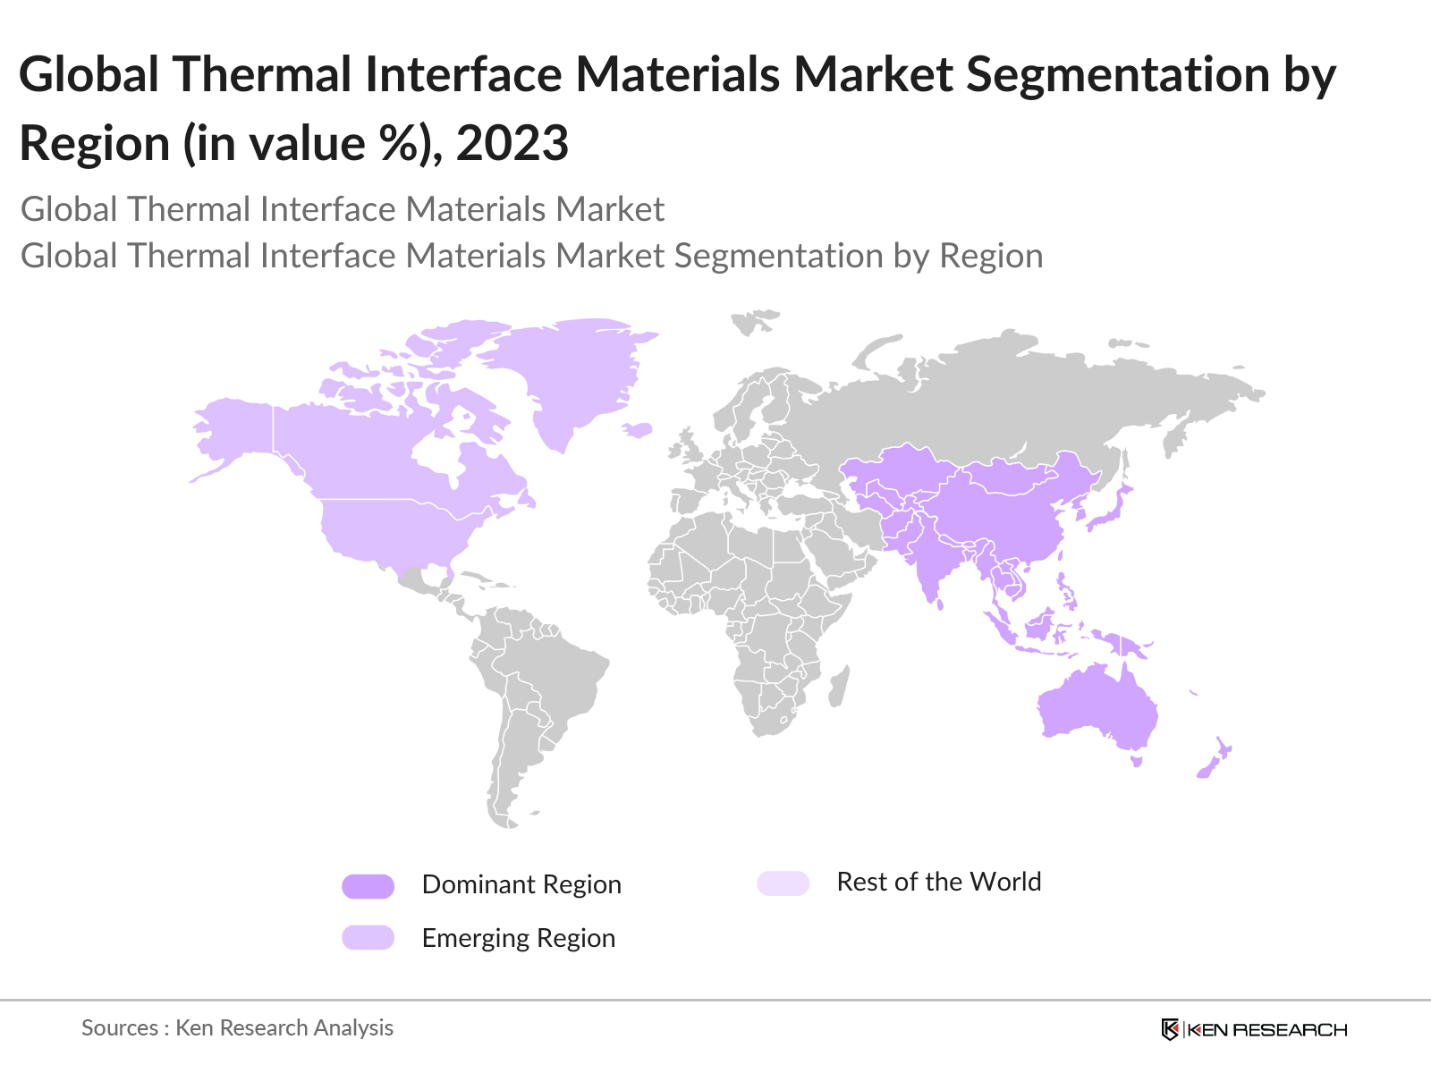
- Asia-Pacific dominated the global thermal interface materials market due to the substantial growth of the electronics manufacturing industry, high adoption rate of electric vehicles, and increased investments in renewable energy projects. The regions rapid industrialization and technological advancements have significantly contributed to the demand for advanced thermal management solutions.
Global Thermal Interface Materials Market Segmentation
The global thermal interface materials market is segmented by region, type, and application.
By Region: Geographically, the thermal interface materials market is segmented into North America, Europe, Asia-Pacific (APAC), Latin America, and the Middle East & Africa (MEA). In 2023, Asia-Pacific dominated the market due to the substantial growth of the electronics manufacturing industry and the high adoption rate of electric vehicles. Countries like China, Japan, and South Korea are leading the demand for thermal interface materials due to their robust electronics and automotive sectors.
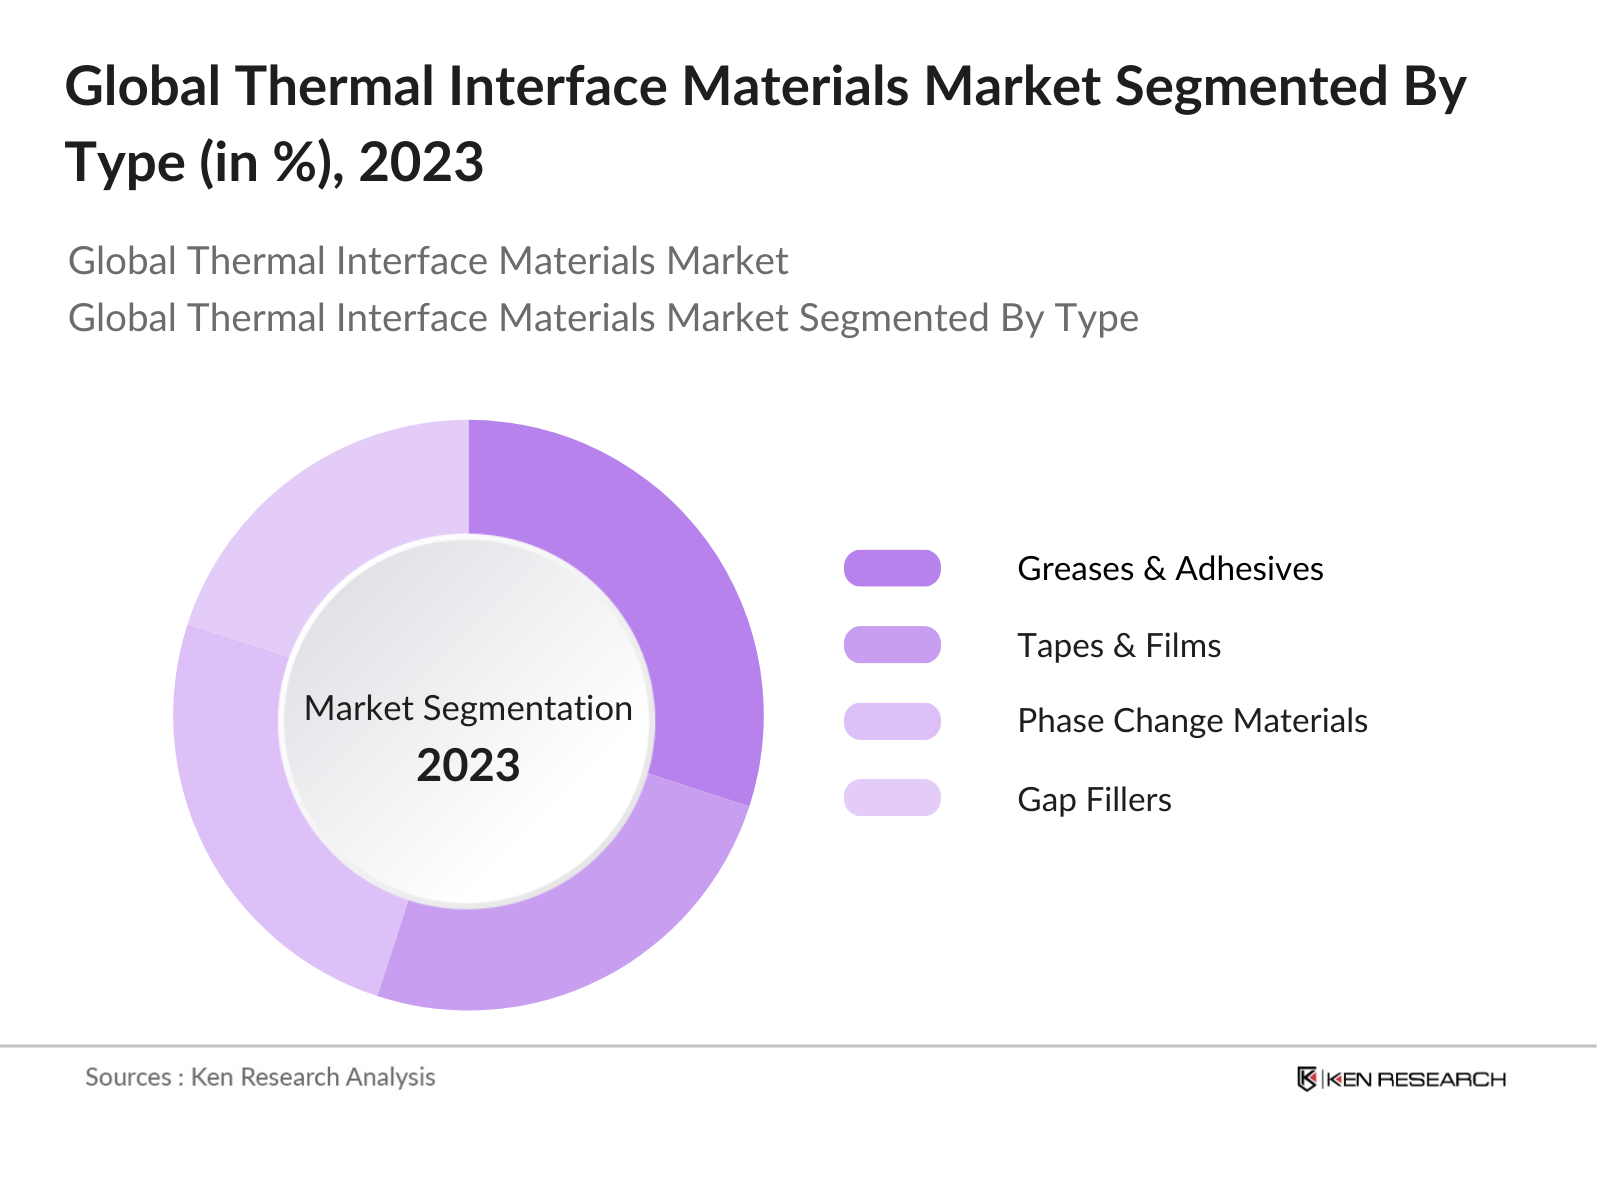
By Type: The global thermal interface materials market is segmented by type into greases & adhesives, phase change materials, and gap fillers. In 2023, greases and adhesives held the highest market share, driven by their extensive use in electronics for efficient heat dissipation. Their ability to fill microscopic air gaps and provide excellent thermal conductivity makes them ideal for applications requiring high thermal management, such as in CPUs and GPUs.
By Application: The market is further segmented by application into automotive, telecommunications, and consumer electronics. In 2023, computers and peripherals held the largest market share due to the growing demand for high-performance computing and gaming systems, which require effective thermal management solutions. The proliferation of data centers and cloud computing services also contributes to the segment's growth.
Global Thermal Interface Materials Market Competitive Landscape
|
Company Name |
Establishment Year |
Headquarters |
|
Dow Inc. |
1897 |
Midland, Michigan, USA |
|
3M Company |
1902 |
St. Paul, Minnesota, USA |
|
Henkel AG & Co. KGaA |
1876 |
Dsseldorf, Germany |
|
Parker Hannifin Corporation |
1917 |
Cleveland, Ohio, USA |
|
Honeywell International Inc. |
1906 |
Charlotte, North Carolina, USA |
3M Company: In 2022, 3M launchedtheDOWSIL TC-4040, a dispensable thermal interfacematerial (TIM) designedto enhance thermalmanagement inhigh-performance applications, particularlyin the contextof advanced technologieslike 5G. Thistwo-part thermalpad is notablefor its easeof use, strongthermal conductivity, and excellentslump resistance, making it suitablefor various electronicdevices thatgenerate significantheat.
Henkel AG & Co.KGaA: In 2023, Henkel focused on achieving climate-positive production by converting 14 sites to carbon-neutral operations and increasing the use of renewable energy in its operations. Henkel also increased its use of renewable energy sources in. The company's share of purchased electricity derived from renewable sources reached 89% by the end of the year.
Global Thermal Interface Materials Market Analysis
Global Thermal Interface Materials Market Growth Drivers
- Increasing Demand from the Electronics Industry: The global thermal interface materials market is being driven by the growing demand for efficient heat management solutions in the electronics industry. For instance, in 2023, companies like Samsung and Apple invested in research and development for advanced thermal interface materials to enhance the performance and longevity of their electronic products.
- Expansion in the Automotive Sector: In 2023, the global sales of electric cars reached nearly14 million units, which is a35% increasefrom the previous year. This surge in EV sales is driving the demand for thermal management systems that use thermal interface materials to maintain battery efficiency and prevent overheating. Automotive giants like Tesla and Toyota have announced plans to invest in the development of advanced thermal management solutions.
- Rising Investments in Renewable Energy: The shift towards renewable energy sources, particularly solar and wind power, is contributing to the growth of the thermal interface materials market. Countries like China and Germany, leading the renewable energy transition, have allocated substantial budgets for the development of thermal management technologies, which is expected to drive market growth in the coming years.
Global Thermal Interface Materials Market Challenges
- High Costs of Advanced Thermal Interface Materials: One of the significant challenges in the global thermal interface materials market is the high cost of advanced materials such as graphene and carbon-based compounds. These materials offer superior thermal conductivity but are expensive to produce, limiting their adoption in cost-sensitive applications. The high costs associated with advanced thermal interface materials can impact the overall profitability of manufacturers and hinder market growth.
- Stringent Environmental Regulations: The production and disposal of thermal interface materials are subject to stringent environmental regulations, particularly regarding hazardous chemicals and waste management. Compliance with these regulations can increase production costs and pose challenges for manufacturers in maintaining profitability. Additionally, the need to develop environmentally friendly thermal interface materials adds complexity to the manufacturing process.
Global Thermal Interface Materials Market Government Initiatives
- United States' CHIPS and Science Act 2022: In 2023, the U.S. government continued to implement the CHIPS and Science Act, which provides USD 39 billion of total funding designated for chip manufacturing incentives. This initiative aims to enhance domestic semiconductor production and includes significant funding for the development of thermal interface materials to support advanced chip manufacturing processes.
- China's Made in China 2025 Strategy: The Made in China 2025 strategy, launched in 2015, continues to focus on promoting domestic manufacturing capabilities, including in the electronics and automotive sectors. Goals include increasing the Chinese-domestic content of core materials to 40% by 2020 and 70% by 2025, to help achieve independence from foreign suppliers.
Global Thermal Interface Materials Market Future Market Outlook
The Global Thermal Interface Materials Market is expected to grow substantially over the coming years, driven by advancements in material technologies, increasing demand from electronics and automotive sectors, and growing investments in renewable energy projects.
Global Thermal Interface Materials Market Future Market Trends
- Integration of Nanotechnology in Thermal Interface Materials: By 2028, the global thermal interface materials market is expected to witness increased integration of nanotechnology to enhance material performance. Nanotechnology enables the development of materials with superior thermal conductivity and mechanical properties, making them ideal for high-performance applications.
- Rising Adoption of Eco-Friendly Thermal Interface Materials: By 2028, the market is expected to see a surge in the development and adoption of bio-based and recyclable materials, aligning with global sustainability goals. The increasing demand for environmentally friendly thermal management solutions is likely to drive innovation and growth in the thermal interface materials market.
Scope of the Report
|
By Type |
Greases & Adhesives Tapes & Films Phase Change Materials Gap Fillers |
|
By Application |
Computers & Peripherals Automotive Electronics Telecommunication Equipment |
|
By End-User |
Electronics Manufacturing Automotive Telecommunications Renewable Energy |
|
By Material |
Silicone Non-Silicone Graphite Metal |
|
By Region |
North America Europe Asia-Pacific (APAC) Middle East & Africa (MEA) Latin America |
Products
Key Target Audience Organizations and Entities Who Can Benefit by Subscribing This Report:
Electronics Manufacturers
Automotive OEMs Industries
Semiconductor Manufacturers
Electric Vehicle Manufacturers
Energy Storage Industries
Investment and Venture Capitalist Firms
Thermal Management Equipment Industries
Time Period Captured in the Report
Historical Period: 2018-2023
Base Year: 2023
Forecast Period: 2023-2028
Companies
Players Mentioned in the Report:
Abiomed Inc.
Medtronic plc
Abbott Laboratories
Getinge AB
Teleflex Incorporated
Berlin Heart GmbH
Terumo Corporation
SynCardia Systems LLC
Jarvik Heart Inc.
Biotronik SE & Co. KG
Table of Contents
1. Global Thermal Interface Materials Market Overview
1.1. Definition and Scope
1.2. Market Taxonomy
1.3. Market Growth Rate
1.4. Market Segmentation Overview
2. Global Thermal Interface Materials Market Size (in USD Bn), 2018-2023
2.1. Historical Market Size
2.2. Year-on-Year Growth Analysis
2.3. Key Market Developments and Milestones
3. Global Thermal Interface Materials Market Analysis
3.1. Growth Drivers
3.1.1. Increasing Demand from Electronics Industry
3.1.2. Expansion in Automotive Sector
3.1.3. Rising Investments in Renewable Energy
3.2. Restraints
3.2.1. High Costs of Advanced Materials
3.2.2. Stringent Environmental Regulations
3.2.3. Technological Limitations in Material Performance
3.3. Opportunities
3.3.1. Technological Advancements in Material Science
3.3.2. Expansion in Emerging Markets
3.3.3. Growth in Renewable Energy Projects
3.4. Trends
3.4.1. Integration of Nanotechnology in Materials
3.4.2. Rising Adoption of Eco-Friendly Materials
3.4.3. Increasing Use in High-Performance Applications
3.5. Government Regulation
3.5.1. CHIPS and Science Act 2022
3.5.2. Made in China 2025 Strategy
3.5.3. Horizon Europe Programme
3.5.4. Environmental Standards and Compliance
3.6. SWOT Analysis
3.7. Stakeholder Ecosystem
3.8. Competitive Ecosystem
4. Global Thermal Interface Materials Market Segmentation, 2023
4.1. By Type (in Value %)
4.1.1. Greases & Adhesives
4.1.2. Tapes & Films
4.1.3. Phase Change Materials
4.1.4. Gap Fillers
4.1.5. Others
4.2. By Application (in Value %)
4.2.1. Computers & Peripherals
4.2.2. Automotive Electronics
4.2.3. Telecommunication Equipment
4.2.4. Consumer Electronics
4.2.5. Others
4.3. By End-User (in Value %)
4.3.1. Electronics Manufacturing
4.3.2. Automotive
4.3.3. Telecommunications
4.3.4. Renewable Energy
4.3.5. Others
4.4. By Material (in Value %)
4.4.1. Silicone
4.4.2. Non-Silicone
4.4.3. Graphite
4.4.4. Metal
4.4.5. Others
4.5. By Region (in Value %)
4.5.1. North America
4.5.2. Europe
4.5.3. Asia-Pacific (APAC)
4.5.4. Middle East & Africa (MEA)
4.5.5. Latin America
5. Global Thermal Interface Materials Market Cross Comparison
5.1. Detailed Profiles of Major Companies
5.1.1. Dow Inc.
5.1.2. 3M Company
5.1.3. Henkel AG & Co. KGaA
5.1.4. Parker Hannifin Corporation
5.1.5. Honeywell International Inc.
5.1.6. Laird Technologies
5.1.7. Momentive Performance Materials Inc.
5.1.8. Fujipoly America Corporation
5.1.9. Shin-Etsu Chemical Co., Ltd.
5.1.10. Saint-Gobain Performance Plastics
5.2. Cross Comparison Parameters (No. of Employees, Headquarters, Inception Year, Revenue)
6. Global Thermal Interface Materials Market Competitive Landscape
6.1. Market Share Analysis
6.2. Strategic Initiatives
6.3. Mergers and Acquisitions
6.4. Investment Analysis
6.4.1. Venture Capital Funding
6.4.2. Government Grants
6.4.3. Private Equity Investments
7. Global Thermal Interface Materials Market Regulatory Framework
7.1. Environmental Standards
7.2. Compliance Requirements
7.3. Certification Processes
8. Global Thermal Interface Materials Future Market Size (in USD Bn), 2023-2028
8.1. Future Market Size Projections
8.2. Key Factors Driving Future Market Growth
9. Global Thermal Interface Materials Market Future Market Segmentation, 2028
9.1. By Type (in Value %)
9.2. By Application (in Value %)
9.3. By End-User (in Value %)
9.4. By Material (in Value %)
9.5. By Region (in Value %)
10. Global Thermal Interface Materials Market Analysts Recommendations
10.1. TAM/SAM/SOM Analysis
10.2. Customer Cohort Analysis
10.3. Marketing Initiatives
10.4. White Space Opportunity Analysis
Disclaimer
Contact Us
Research Methodology
Step 1: Identifying Key Variables
Ecosystem creation for all the major entities and referring to multiple secondary and proprietary databases to perform desk research around the market to collate market-level information.
Step 2: Market Building
Collating statistics on the Global Thermal Interface Materials Market over the years and analyzing the penetration of marketplaces as well as the ratio of service providers to compute the revenue generated for the market. We will also review service quality statistics to understand the revenue generated, which can ensure accuracy behind the data points shared.
Step 3: Validating and Finalizing
Building market hypotheses and conducting CATIs with market experts belonging to different companies to validate statistics and seek operational and financial information from company representatives.
Step 4: Research Output
Our team will approach multiple thermal interface materials companies to understand the nature of product segments, consumer preferences, and other parameters. This supports validating statistics derived through a bottom-to-top approach from these companies, ensuring accuracy and reliability in the report.
Frequently Asked Questions
1. How big is the Global Thermal Interface Materials Market?
The global thermal interface materials market was valued at USD 3.8 billion in 2023. The market growth is driven by rising demand from electronics, automotive, and renewable energy sectors that require efficient thermal management solutions.
2. What are the challenges in the Global Thermal Interface Materials Market?
Challenges in the global thermal interface materials market include the high cost of advanced materials, stringent environmental regulations, and technological limitations in extreme conditions. These factors can hinder market growth and pose challenges to manufacturers.
3. Who are the major players in the Global Thermal Interface Materials Market?
Major players in the global thermal interface materials market include Dow Inc., 3M Company, Parker Hannifin Corporation, Henkel AG & Co. KGaA, and Honeywell International Inc. These companies lead the market due to their extensive product offerings and continuous innovation.
4. What are the growth drivers of the Global Thermal Interface Materials Market?
The growth of the global thermal interface materials market is driven by increasing demand from the electronics and automotive sectors, rising investments in renewable energy, and advancements in material technologies. These factors contribute to the expanding need for effective thermal management solutions.
Why Buy From Us?
 Framework")
What makes us stand out is that our consultants follows Robust, Refine and Result (RRR) methodology. i.e. Robust for clear definitions, approaches and sanity checking, Refine for differentiating respondents facts and opinions and Result for presenting data with story

We have set a benchmark in the industry by offering our clients with syndicated and customized market research reports featuring coverage of entire market as well as meticulous research and analyst insights.

While we don't replace traditional research, we flip the method upside down. Our dual approach of Top Bottom & Bottom Top ensures quality deliverable by not just verifying company fundamentals but also looking at the sector and macroeconomic factors.

With one step in the future, our research team constantly tries to show you the bigger picture. We help with some of the tough questions you may encounter along the way: How is the industry positioned? Best marketing channel? KPI's of competitors? By aligning every element, we help maximize success.

Our report gives you instant access to the answers and sources that other companies might choose to hide. We elaborate each steps of research methodology we have used and showcase you the sample size to earn your trust.

If you need any support, we are here! We pride ourselves on universe strength, data quality, and quick, friendly, and professional service.