
Global UV-Visible Spectroscopy Market Outlook to 2030
Region:Global
Author(s):Shubham Kashyap
Product Code:KROD604
October 2024
91
About the Report
Global UV-Visible Spectroscopy Market Overview
- In 2023, the Global UV-Visible Spectroscopy Market was valued at USD 1.1 billion, experiencing consistent growth from 2018-2023. This growth is driven by increased demand for advanced analytical techniques in pharmaceuticals, environmental testing, and academic research sectors.
- Prominent players in the UV-Visible Spectroscopy market include Agilent Technologies, Shimadzu Corporation, Thermo Fisher Scientific, PerkinElmer Inc., and JASCO Inc. These companies are leading the market with innovative spectroscopic instruments that cater to various industries.
- The United States, Germany, and Japan are dominant countries in the market. These countries contribute substantially to market growth due to their strong research infrastructure, leading pharmaceutical industries, and continuous investment in technological advancements.
- Agilent Technologies announced the release of the Cary 3500 Flexible UV-Vis spectrophotometer in March 2023. This double-beam system features advanced photometric performance for diverse sample types with minimal preparation, designed for use in regulated environments, particularly in the pharmaceutical and biopharmaceutical industries. It includes enhanced software for improved data processing efficiency

Global UV-Visible Spectroscopy Market Segmentation
The Global UV-Visible Spectroscopy Market can be segmented based on type, application, and region:
- By Type: The market is segmented into single-beam and double-beam spectrophotometers, each catering to different analytical needs and industries. In 2023, double-beam spectrophotometers dominated the market, accounting for a substantial share due to their superior accuracy and reliability. These instruments allow simultaneous measurement of sample and reference, reducing errors caused by fluctuations in light source intensity.

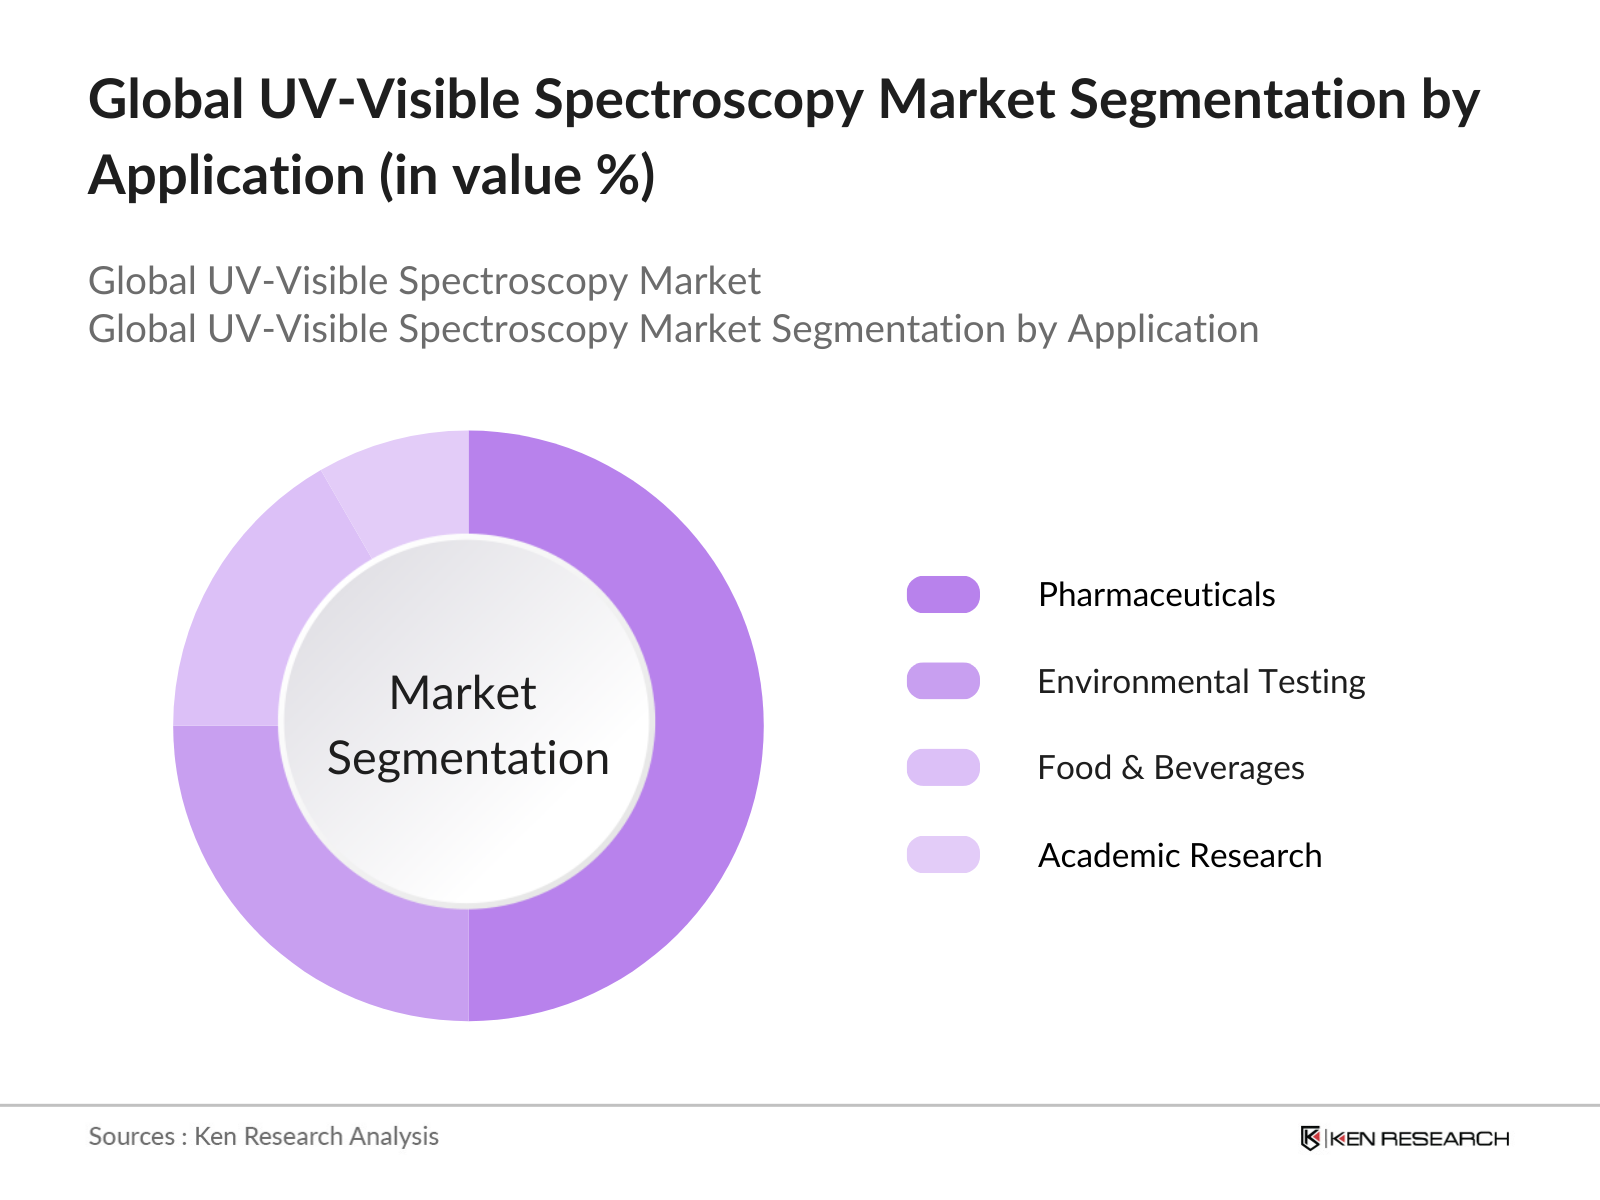
- By Application: The market is further segmented into pharmaceuticals, environmental testing, food & beverages, and academic research, each representing an important application area for these analytical instruments. In 2023, the pharmaceutical segment led the market, driven by the increasing need for precise and reliable analytical techniques in drug development, quality control, and regulatory compliance.
- By Region: The market is geographically segmented into North America, Europe, Asia-Pacific (APAC), Latin America, and the Middle East & Africa (MEA). In 2023, North America emerged as the largest market, supported by robust research activities, a well-established pharmaceutical industry, and investments in healthcare infrastructure. The region is a major contributor with leading research institutions and pharmaceutical companies driving demand for advanced analytical tools like UV-visible spectrophotometers.
Global UV-Visible Spectroscopy Market Competitive Landscape
|
Company |
Establishment Year |
Headquarters |
|
Agilent Technologies |
1999 |
Santa Clara, California, USA |
|
Shimadzu Corporation |
1875 |
Kyoto, Japan |
|
Thermo Fisher Scientific |
1956 |
Waltham, Massachusetts, USA |
|
PerkinElmer Inc. |
1937 |
Waltham, Massachusetts, USA |
|
JASCO Inc. |
1958 |
Tokyo, Japan |
- Agilent Technologies: In 2023, JASCO Inc. introduced the V-770 UV-Visible/NIR spectrophotometer, which features a wide wavelength range from 190 to 2700 nm (with an option for 3200 nm) and advanced software integration. This instrument is particularly suited for complex applications in materials science and chemical analysis, enhancing JASCO's presence in high-end research laboratories.
- Shimadzu Corporation: In2023, Shimadzu introduced theUV-1900i spectrophotometer, which features improved measurement speed and accuracy. This new instrument is designed to cater to the environmental and food safety testing markets, enhancing research capabilities in these areas. The UV-1900i also incorporates advanced technology for versatile applications in various fields.
Global UV-Visible Spectroscopy Industry Analysis
Growth Drivers:
-
Increasing Pharmaceutical R&D: The growing emphasis on quality control in the pharmaceutical industry is an important driver for the UV-Visible Spectroscopy market. According to the Organization for Economic Co-operation and Development (OECD), the United States is expected to be the leading country worldwide in terms of spending on pharmaceutical research and development, with R&D expenditure exceeding USD 679 billion in 2022. China is also projected to invest about USD 551.1 billion into pharmaceutical R&D. This demand is further driven by the rising number of FDA-approved drug applications, necessitating advanced quality control measures.
- Environmental Monitoring Needs: Environmental monitoring is becoming increasingly critical as governments worldwide tighten regulations on water and air quality. The European Environment Agency (EEA) reported an increase in the enforcement of environmental monitoring standards across EU member states from 2022 to 2024. UV-Visible spectroscopy is a preferred method for detecting and quantifying pollutants such as nitrates and phosphates in water bodies, driving its adoption in environmental testing laboratories. The push for cleaner environments, as seen in Chinas Blue Sky initiative, under which China's air pollution levels fell by 42.3% between 2013 and 2021, is further boosting the market.
- Rising Research and Development Activities in Academia: The global focus on academic research, particularly in life sciences and materials science, is contributing to the growth of the UV-Visible Spectroscopy market. The National Science Foundation (NSF) in the United States allocated USD 9.8 billion for scientific research in 2023, with a huge portion dedicated to analytical instruments like UV-Visible spectrophotometers. Similarly, the European Research Council (ERC) funded hundreds of research projects in 2024, each requiring advanced analytical tools for precise measurements, thereby fueling market demand.
Challenges:
-
High Costs of Advanced Spectrophotometers: The adoption of UV-Visible spectroscopy is often hindered by the high initial costs associated with advanced spectrophotometers. These financial burdens can limit the market penetration of high-end spectrophotometers, particularly in developing regions where budget constraints are more pronounced. Inflationary pressures and supply chain disruptions have further exacerbated the cost challenges, making it difficult for small and medium-sized enterprises (SMEs) to invest in the latest spectroscopic technologies.
- Complexity of Operation and Maintenance: The technical complexity associated with operating and maintaining advanced UV-Visible spectrophotometers presents an important challenge for laboratories. Specialized training is often required for personnel to operate these instruments efficiently, which can lead to additional costs and potential operational downtime. Furthermore, the need for regular calibration and maintenance adds to the complexity
Government Initiatives:
-
FDAs Pharmaceutical Quality Testing Guidelines: The U.S. Food and Drug Administration (FDA) has introduced stricter guidelines for pharmaceutical quality testing, mandating the use of precise analytical instruments like UV-Visible spectrophotometers. In 2023, the FDAs increased oversight led to rise in pharmaceutical companies upgrading their laboratory equipment to meet these new standards, ensuring compliance and enhancing drug safety.
- European Unions Water Framework Directive: The European Unions Water Framework Directive, aimed at achieving good water quality across member states by 2027, has driven the adoption of UV-Visible spectroscopy for water quality monitoring. The European Environment Agency (EEA) reported that majority of EU countries had adopted UV-Visible spectrophotometers in their environmental monitoring protocols by 2024, reflecting the directive's impact on market growth.
Global UV-Visible Spectroscopy Market Future Outlook to 2028
The global UV-Visible Spectroscopy market is expected to witness remarkable growth during the forecast period 2023-2028, driven by ongoing advancements in spectroscopic technologies, increased demand from pharmaceuticals, and heightened environmental monitoring efforts.
Future Market Trends:
-
Expansion of UV-Visible Spectroscopy in Biotechnology: By 2028, the UV-Visible Spectroscopy market is expected to see a significant increase in its application within the biotechnology sector. The rise of personalized medicine and the growing focus on genetic research will drive demand for precise analytical techniques. This trend is likely to lead to increased investments in advanced spectrophotometers that offer higher sensitivity and accuracy, particularly in DNA/RNA quantification and protein analysis.
- Adoption of AI-Driven Analytical Tools: The integration of artificial intelligence (AI) in UV-Visible spectroscopy is anticipated to revolutionize data analysis and interpretation by 2028. AI-driven tools are expected to enhance the accuracy of spectral data analysis, reducing human error and speeding up the decision-making process. Governments and private sector laboratories are likely to increase their investment in AI-powered spectroscopic solutions, particularly in the pharmaceutical and environmental sectors.
Scope of the Report
|
By Region |
North America Europe APAC Latin America MEA |
|
By Type |
Single-beam Spectrophotometer Double-beam Spectrophotometer |
|
By Application |
Pharmaceuticals Environmental Testing Food & Beverages Academic Research |
|
By Material |
Glass Plastic |
|
By End-User |
Pharmaceutical Industry Environmental Testing Laboratories Food & Beverage Industry Academic and Research Institutions |
Products
Key Target Audience Organizations and Entities Who Can Benefit by Subscribing to This Report:
Pharmaceutical Companies
Environmental Testing Laboratories
Food and Beverage Manufacturers
Biotechnology Firms
Healthcare Providers and Hospitals
UV-Visible Spectroscopy Instrument Manufacturers
Banks and Financial Institutions
Regulatory Bodies (e.g., FDA, EMA)
Investors and Venture Capitalists
Time Period Captured in the Report:
Historical Period: 2018-2023
Base Year: 2023
Forecast Period: 2023-2028
Companies
Players Mentioned in the Report:
Agilent Technologies
Shimadzu Corporation
Thermo Fisher Scientific
PerkinElmer Inc.
JASCO Inc.
Hitachi High-Tech Corporation
Mettler Toledo
HORIBA Scientific
Bruker Corporation
Analytik Jena AG
Bio-Rad Laboratories, Inc.
Merck KGaA
Beckman Coulter, Inc.
BMG LABTECH
Ocean Insight
Table of Contents
1. Global UV-Visible Spectroscopy Market Overview
1.1. Definition and Scope
1.2. Market Taxonomy
1.3. Market Growth Rate
1.4. Market Segmentation Overview
2. Global UV-Visible Spectroscopy Market Size (in USD Bn), 2018-2023
2.1. Historical Market Size
2.2. Year-on-Year Growth Analysis
2.3. Key Market Developments and Milestones
3. Global UV-Visible Spectroscopy Market Analysis
3.1. Growth Drivers
3.1.1. Increasing Pharmaceutical R&D
3.1.2. Environmental Monitoring Needs
3.1.3. Rising Research and Development Activities in Academia
3.2. Restraints
3.2.1. High Costs of Advanced Spectrophotometers
3.2.2. Complexity of Operation and Maintenance
3.3. Opportunities
3.3.1. Technological Advancements in Spectroscopy
3.3.2. Integration with AI and IoT
3.4. Trends
3.4.1. Miniaturization and Portability
3.4.2. Integration with Digital Technologies
3.4.3. Increased Use in Food Safety Testing
3.5. Government Regulation
3.5.1. FDAs Pharmaceutical Quality Testing Guidelines
3.5.2. European Unions Water Framework Directive
3.5.3. Indias National Clean Air Program (NCAP)
3.6. SWOT Analysis
3.7. Stake Ecosystem
3.8. Competition Ecosystem
4. Global UV-Visible Spectroscopy Market Segmentation, 2023
4.1. By Type (in Value %)
4.1.1. Single-beam Spectrophotometer
4.1.2. Double-beam Spectrophotometer
4.2. By Application (in Value %)
4.2.1. Pharmaceuticals
4.2.2. Environmental Testing
4.2.3. Food & Beverages
4.2.4. Academic Research
4.3. By Region (in Value %)
4.3.1. North America
4.3.2. Europe
4.3.3. Asia-Pacific (APAC)
4.3.4. Latin America
4.3.5. Middle East & Africa (MEA)
4.4. By Material Type (in Value %)
4.4.1. Glass
4.4.2. Plastic
4.5. By End-User Industry (in Value %)
4.5.1. Pharmaceutical Industry
4.5.2. Environmental Testing Laboratories
4.5.3. Food & Beverage Industry
4.5.4. Academic and Research Institutions
5. Global UV-Visible Spectroscopy Market Cross Comparison
5.1. Detailed Profiles of Major Companies
5.1.1. Agilent Technologies
5.1.2. Shimadzu Corporation
5.1.3. Thermo Fisher Scientific
5.1.4. PerkinElmer Inc.
5.1.5. JASCO Inc.
5.2. Cross Comparison Parameters (No. of Employees, Headquarters, Inception Year, Revenue)
6. Global UV-Visible Spectroscopy Market Competitive Landscape
6.1. Market Share Analysis
6.2. Strategic Initiatives
6.3. Mergers and Acquisitions
6.4. Investment Analysis
6.4.1. Venture Capital Funding
6.4.2. Government Grants
6.4.3. Private Equity Investments
7. Global UV-Visible Spectroscopy Market Regulatory Framework
7.1. Regulatory Policies
7.2. Compliance Requirements
7.3. Certification Processes
8. Global UV-Visible Spectroscopy Market Future Size (in USD Bn), 2023-2028
8.1. Future Market Size Projections
8.2. Key Factors Driving Future Market Growth
9. Global UV-Visible Spectroscopy Market Future Segmentation, 2028
9.1. By Type (in Value %)
9.2. By Application (in Value %)
9.3. By Region (in Value %)
9.4. By Material Type (in Value %)
9.5. By End-User Industry (in Value %)
10. Global UV-Visible Spectroscopy Market Analysts Recommendations
10.1. TAM/SAM/SOM Analysis
10.2. Customer Cohort Analysis
10.3. Marketing Initiatives
10.4. White Space Opportunity Analysis
11. Disclaimer
12. Contact Us
Research Methodology
Step: 1 Identifying Key Variables:
Ecosystem creation for all the major entities and referring to multiple secondary and proprietary databases to perform desk research around market to collate industry level information.
Step: 2 Market Building:
Collating statistics on global UV-visible spectroscopy market over the years, penetration of marketplaces and service providers ratio to compute revenue generated for global UV-visible spectroscopy market. We will also review service quality statistics to understand revenue generated which can ensure accuracy behind the data points shared.
Step: 3 Validating and Finalizing:
Building market hypothesis and conducting CATIs with industry experts belonging to different companies to validate statistics and seek operational and financial information from company representatives.
Step: 4 Research Output:
Our team will approach multiple essential pharmaceutical and biotechnology companies and understand nature of product segments and sales, consumer preference and other parameters, which will support us validate statistics derived through bottom to top approach from pharmaceutical and biotechnology companies.
Frequently Asked Questions
01. How big is the Global UV-Visible Spectroscopy Market?
The Global UV-Visible Spectroscopy Market was valued at USD 1.1 billion in 2023, driven by increasing demand from the pharmaceutical, environmental, and academic sectors for precise analytical techniques.
02. What are the challenges in the Global UV-Visible Spectroscopy Market?
Challenges in the Global UV-Visible Spectroscopy Market include the high cost of advanced spectrophotometers, technical complexity in operation and maintenance, and supply chain disruptions affecting the availability of key components.
03. Who are the major players in the Global UV-Visible Spectroscopy Market?
Key players in the Global UV-Visible Spectroscopy Market include Agilent Technologies, Shimadzu Corporation, Thermo Fisher Scientific, PerkinElmer Inc., and JASCO Inc. These companies lead the market with their innovative products and extensive global presence.
04. What are the growth drivers of the Global UV-Visible Spectroscopy Market?
The Global UV-Visible Spectroscopy Market is driven by increasing pharmaceutical R&D, the need for environmental monitoring, and rising research activities in academic institutions. These factors contribute to the growing adoption of UV-Visible spectroscopy across various industries.
Global UV-Visible Spectroscopy Market Size
Why Buy From Us?
 Framework")
What makes us stand out is that our consultants follows Robust, Refine and Result (RRR) methodology. i.e. Robust for clear definitions, approaches and sanity checking, Refine for differentiating respondents facts and opinions and Result for presenting data with story

We have set a benchmark in the industry by offering our clients with syndicated and customized market research reports featuring coverage of entire market as well as meticulous research and analyst insights.

While we don't replace traditional research, we flip the method upside down. Our dual approach of Top Bottom & Bottom Top ensures quality deliverable by not just verifying company fundamentals but also looking at the sector and macroeconomic factors.

With one step in the future, our research team constantly tries to show you the bigger picture. We help with some of the tough questions you may encounter along the way: How is the industry positioned? Best marketing channel? KPI's of competitors? By aligning every element, we help maximize success.

Our report gives you instant access to the answers and sources that other companies might choose to hide. We elaborate each steps of research methodology we have used and showcase you the sample size to earn your trust.

If you need any support, we are here! We pride ourselves on universe strength, data quality, and quick, friendly, and professional service.