
India Beverage Market Outlook to 2029
Region:Asia
Author(s):Nishika and Kartika
Product Code:KR1495
Region:Asia
Author(s):Nishika and Kartika
Product Code:KR1495
April 2025
80-100
By Type of Beverage: Carbonated and alcoholic beverages dominate the market, accounting for nearly two-thirds of consumption. The rising health focus is boosting demand for juices and RTD drinks. Carbonates retain popularity for on-the-go convenience, while alcoholic cans continue to be strong due to portability. Dairy-based drinks hold a minor share due to packaging preferences.
By Material Type: Aluminum cans dominate due to their lightweight, higher recycling value, and extended shelf life. A growing focus on sustainability and cost-efficiency is driving a gradual shift away from tin. Brands prefer aluminum for its eco-friendly benefits and lower transport costs, contributing to its rising share in beverage packaging.
The market is consolidated, with two major players commanding the entire domestic supply. These firms operate high-capacity manufacturing units with advanced production lines and wide distribution networks. They serve both multinational and domestic beverage brands across carbonated, alcoholic, and dairy segments. Entry barriers remain high due to capital intensity, technical standards, and scale economies.
Over the next five years, the India Beverage Market is expected to witness steady growth. Key drivers include rising urban consumption, the adoption of sustainable packaging practices, and the premiumization of beverage portfolios. Expanding consumer demand for convenience is likely to drive the use of cans in emerging categories such as dairy, functional beverages, and craft drinks, while circular economy policies will further strengthen aluminum's market position.
|
By Beverage Type |
Carbonates |
|
By Material Type |
Aluminium |
|
By Procurement Mode |
Domestic Production |
1.1 Segment Flowchart
2.1.1 India Beverage Market: Ecosystem
2.1.2 India Beverage Market: Value Chain
2.1.3 India Beverage Market Size, 2019–2030F
2.1.4 Segmentation by Organized & Unorganized, 2024 & 2030F
2.1.5 Segmentation by Packaging Type, 2024 & 2030F
2.1.6 Segmentation by Distribution Channel, 2024 & 2030F
2.1.7 Segmentation by Geography, 2024 & 2030F
2.1.8 Top 40 Cities in Focus for the Beverages Market in India
2.1.9 Segmentation by Demographics, 2024 & 2030F
2.1.10 Threats and Challenges in the India Beverages Market
2.1.11 Market Trends and Developments in India Beverages Market
2.2.1 India Bottled Water Market Size, 2019–2030F
2.2.2 India Sparkling Water Market Size, 2019–2030F
2.2.3 Segmentation by Organized & Unorganized, 2024 & 2030F
2.2.4 Segmentation by Price Range, 2024 & 2030F
2.2.5 Segmentation by Packaging Type, 2024 & 2030F
2.2.6 Segmentation by Distribution Channel, 2024 & 2030F
2.2.7 Channel Mix: Insights from Industry Experts
2.2.8 Segmentation by Geography, 2024 & 2030F
2.2.9 Segmentation by Demographics, 2024 & 2030F
2.2.10 Market Share of Key Players in India Bottled Water Market, FY’24
2.2.11 Cross Comparison of Key Players in India Bottled Water Market
2.3.1 India Carbonated & Soft Drinks Market Size, 2019–2030F
2.3.2 India Soda Market Size, 2019–2030F
2.3.3 Segmentation by Organized & Unorganized, 2024 & 2030F
2.3.4 Segmentation by Price Range, 2024 & 2030F
2.3.5 Segmentation by Packaging Type, 2024 & 2030F
2.3.6 Segmentation by Pack Type, 2024 & 2030F
2.3.7 Segmentation by Distribution Channel, 2024 & 2030F
2.3.8 Channel Mix: Insights from Industry Experts
2.3.9 Segmentation by Geography, 2024 & 2030F
2.3.10 Segmentation by Demographics, 2024 & 2030F
2.3.11 Market Share of Key Players in India Carbonated & Soft Drinks Market, FY’24
2.3.12 Cross Comparison of Key Players in India Carbonated & Soft Drinks Market
2.4.1 India Juices & Nectar Market Size, 2019–2030F
2.4.2 Segmentation by Organized & Unorganized, 2024 & 2030F
2.4.3 Segmentation by Price Range, 2024 & 2030F
2.4.4 Segmentation by Packaging Type, 2024 & 2030F
2.4.5 Segmentation by Distribution Channel, 2024 & 2030F
2.4.6 Channel Mix: Insights from Industry Experts
2.4.7 Segmentation by Geography, 2024 & 2030F
2.4.8 Segmentation by Demographics, 2024 & 2030F
2.4.9 Market Share of Key Players in India Juices & Nectar Market, FY’24
2.4.10 Cross Comparison of Key Players in India Juices & Nectar Market
2.5.1 India Energy & Sports Market Size, 2019–2030F
2.5.2 Segmentation by Organized & Unorganized, 2024 & 2030F
2.5.3 Segmentation by Price Range, 2024 & 2030F
2.5.4 Segmentation by Packaging Type, 2024 & 2030F
2.5.5 Segmentation by Distribution Channel, 2024 & 2030F
2.5.6 Channel Mix: Insights from Industry Experts
2.5.7 Segmentation by Geography, 2024 & 2030F
2.5.8 Segmentation by Demographics, 2024 & 2030F
2.5.9 Market Share of Key Players in India Energy & Sports Drinks Market, FY’24
2.5.10 Cross Comparison of Key Players in India Energy & Sports Drinks Market
3.1 Varun Beverages
3.2 Bisleri
3.3 Campa Cola
4.1 Price Mix Strategy
4.2 Bottled Water
4.3 Carbonated Soft Drinks Market
4.4 Juices and Nectars
4.5 Sports & Energy Drinks
6.1 Macro-Economic Parameters, 2024
6.2 Policy Changes in the F&B Sector
6.3 F&B Sector in India and China, 2024
6.4 Prices of Major Commodities
6.5 Cross-Comparison of Major Players
6.6 Market Trends and Development: India F&B Market
6.7 Growth Drivers: India F&B Market
6.8 Porter’s 5 Forces: India F&B Market
7.1 Market Definitions and Assumptions
7.2 Market Sizing Approach
7.3 Appendix
7.4 Research Limitations and Conclusion
The study began by identifying core variables including beverage categories, material usage, and manufacturing locations. Government notifications, industry reports, and secondary data from packaging associations were examined to define the structural base of the market.
Production data, procurement trends, and material share were triangulated using company financials, secondary sources, and import-export records. Projections were built on volume trends, sustainability policies, and segment-level beverage demand.
Over 30 stakeholders were interviewed via CATI including beverage producers, can manufacturers, and supply chain intermediaries. Inputs were gathered on manufacturing capacity, procurement strategies, and future packaging preferences.
Validated data was aggregated and projected up to 2029 using CAGR modeling. Category-wise, material-wise, and procurement-based splits were prepared to provide a holistic market outlook. Sustainability influence, policy interventions, and pricing inputs were also considered.
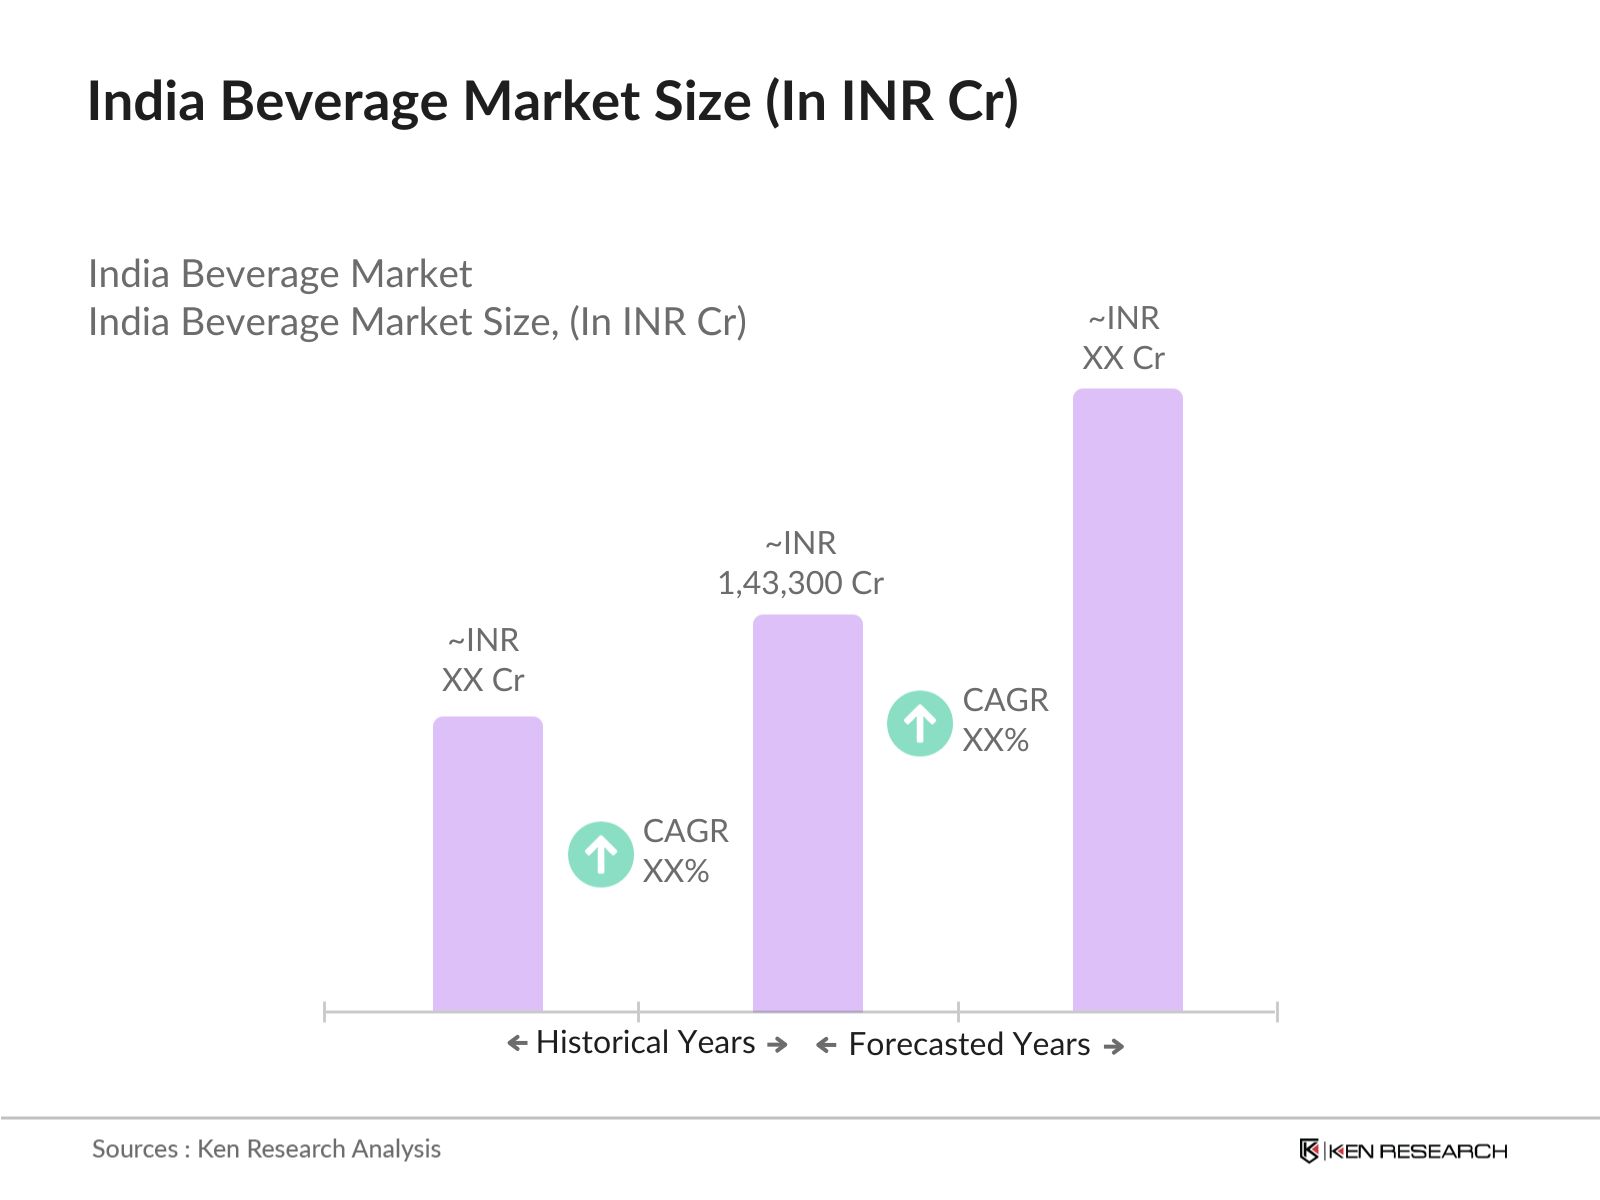
The India Beverages Market is valued at 1,43,300 Cr units in production volume, based on a five-year historical analysis. The market has witnessed consistent expansion, driven by India's Extended Producer Responsibility (EPR) framework.
India Beverage market faces challenges like volatile aluminum prices and limited penetration in rural regions due to high cost compared to PET and glass are the main challenges.
India Beverage market key players include Ball Beverage Packaging, Canpack India, Hindustan Tin Works, Oricon Enterprises, and Manaksia Limited.
India Beverage market is driven by Demand for sustainable, recyclable packaging, growing urban beverage consumption, and rising preference for portion-controlled, portable drink formats.
Carbonated drinks and alcoholic beverages dominate India Beverage market followed by juices and dairy-based beverages.
 Framework")
What makes us stand out is that our consultants follows Robust, Refine and Result (RRR) methodology. i.e. Robust for clear definitions, approaches and sanity checking, Refine for differentiating respondents facts and opinions and Result for presenting data with story

We have set a benchmark in the industry by offering our clients with syndicated and customized market research reports featuring coverage of entire market as well as meticulous research and analyst insights.

While we don't replace traditional research, we flip the method upside down. Our dual approach of Top Bottom & Bottom Top ensures quality deliverable by not just verifying company fundamentals but also looking at the sector and macroeconomic factors.

With one step in the future, our research team constantly tries to show you the bigger picture. We help with some of the tough questions you may encounter along the way: How is the industry positioned? Best marketing channel? KPI's of competitors? By aligning every element, we help maximize success.

Our report gives you instant access to the answers and sources that other companies might choose to hide. We elaborate each steps of research methodology we have used and showcase you the sample size to earn your trust.

If you need any support, we are here! We pride ourselves on universe strength, data quality, and quick, friendly, and professional service.