Join Meeting Now

Your data is secure and never shared.

India
August 2026

India Biofertilizer Market Size, Share & Forecast, By Product Type, Crop Type & Application, 2026-2031

2031

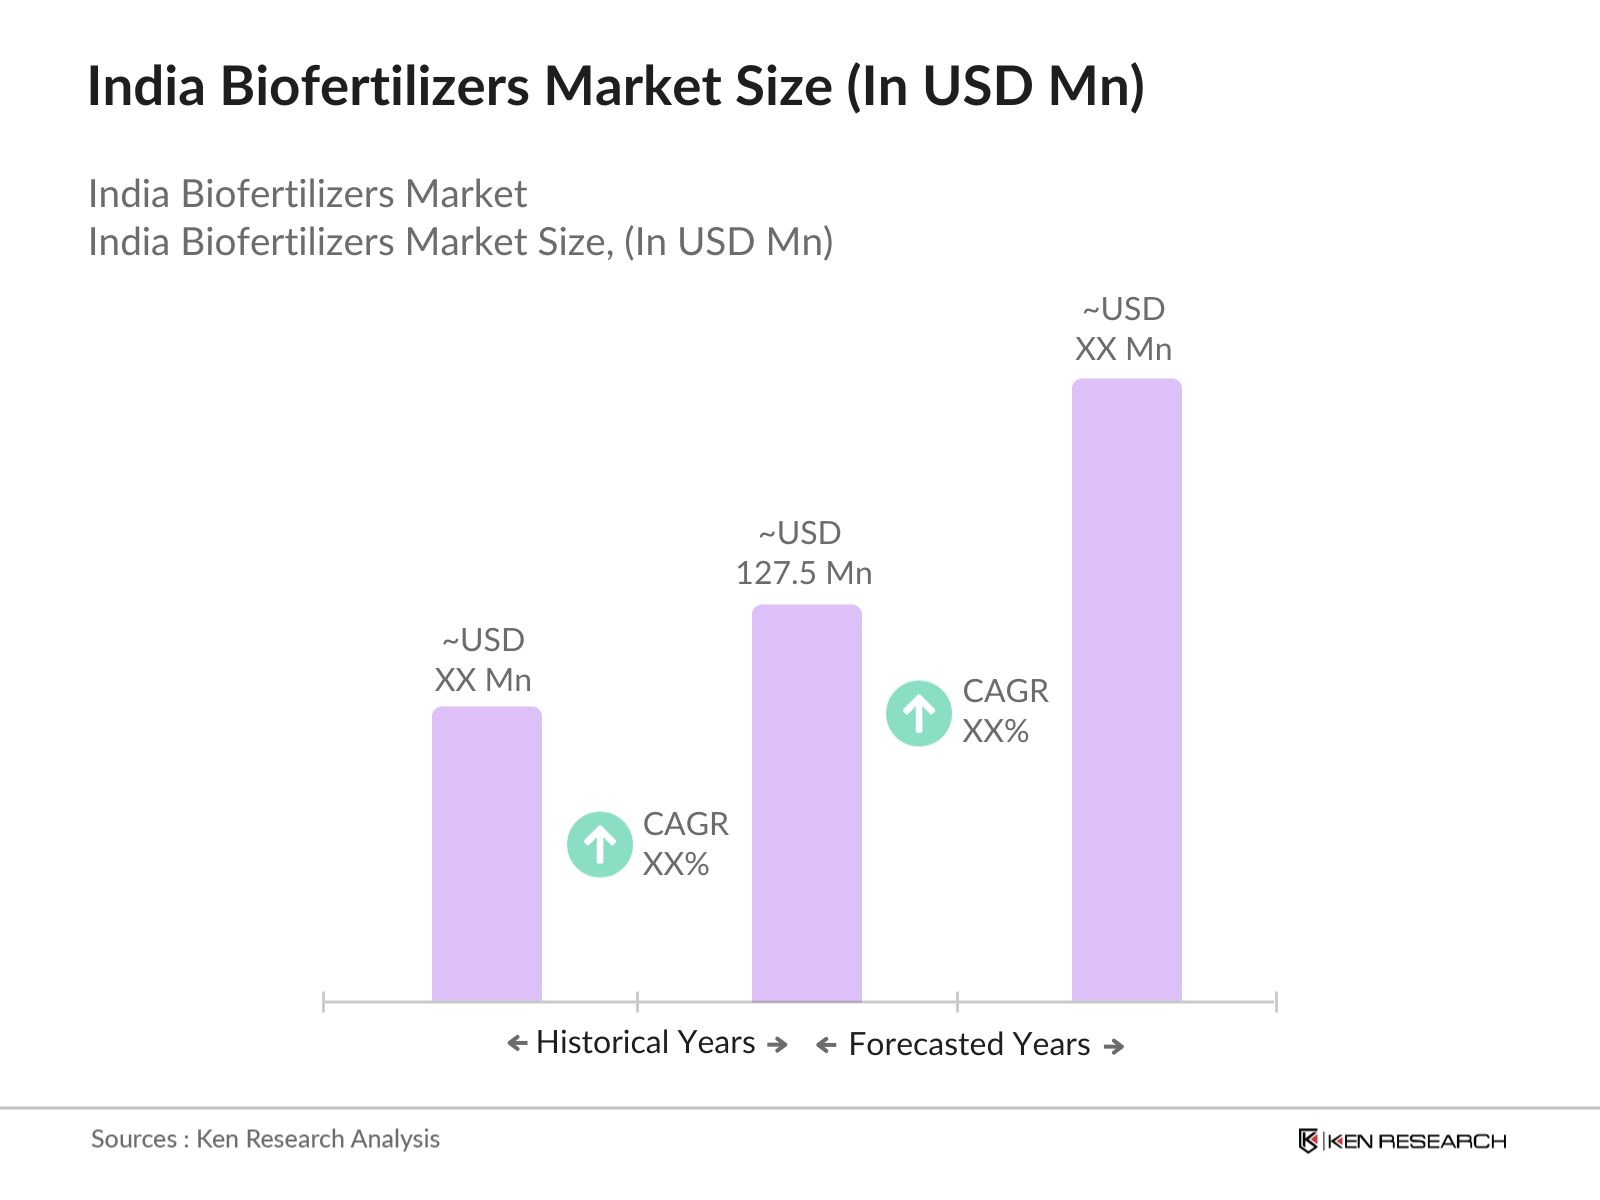
The India Biofertilizer Market worth USD 153 million in 2026 is growing at a CAGR of 8.81% to reach USD 254 million by 2031. Indian Farmers Fertiliser Cooperative Limited, IPL Biologicals Limited, UPL Limited, Rallis India Limited and T. Stanes and Company Limited are the major companies operating in this market.

Report Details

Base Year

2025

Pages

81

Region

India

Author

Ken Research

Product Code
KR-RPT-V02-07174

CHAPTER 1 - MARKET SUMMARY

Market Overview

The India Biofertilizer Market operates through microbial strain developers, formulation plants, agricultural input distributors, cooperatives, farmer producer organizations, and institutional procurement programmes. Demand is anchored by India's 357.73 million tonnes of foodgrain production in FY2024-25, which creates a large recurring nutrient-management base across cereals, pulses, and oilseeds. Commercial value depends on verified microbial viability, agronomic performance, and repeat purchase rates.

Production is geographically concentrated in western and southern manufacturing clusters with established fermentation, agricultural biotechnology, and dealer infrastructure. National Centre for Organic and Natural Farming data recorded 256,209.938 metric tonnes of carrier-based and 106,494.001 kilolitres of liquid biofertilizer production in 2023-24. Gujarat, Madhya Pradesh, Maharashtra, Karnataka, and Tamil Nadu collectively influence national supply economics and interstate distribution availability.

Market Value

USD 153 million

2025

Dominant Region

South India

2025

Dominant Segment

Cereals and Millets

2025

Total Number of Players

300

Future Outlook

The India Biofertilizer Market is projected to expand from USD 153 million in 2025 to USD 254 million by 2031, representing an 8.81% forecast CAGR. Growth will be volume-led, with treated-hectare-equivalent doses rising from 29.0 million in 2025 to 45.4 million in 2031. Liquid formulations, multi-strain consortia, crop-specific microbial packages, and application through fertigation will outpace conventional carrier-based products. The transition is supported by improving shelf life, lower freight intensity per treated hectare, more consistent dosing, and integration with precision nutrient-management programmes across commercial horticulture, plantations, cereals, pulses, and oilseeds.

Historical market growth averaged 9.54% during 2020-2025 as organic farming programmes, biological input portfolios, and private agricultural distribution expanded. Forecast growth moderates slightly because adoption remains constrained by variable field efficacy, low farmer awareness, fragmented landholdings, and inconsistent quality-control enforcement. Policy support nevertheless provides a durable demand floor. PM-PRANAM, the National Mission on Natural Farming, 10,000 planned Bio-input Resource Centres, and state-level fertilizer-reduction incentives will strengthen institutional channels. Suppliers with verified strains, liquid fermentation capacity, local agronomy support, and FPO partnerships are positioned to capture the largest incremental profit pools through 2031.

8.81%

Forecast CAGR

$254 Mn

2030 Projection

Base Year

2025

Historical Period

2020-2025

Forecast Period

2026-2031

Historical CAGR

9.54%

CHAPTER 2 - SCOPE OF REPORT

Scope of the Market

Click to Explore Interactive Mind Map

CHAPTER 3 - Key Stakeholders

Key Target Audience

Key stakeholders who can leverage from this market analysis for investment, strategy, and operational planning.

Investors

CAGR, fermentation capex, margins, adoption risk, channel scalability

Corporates

strain portfolio, quality compliance, distribution reach, formulation economics

Government

nutrient efficiency, soil health, standards, farmer adoption, resilience

Operators

viable counts, shelf life, utilization, dealer productivity, returns

Financial institutions

working capital, capacity finance, demand stability, covenant risk

What You'll Gain

  • Market sizing and trajectory
  • Policy and compliance mapping
  • Formulation mix indicators
  • Segment structure and levers
  • Competitive landscape shortlist
  • CEO-grade risk priorities

80+

Pages of insights

CHAPTER 4 - Market Size & Growth

Market Size, Growth Forecast and Trends

This section evaluates the historical market size, analyzes year-over-year growth dynamics, and presents forecast projections supported by market performance indicators and demand-side drivers.

Historical & Projected Market Size ($ Million)

Year-over-Year Growth Rate (%)

Market Value vs Volume Growth (%)

Historical Market Performance (2020-2025)

The market expanded from USD 97 million in 2020 to USD 153 million in 2025. The strongest annual expansion occurred in 2023, when value growth reached 10.34%, reflecting renewed field demonstrations, improved agricultural input availability, and greater acceptance of liquid cultures. Volume increased from 20.2 million to 29.0 million treated-hectare-equivalent doses, while average realization rose from USD 4.80 to USD 5.28 per dose. Demand remained concentrated in cereals, pulses, oilseeds, and commercial horticulture, with South and West India providing the strongest manufacturing and distribution clusters.

Forecast Market Outlook (2026-2031)

The base scenario reaches USD 254 million in 2031 at an 8.81% CAGR, supported by volume expansion to 45.4 million treated-hectare-equivalent doses. A constrained scenario reaches approximately USD 221 million if field-efficacy concerns and dealer training gaps persist, while an accelerated scenario approaches USD 286 million if Bio-input Resource Centres, FPO procurement, and crop-specific consortia scale faster. Liquid products are projected to represent 66% of market value by 2031, improving shelf life and distribution economics. The forecast reconciles with the independently published 2025 estimate of USD 152.5 million.

CHAPTER 5 - Market Data

Market Breakdown

The India Biofertilizer Market is shifting toward higher-volume liquid products and multi-strain formulations. The operating KPI trajectory indicates that treated area, product durability, formulation mix, and channel execution will determine supplier-level growth and capital returns.

Market Breakdown

Historical Data (2020-2024) • Base Data (2025) • Forecast Data (2026-2031)

Year
Market Size (USD Mn)
YoY Growth (%)
Treated-Hectare-Equivalent Doses (Mn)
Liquid Formulation Share (%)
Multi-Strain Consortia Share (%)
Period
2020$97 Mn+-20.246%
$#%
Forecast
2021$106 Mn+9.28%21.848%
$#%
Forecast
2022$116 Mn+9.43%23.550%
$#%
Forecast
2023$128 Mn+10.34%25.352%
$#%
Forecast
2024$140 Mn+9.38%27.155%
$#%
Forecast
2025$153 Mn+9.29%29.057%
$#%
Forecast
2026$166 Mn+8.50%31.259%
$#%
Forecast
2027$181 Mn+9.04%33.661%
$#%
Forecast
2028$197 Mn+8.84%36.262%
$#%
Forecast
2029$215 Mn+9.14%39.063%
$#%
Forecast
2030$234 Mn+8.84%42.165%
$#%
Forecast
2031$254 Mn+8.55%45.466%
$#%
Forecast

Treated-Hectare-Equivalent Doses

29.0 million doses, 2025, India. Dose expansion is the primary revenue driver because price increases remain modest. India recorded 357.73 million tonnes of foodgrain output in FY2024-25, providing a recurring addressable crop base.

Liquid Formulation Share

57%, 2025, India. Liquid products improve storage life, dose consistency, and freight economics. Official production data recorded 106,494.001 kilolitres of liquid biofertilizers in 2023-24, led by Gujarat and Madhya Pradesh.

Multi-Strain Consortia Share

30%, 2025, India. Consortia enable bundled nitrogen, phosphorus, potassium, and micronutrient propositions. ICAR has developed formulations combining two or more strains alongside zinc- and potassium-solubilizing products, improving portfolio differentiation.

CHAPTER 6 - Segmentation

Market Segmentation Framework

Comprehensive analysis across key dimensions providing insights into market structure, farmer preferences, agronomic applications, and distribution patterns.

No of Segments

7

Dominant Segment

Crop Type

Fastest Growing Segment

Application

Product Type

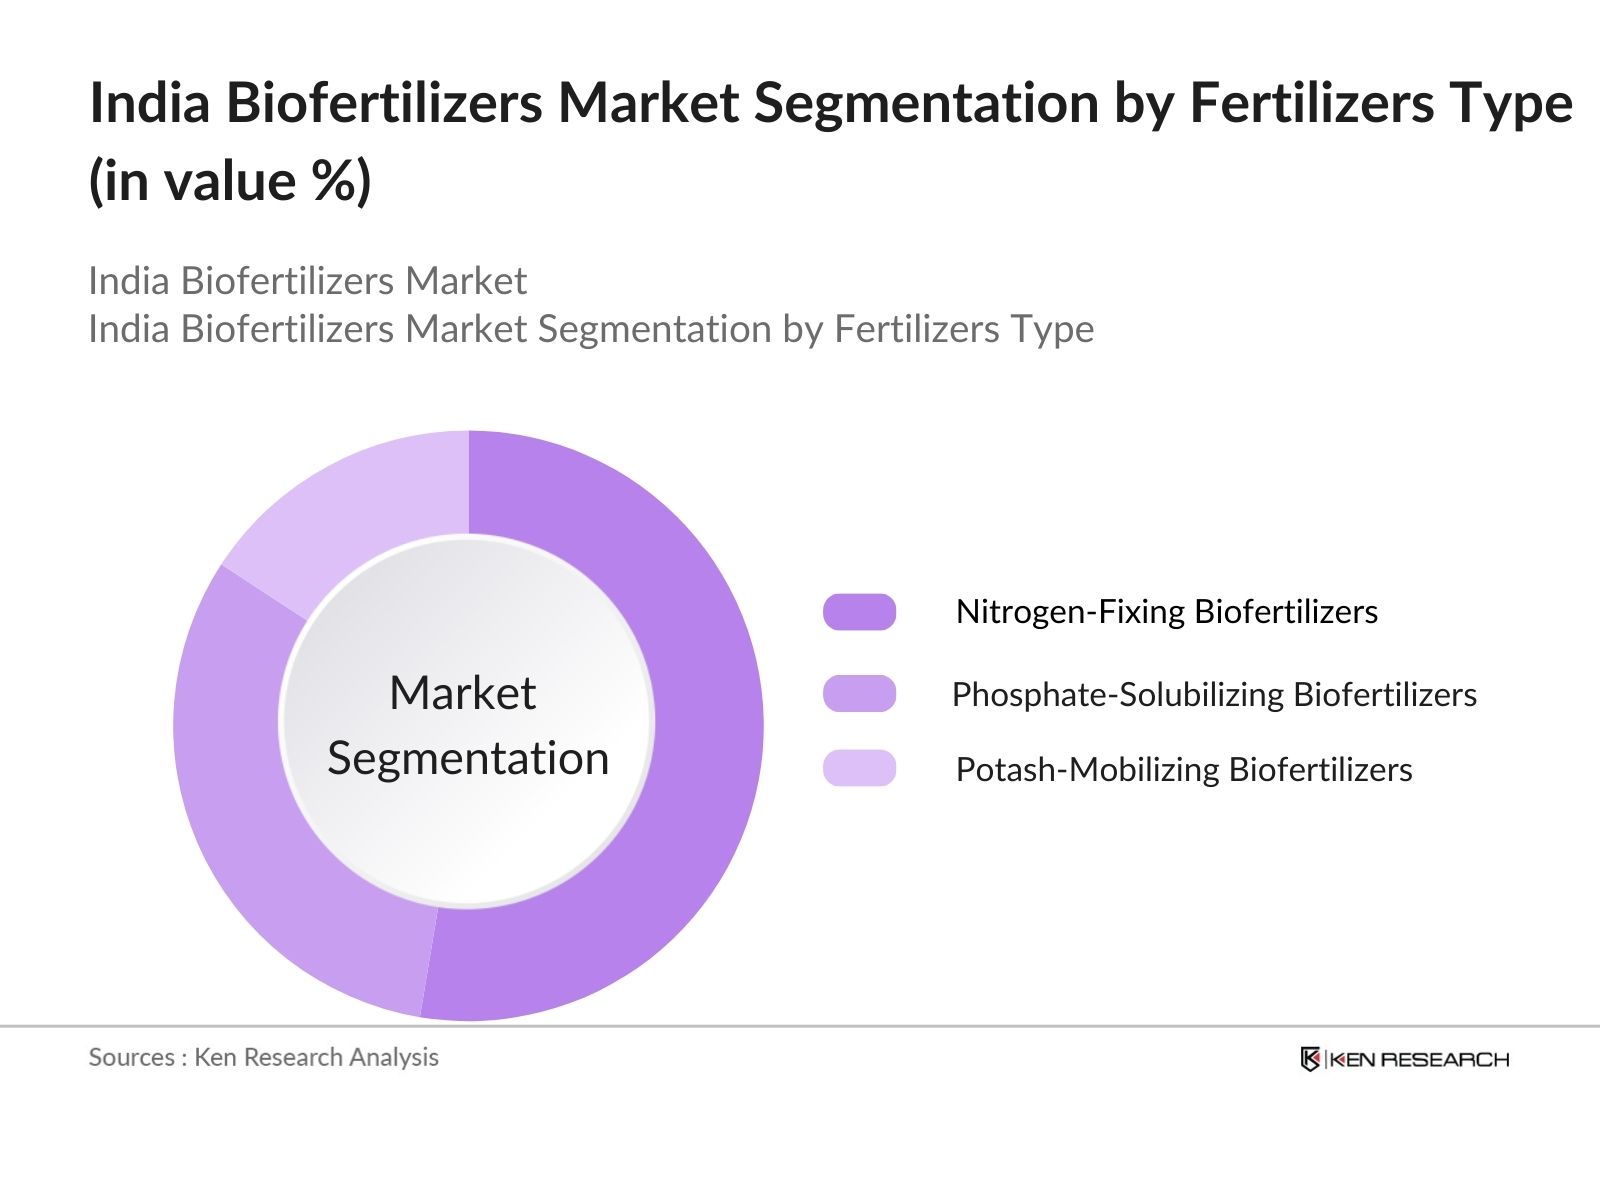
Nitrogen-Fixing Microbial Inoculants
$%
Phosphate-Solubilizing and Mobilizing Inoculants
$%
Potassium and Zinc-Solubilizing Inoculants
$%
Mycorrhizal Biofertilizers
$%
Multi-Strain Consortia
$%

Crop Type

Cereals and Millets
$%
Pulses and Oilseeds
$%
Fruits and Vegetables
$%
Plantation and Commercial Crops
$%
Turf, Floriculture and Ornamentals
$%

Customer Type

Individual Farmers
$%
Farmer Producer Organizations and Cooperatives
$%
Commercial Plantations and Contract Farms
$%
Government and Institutional Buyers
$%

Application

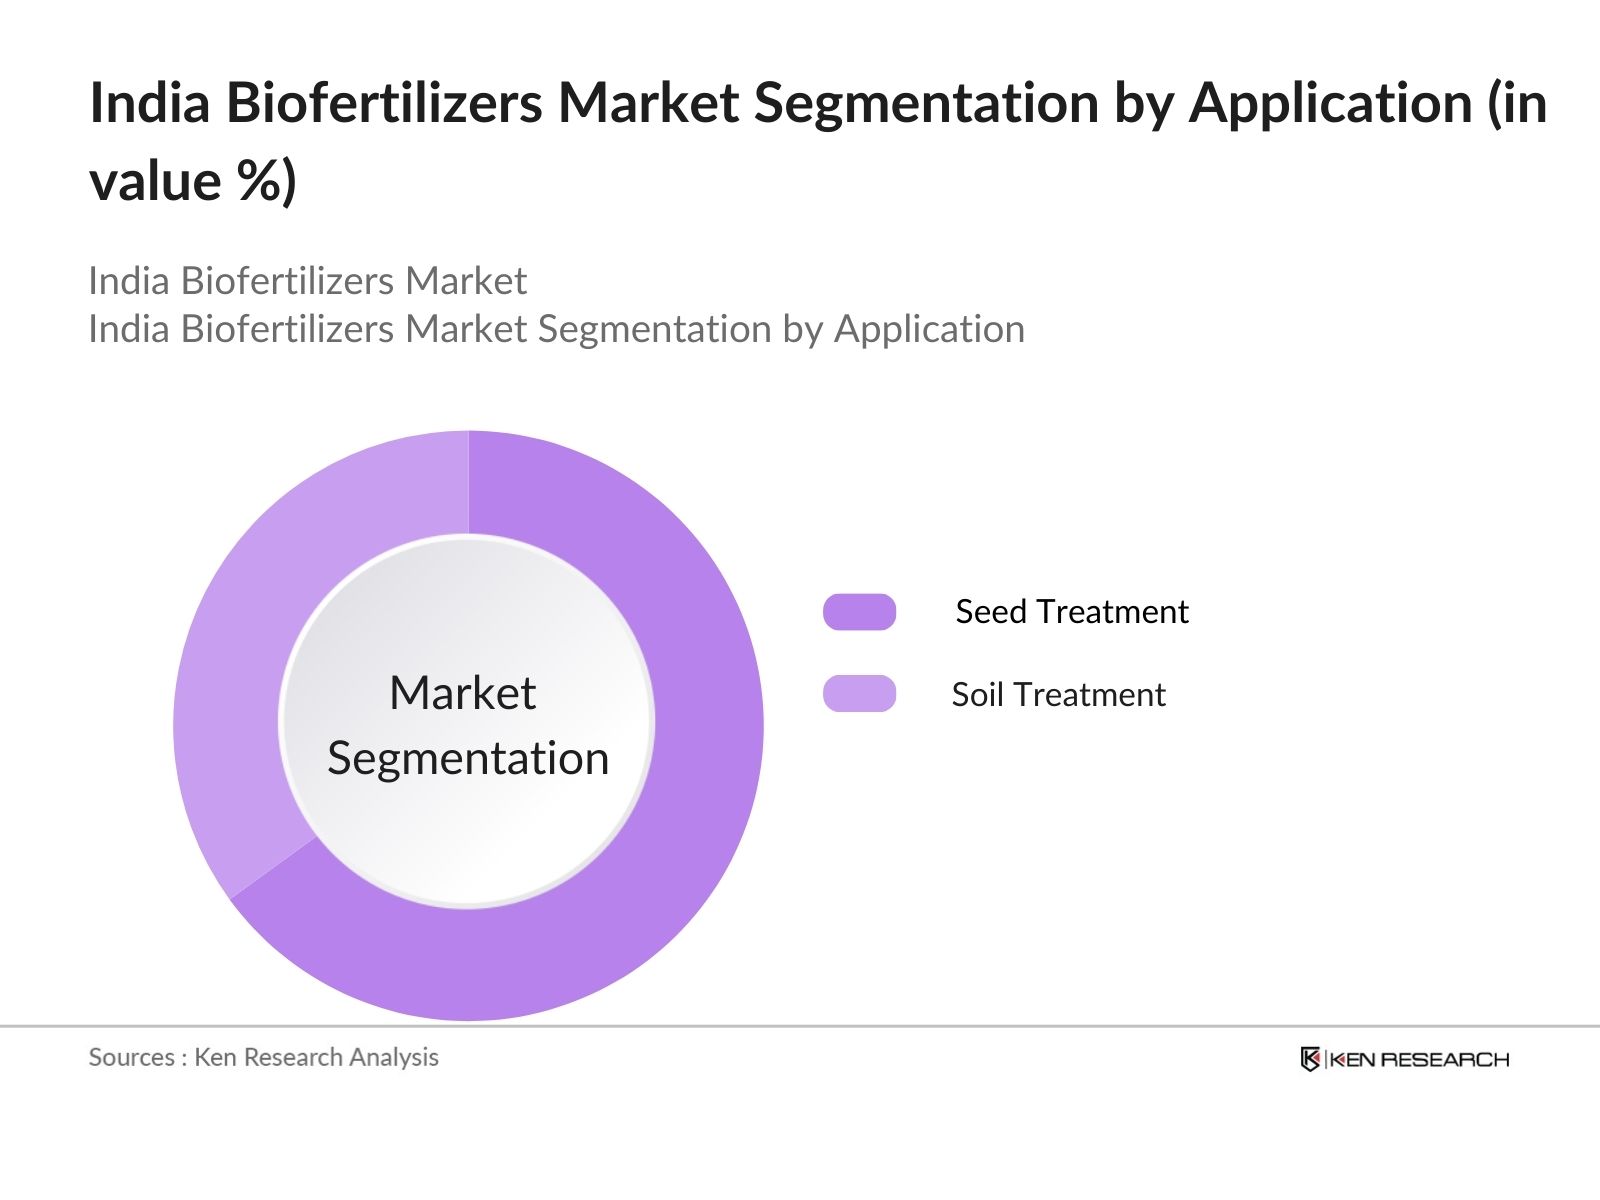
Seed Treatment
$%
Soil Application
$%
Root-Dip and Seedling Treatment
$%
Drip and Fertigation
$%
Planting-Material and Foliar Treatment
$%

Distribution Channel

Agri-Input Dealers
$%
Cooperative and Institutional Distribution
$%
Direct-to-Farm Sales
$%
Digital Agri-Commerce
$%
Government Tenders
$%

Farm Size

Marginal Holdings
$%
Small Holdings
$%
Semi-Medium Holdings
$%
Medium Holdings
$%
Large Holdings
$%

Geography

South India
$%
West India
$%
North India
$%
East India
$%
Northeast India
$%

Key Segmentation Takeaways

Comprehensive analysis across all extracted segmentation dimensions providing insights into market structure, farmer preferences, agronomic applications, and distribution patterns.

Crop Type

Crop segmentation determines repeat demand, microbial compatibility, dose frequency, and distribution seasonality. Cereals and Millets represent the dominant Level-2 segment because rice, wheat, maize, and millet acreage creates a broad national customer base. Suppliers require crop-specific demonstrations and localized strain recommendations to convert this acreage into recurring commercial demand.

Application

Application is the fastest-growing segmentation dimension because liquid inoculants are increasingly integrated with drip irrigation, fertigation, commercial nurseries, and seed-treatment programmes. Drip and Fertigation is the fastest-growing Level-2 segment, supported by precise dosing, reduced field labor, controlled root-zone delivery, and stronger adoption among horticulture, plantation, and protected-cultivation operators.

CHAPTER 7 - Regional Analysis

Regional Analysis

India ranks third among selected agricultural biofertilizer peer markets by estimated 2025 value, behind China and Brazil but ahead of Spain and Italy. Its strategic advantage comes from a large cultivated base, extensive smallholder demand, growing organic certification, and policy-backed biological input infrastructure.

Focus Country Ranking

3rd

Focus Country Market Size

USD 153 Mn (2025)

Focus Country CAGR (2026-2031)

8.81%

Regional Analysis (Current Year)

Regional Analysis Comparison

MetricChinaBrazilIndiaSpainItaly
Market Size, 2025 (USD Mn)56915515310080
CAGR, 2026-2031 (%)10.41%9.35%8.81%8.20%7.80%
Arable Land (Mn ha)118.963.9156.123.96.6
Organic Farmland (Mn ha)2.91.34.53.02.5

Market Position

India's USD 153 million market ranks third among the peer set, supported by approximately 156.1 million hectares of arable land and extensive cereal, pulse, oilseed, and horticulture cultivation.

Growth Advantage

India's 8.81% CAGR trails China at 10.41% and Brazil at 9.35%, but exceeds Spain and Italy as policy-led distribution and liquid formulations improve commercial penetration.

Competitive Strengths

India combines 4.5 million hectares of certified organic farm area, 10,000 planned Bio-input Resource Centres, and a large domestic microbial manufacturing base that supports localized product development.

CHAPTER 8 - INDUSTRY ANALYSIS

Growth Drivers, Challenges & Opportunities

Comprehensive analysis of key factors shaping the India Biofertilizer Market, including growth catalysts, operational challenges, and emerging opportunities across production, distribution, and farmer segments.

Growth Drivers

Policy-Backed Reduction in Chemical Fertilizer Dependence

  • 15.14 lakh metric tonnes of chemical fertilizer reduction (FY2023-24, India) across 14 qualifying states creates procurement headroom for biofertilizers, soil testing, and balanced nutrient-management programmes.
  • Rs 1,500 per metric tonne of Market Development Assistance (2024, India) for specified organic fertilizers strengthens the surrounding biological-input ecosystem and dealer willingness to stock alternative nutrient products.
  • 151 kilograms per hectare of fertilizer nutrient use (FY2024-25, India) indicates significant scope for integrated programmes that improve nutrient-use efficiency without requiring immediate elimination of mineral inputs.

Expansion of Organic and Natural Farming Infrastructure

  • 15,000 natural farming clusters covering 0.75 million hectares (programme target, India) create concentrated demonstration zones where validated microbial products can be distributed with agronomic training.
  • Approximately 1.5 million hectares under PKVY by February 2025 (India) provides a scheme-backed customer pool for certified biofertilizer manufacturers and cooperative distributors.
  • 4.5 million hectares of certified organic farm area (FY2023-24, India) supports premium horticulture, plantation, spice, and export-crop demand for biological nutrient products.

Large and Nutrient-Intensive Agricultural Production Base

  • 362.08 million tonnes of horticultural output (FY2024-25, India) expands the addressable market for high-value fertigation, nursery, orchard, and root-zone microbial products.
  • 146.45 million operational agricultural holdings (2015-16 census, India) create a large recurring customer base, although products require low pack prices and dense last-mile distribution.
  • 20-30% potential yield improvement in recommended applications (TNAU guidance, India) strengthens farmer return-on-investment communication when claims are supported by crop-specific local demonstrations.

Market Challenges

Variable Product Quality and Field Performance

  • More than 360,000 combined tonnes and kilolitres of reported output (2023-24, India) increase the inspection burden across numerous state-level plants and product formats.
  • Multiple organism-specific standards under the FCO (2023, India) require separate strain identification, microbial count, pH, moisture, contamination, and shelf-life controls, raising laboratory and compliance costs.
  • Higher shelf-life liquid technologies developed by ICAR (2025, India) address part of the problem, but manufacturers must still protect viable counts during heat exposure, storage, and rural transport.

Fragmented Farm Holdings and High Last-Mile Costs

  • 100.25 million marginal holdings (2015-16, India) require affordable package sizes and low working-capital exposure, limiting the viability of premium products without aggregation through FPOs or cooperatives.
  • 25.81 million small holdings (2015-16, India) create dispersed demand that raises dealer servicing, demonstration, and product-return costs for manufacturers.
  • Five regional NCONF centres supporting national coverage (2023-24, India) illustrate the geographic scale of training and quality-control requirements across diverse agro-climatic zones.

Price Distortion from Mineral Fertilizer Subsidies

  • 32.93 million tonnes of nutrient consumption (FY2024-25, India) confirms that chemical fertilizers remain embedded in crop-production economics and dealer working-capital cycles.
  • 25% potential substitution of chemical nitrogen and phosphorus in recommended use cases (TNAU guidance, India) is meaningful but reinforces that biofertilizers are typically complementary inputs rather than universal substitutes.
  • 50% state share of verified subsidy savings under PM-PRANAM (2024, India) improves policy alignment, but commercial demand depends on states converting incentives into extension, procurement, and farmer adoption.

Market Opportunities

Liquid and Multi-Strain Crop-Specific Formulations

  • 106,494.001 kilolitres of liquid production (2023-24, India) demonstrates established industrial scale and supports investment in fermentation, stabilization, and automated filling capacity.
  • Two or more microbial strains in ICAR-developed consortia (2025, India) enable suppliers to increase revenue per acre through bundled nutrient-mobilization propositions.
  • 66% projected liquid-formulation share by 2031 (India) requires stronger strain libraries, quality systems, temperature-stability testing, and crop-specific efficacy data to support premium realization.

FPO and Bio-input Resource Centre Distribution

  • 9,268 farmer producer organizations promoted by early 2025 (India) provide aggregated procurement pools that reduce customer-acquisition and last-mile transaction costs.
  • 18.75 lakh farmers targeted through natural-farming clusters (programme target, India) create demand for demonstration kits, local inoculant production, agronomy services, and quality-assured replenishment.
  • 10 million farmers targeted for natural-farming awareness (2024-26, India) requires manufacturers to build standardized training, traceability, retailer certification, and district-level technical support.

High-Value Horticulture and Organic Export Crops

  • USD 708.33 million of organic exports (FY2022-23, India) supports residue-conscious input programmes for spices, tea, coffee, fruits, processed foods, cereals, and oilseeds.
  • 312,800.51 metric tonnes of organic exports (FY2022-23, India) create monetizable opportunities for traceable microbial inputs aligned with certification and buyer specifications.
  • 4.5 million hectares of certified organic farm area (FY2023-24, India) benefits suppliers offering documented strains, compatible application protocols, and agronomy support for premium crops.

CHAPTER 9 - Competitive Landscape

Competitive Landscape Overview

The market combines large fertilizer and crop-protection groups with specialized microbial manufacturers. Competition centers on strain efficacy, FCO compliance, liquid capacity, agronomic support, distribution depth, and farmer trust.

Market Share Distribution

Indian Farmers Fertiliser Cooperative Limited
IPL Biologicals Limited
UPL Limited
Rallis India Limited

Top 5 Players

1
Indian Farmers Fertiliser Cooperative Limited
!$*
2
IPL Biologicals Limited
^&
3
UPL Limited
#@
4
Rallis India Limited
$
5
T. Stanes and Company Limited
&@$
Combined Share$%

Market Dynamics

Local Players70%
Regional/Int'l30%

8 new entrants in the past 5 years, indicating strong market attractiveness and growth potential.

Company Profiles (Top 10 Players)
Company Name
Market Share
Headquarters
Founding Year
Core Market Focus
Indian Farmers Fertiliser Cooperative Limited
-New Delhi, India1967Nitrogen-fixing, phosphate-solubilizing, potassium-mobilizing, zinc-solubilizing, and consortia biofertilizers
IPL Biologicals Limited
-Gurugram, India1994Microbial biologicals, biofertilizers, biocontrol products, and crop-specific biological programmes
UPL Limited
-Mumbai, India1969Agricultural biosolutions, biological crop nutrition, and integrated crop-management portfolios
Rallis India Limited
-Mumbai, India1948Soil and plant-health solutions, microbial inputs, seed treatment, and crop nutrition
T. Stanes and Company Limited
-Coimbatore, India1861Biofertilizers, biopesticides, organic crop inputs, and plantation-focused biological solutions
Multiplex Group
-Bengaluru, India1974Liquid and carrier biofertilizers, micronutrients, biocontrol, and specialty crop nutrition
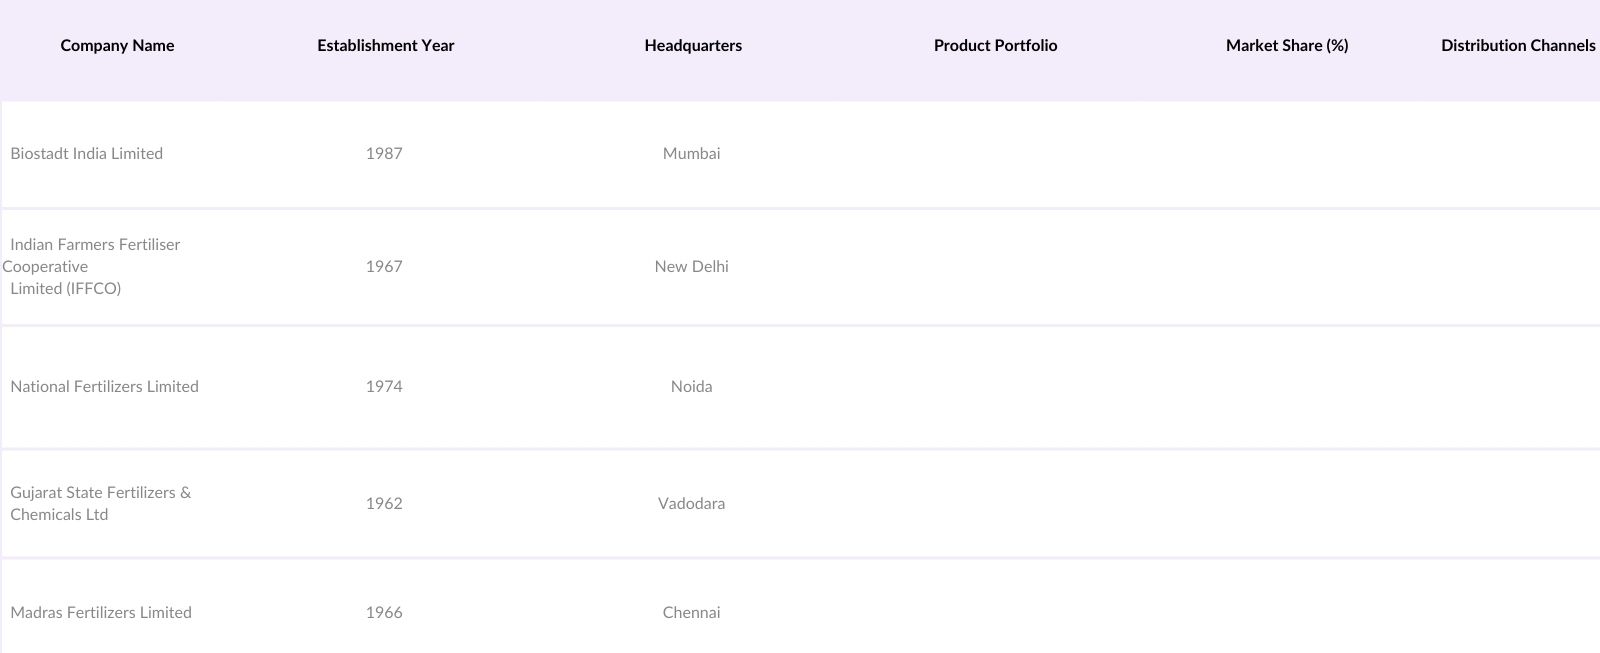
Gujarat State Fertilizers and Chemicals Limited
-Vadodara, India1962Biofertilizers, organic inputs, conventional fertilizers, and institutional agricultural distribution
Kan Biosys Private Limited
-Pune, India-Microbial biofertilizers, soil-health products, plant-growth-promoting organisms, and agronomy programmes
Biostadt India Limited
-Mumbai, India-Biological crop nutrition, plant-health products, specialty inputs, and farmer advisory solutions
Madras Fertilizers Limited
-Chennai, India1966Biofertilizers, conventional fertilizers, and agricultural nutrient products

Cross Comparison Parameters

The report provides detailed cross-comparison of key players across 10 performance parameters to identify competitive strengths and weaknesses.

1

Viable Cell Count Compliance

2

Liquid Formulation Capacity

3

Biofertilizer Revenue Growth

4

Gross Margin on Biological Inputs

Analysis Covered

Market Share Analysis:

Compares in-scope revenue positioning across national and regional supplier tiers.

Cross Comparison Matrix:

Benchmarks formulation capacity, compliance, growth, and margins across selected companies.

SWOT Analysis:

Evaluates strategic strengths, vulnerabilities, opportunities, and competitive threats by player.

Pricing Strategy Analysis:

Assesses pack-price architecture, channel discounts, and crop-specific value positioning choices.

Company Profiles:

Profiles ownership, product portfolios, geographic reach, capabilities, and strategic priorities.

CHAPTER 10 - REPORT TOC

Table of Contents

81Pages
34Chapters
10Companies Profiled
7Segmentation Types

Phase 1
Market Assessment Phase

11

Chapters

Supply-side and competitive intelligence covering market sizing, segmentation, competitive dynamics, regulatory landscape, and future forecasts.

Phase 2
Go-To-Market Strategy Phase

15

Chapters

Entry strategy evaluation, execution roadmap, partner recommendations, and profitability outlook.

Complete Report Coverage

201+ detailed sections covering every aspect of the market

143

Assessment Sections

58

Strategy Sections

CHAPTER 11 - Our Approach

Research Methodology

Desk Research

  • Reviewed FCO biofertilizer product standards
  • Mapped state production and capacity
  • Analyzed crop acreage and output
  • Reviewed company biological input portfolios

Primary Research

  • Interviewed microbial formulation production heads
  • Consulted agricultural input distribution managers
  • Engaged soil microbiology research directors
  • Interviewed FPO and plantation agronomists

Validation and Triangulation

  • Reconciled findings across 430 respondents
  • Validated viable-count compliance benchmarks
  • Cross-checked production and treated acreage
  • Tested dealer pricing and margins

CHAPTER 12 - FAQ

FAQs

Still have questions?

Our research team is here to help you find the right solution

Contact Research Team

CHAPTER 13 - Related Research

Explore Related Reports

Expand your market intelligence with complementary research across regions and adjacent markets.

Regional/Country Reports

Related market analysis across key regions

  • Indonesia Biofertilizer Market Size, Share & Forecast, By Product Type, Crop Type & Application, 2026-2031
  • Vietnam Biofertilizer Market Size, Share & Forecast, By Product Type, Crop Type & Application, 2026-2031
  • Thailand Biofertilizer Market Size, Share & Forecast, By Product Type, Crop Type & Application, 2026-2031
  • Malaysia Biofertilizer Market Size, Share & Forecast, By Product Type, Crop Type & Application, 2026-2031
  • Philippines Biofertilizer Market Size, Share & Forecast, By Product Type, Crop Type & Application, 2026-2031

500+

Market Research Reports

50+

Countries Covered

15+

Industry Verticals

Want the full report and an analyst walkthrough?

Unlock the complete dataset, segmentation cuts, and competitive analysis—plus a discovery call that maps insights to your go-to-market priorities.

;