CHAPTER 1 - MARKET SUMMARY
Market Overview
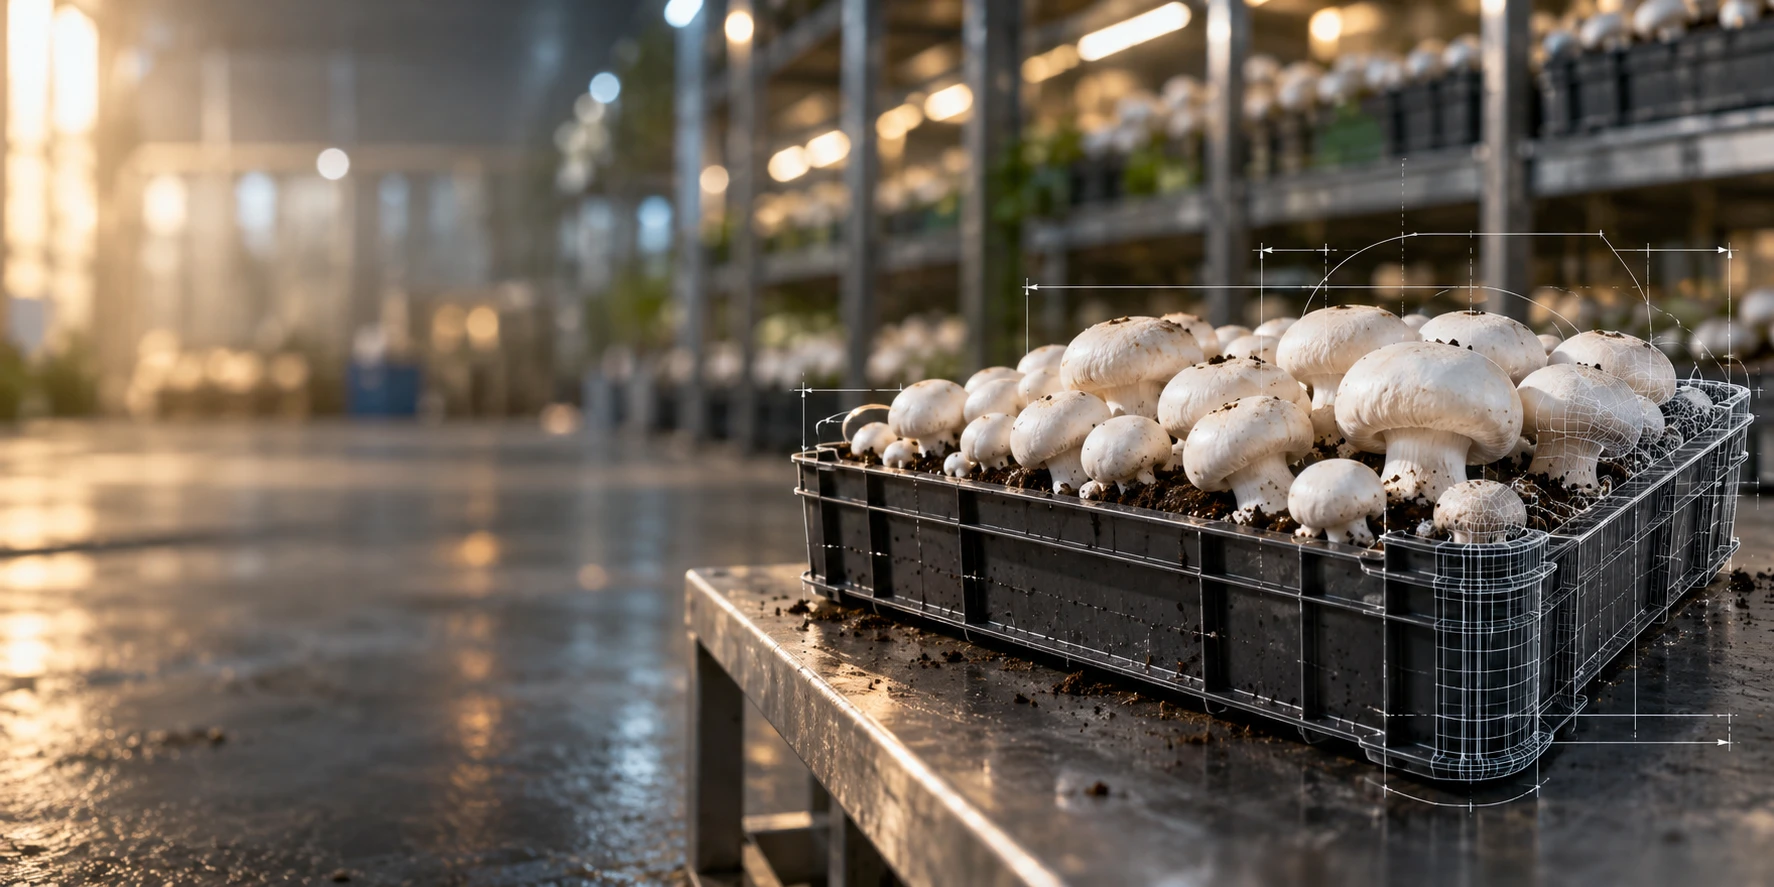
The India Mushroom Market operates as a fragmented agricultural value chain in which small growers sell fresh output through local wholesalers while larger processors monetize dried, canned and individually quick-frozen formats. Implied national consumption reached approximately 0.25 kg per person in 2025, with commercial demand concentrated among urban households, hotels, restaurants, caterers and food processors.
Production remains geographically dispersed, but Bihar, Odisha, Haryana, Punjab, Himachal Pradesh and Uttar Pradesh form important cultivation clusters. National output reached an estimated 433,862 MT in 2025, compared with 155,000 MT in FY2019-20. Northern states benefit from organized button-mushroom infrastructure, while eastern states increasingly use self-help-group cultivation models for oyster and milky mushrooms.
Market Value
USD 533 million
2025
Dominant Region
North India
2025
Dominant Segment
Fresh Mushrooms
fastest growing value pool: processed and functional forms
Total Number of Players
Approximately 212,000 growing units
Future Outlook
The India Mushroom Market is forecast to increase from USD 533 million in 2025 to USD 1,063 million by 2032, representing a 10.4% CAGR. The trajectory builds on a 22.8% historical CAGR during 2020-2025, when official production expanded rapidly from a low base. Forecast growth moderates as cultivation capacity normalizes, but value continues to outpace physical volume because refrigerated distribution, branded packs and processed products improve blended first-sale realization.
Volume is projected to rise from 433,862 MT in 2025 to approximately 695,000 MT by 2032. Fresh mushrooms will remain the principal revenue pool, while dried, canned, frozen and functional formats capture incremental margin. The base case assumes continuing subsidy support, wider quick-commerce distribution and gradual cold-chain expansion. The principal downside risk is persistent spoilage outside organized clusters; the upside case depends on functional varieties and processed formats becoming commercially scalable beyond major metropolitan markets.
10.4%
Forecast CAGR
$1,063 Mn
2030 Projection
Base Year
2025
Historical Period
2020-2025
Forecast Period
2025-2032
Historical CAGR
22.8%
CHAPTER 2 - SCOPE OF REPORT
Scope of the Market
CHAPTER 3 - Key Stakeholders
Key Target Audience
Key stakeholders who can leverage from this market analysis for investment, strategy, and operational planning.
Investors
CAGR, processing margins, capex intensity, spoilage risk
Corporates
procurement cost, quality consistency, supply continuity, realization
Government
grower income, subsidy efficiency, cold-chain coverage, exports
Operators
yield, contamination, refrigeration, packaging, route density
Financial institutions
project finance, seasonality, collateral, demand stability
CHAPTER 4 - Market Size & Growth
Market Size, Growth Forecast and Trends
This section evaluates the historical market size, analyzes year-over-year growth dynamics, and presents forecast projections supported by market performance indicators and demand-side drivers.
Historical & Projected Market Size ($ Million)
Year-over-Year Growth Rate (%)
Market Value vs Volume Growth (%)
Historical Market Performance (2020-2025)
Historical value increased from USD 191 million in 2020 to USD 533 million in 2025. The sharpest inflection occurred in 2024 as official production approached 399,000 MT, compared with 351,100 MT in FY2023-24. Higher recorded output, price normalization and improved capture of fragmented grower revenue widened the measured market. The 2020-2025 value CAGR was 22.8%, although the terminal years include formalization and estimation improvements in addition to underlying demand growth.
Forecast Market Outlook (2025-2032)
Market value is forecast to reach USD 1,063 million by 2032, implying a 10.4% CAGR from 2025. Growth is expected to moderate from 12.2% in 2026 to 9.2% in 2032 as the production base expands. Value growth remains above volume growth because the blended ASP increases through processed-product penetration, improved refrigerated handling and higher institutional demand. The forecast assumes no structural export shock and continued domestic consumption dominance.
CHAPTER 5 - Market Data
Market Breakdown
The India Mushroom Market combines rapid agricultural capacity creation with gradual value-chain formalization. Investors should distinguish physical production growth from the stronger revenue effect generated by better cold-chain access, processed formats and premium species.
Year | Market Size (USD Mn) | YoY Growth (%) | Production Volume (MT) | Blended ASP (USD/kg) | Processed Value Share (%) | Period |
|---|---|---|---|---|---|---|
| 2020 | $191 Mn | +- | 155,000 | 1.23 | Forecast | |
| 2021 | $207 Mn | +8.4% | 165,850 | 1.25 | Forecast | |
| 2022 | $232 Mn | +12.1% | 181,606 | 1.28 | Forecast | |
| 2023 | $258 Mn | +11.2% | 197,587 | 1.31 | Forecast | |
| 2024 | $416 Mn | +61.2% | 398,770 | 1.04 | Forecast | |
| 2025 | $533 Mn | +28.1% | 433,862 | 1.23 | Forecast | |
| 2026 | $598 Mn | +12.2% | 469,439 | 1.27 | Forecast | |
| 2027 | $667 Mn | +11.5% | 506,055 | 1.32 | Forecast | |
| 2028 | $739 Mn | +10.8% | 542,997 | 1.36 | Forecast | |
| 2029 | $813 Mn | +10.0% | 579,921 | 1.40 | Forecast | |
| 2030 | $891 Mn | +9.6% | 617,036 | 1.44 | Forecast | |
| 2031 | $973 Mn | +9.2% | 655,292 | 1.49 | Forecast | |
| 2032 | $1,063 Mn | +9.2% | 694,610 | 1.53 | Forecast |
Production Volume
433,862 MT, 2025, India. The expanding supply base improves procurement depth but raises spoilage exposure where refrigerated handling is absent. Official FY2024-25 production was reported at approximately 398,770 MT.
Blended ASP
USD 1.23/kg, 2025, India. Price realization is more sensitive than physical output to format and channel mix. Published wholesale and farm-level references indicate wide price dispersion across species, seasons and locations.
Processed Value Share
22%, 2025, India. Processed products generate disproportionate value relative to their estimated volume contribution. India exported 343,990 kg of dried mushrooms and truffles in 2023, demonstrating a small but measurable processing channel.
CHAPTER 6 - Segmentation
Market Segmentation Framework
Comprehensive analysis across key dimensions providing insights into market structure, consumer preferences, and distribution patterns.
No of Segments
7
Dominant Segment
Form
Fastest Growing Segment
Product Type
Product Type
Form
Customer Type
Application
Distribution Channel
Farm Size
Geography
Key Segmentation Takeaways
Comprehensive analysis across all extracted segmentation dimensions providing insights into market structure, consumer preferences, and distribution patterns.
Form
Fresh mushrooms remain the dominant commercial format because most domestic output enters local wholesale and foodservice channels soon after harvest. Retail-packed fresh products improve realization in metropolitan markets, while dried, canned and frozen formats remain smaller but reduce perishability and extend geographic reach.
Product Type
Specialty mushrooms represent the fastest-growing product pool as urban consumers, chefs and supplement brands experiment with shiitake, lion's mane, reishi and cordyceps. Commercial scalability depends on controlled-environment cultivation, strain quality, technical expertise and verified functional-product claims.
CHAPTER 7 - Regional Analysis
Regional Analysis
India ranks first among selected South Asian mushroom markets by cultivated output and commercial value. Its scale reflects a large domestic consumer base, expanding state-supported grower network and diversified climatic zones, although per-capita consumption remains low relative to mature East Asian markets.
Peer-Country Ranking
1st
India Market Size (2025)
USD 533 Mn
India CAGR (2025-2032)
10.4%
Peer-Country Ranking
1st
India Market Size (2025)
USD 533 Mn
India CAGR (2025-2032)
10.4%
Regional Analysis (Current Year)
Regional Analysis Comparison
| Metric | India | Bangladesh | Nepal | Sri Lanka | Pakistan |
|---|---|---|---|---|---|
| Market Size | USD 533 Mn | - | - | - | - |
| CAGR (%) | 10.4% | - | - | - | - |
Market Position
India ranks first in the selected peer group, supported by approximately 433,862 MT of estimated 2025 output and a diversified cultivation base spanning temperate and tropical varieties.
Growth Advantage
India's 10.4% forecast value CAGR reflects formalization, improved ASP and processing expansion. Comparable public market estimates for neighboring countries remain limited, preventing defensible point-CAGR comparisons. kenresearch.com
Competitive Strengths
India combines a 1.46 billion population base, multiple production climates and credit-linked assistance covering up to 50% of eligible integrated-unit costs, supporting decentralized capacity formation.
CHAPTER 8 - INDUSTRY ANALYSIS
Growth Drivers, Challenges & Opportunities
Comprehensive analysis of key factors shaping the India Mushroom Market, including growth catalysts, operational challenges, and emerging opportunities across production, distribution, and consumer segments.
Growth Drivers
Subsidized Cultivation Capacity
- Capital assistance with an indicative INR 10 lakh ceiling (2024, India) improves project economics for spawn, compost and growing-room investments, benefiting small growers and rural entrepreneurs.
- Bihar's hut-production scheme offers 50% setup-cost support (2025, Bihar), allowing decentralized capacity additions where self-help groups can aggregate training, inputs and market access.
- National production increased from 155,000 MT in FY2019-20 to 398,770 MT in FY2024-25 (India), showing how capacity creation can materially widen domestic supply.
Urban Nutrition and Foodservice Demand
- India's 1.46 billion population base (2025, India) creates a large addressable pool even when regular mushroom buyers remain a minority of households.
- An estimated 35% urban population share (2025, India) concentrates customers near organized grocery, restaurant and quick-commerce infrastructure, improving repeat purchase economics.
- Demand-side consumption of 368,650 MT (2025, India) indicates a broad domestic market while also exposing the commercial cost of produce lost before final sale.
Cold-Chain and Digital Distribution Expansion
- A blended ASP increase from USD 1.23/kg in 2025 to USD 1.53/kg in 2032 (India) supports revenue growth beyond farm output expansion.
- Quick-commerce platforms carrying fresh mushroom SKUs reduce discovery friction and enable smaller packs, supporting better pricing in metropolitan catchments.
- Retail references of approximately INR 270/kg in Bengaluru (2026, India) illustrate the margin available between farm-level realization and organized retail pricing.
Market Challenges
Post-Harvest Loss and Cold-Chain Gaps
- Production-based volume of 433,862 MT (2025, India) exceeds demand-side realized volume of 368,650 MT, limiting monetization despite strong physical output.
- Fresh mushrooms can deteriorate rapidly without refrigeration, compressing selling windows and strengthening wholesale intermediaries' bargaining power.
- Cold-chain scarcity outside organized northern button-mushroom clusters discourages distant-market sales and raises the risk of rejected loads for small growers.
Fragmented and Informal Supply
- Seven named organized companies represent only about 2.5% of estimated market value (2025, India), indicating an unusually dispersed competitive structure.
- Four listed mushroom-linked companies generated less than INR 325 crore in combined company revenue (FY2025-26, India), and only part is mushroom-specific.
- Fragmentation weakens traceability, consistent grading and contract reliability, requiring aggregators to invest in extension services and supplier quality systems.
Price and Species Volatility
- Reported button-mushroom mandi prices of INR 150-180/kg (June 2026, India) exceed several farm-level references, showing location and channel dispersion.
- A seasonal grower break-even reference of INR 85/kg (2024, India) demonstrates how quickly profitability can erode during supply gluts.
- Premium functional varieties can command extreme prices, but limited standardized demand makes scale-up riskier than conventional fresh cultivation.
Market Opportunities
Processed Mushroom Capacity
- Dried, canned and IQF products extend shelf life and can monetize off-grade fresh output, improving plant utilization and reducing disposal losses.
- Processors, cold-chain operators and institutional distributors benefit from a forecast increase in processed value share to 29% by 2032 (India).
- Scalable opportunity requires standardized raw-material contracts, residue testing, moisture specifications and audited processor-level realized-price data.
Functional and Gourmet Varieties
- Controlled-environment producers can capture higher margins by selling verified dried biomass, powders and extracts to nutraceutical brands.
- Specialty retailers, chefs and supplement manufacturers benefit from domestic shiitake, lion's mane, reishi and cordyceps supply that reduces import dependence.
- Commercial scaling requires validated strains, contamination control, laboratory testing and compliant health claims rather than commodity-farm practices.
Organized Aggregation and Direct Procurement
- Digital procurement platforms can monetize grading, logistics and working-capital services while consolidating fragmented supply for foodservice buyers.
- Growers gain more predictable offtake, while restaurants and processors gain consistent specifications and reduced procurement complexity.
- The model requires route density, refrigerated collection points, transparent price discovery and enforceable quality-based payment mechanisms.
CHAPTER 9 - Competitive Landscape
Competitive Landscape Overview
The market is highly fragmented, with organized processors representing a small share of value and competition centered on farm aggregation, quality consistency, processing capability and access to refrigerated distribution.
Market Share Distribution
Top 5 Players
Market Dynamics
8 new entrants in the past 5 years, indicating strong market attractiveness and growth potential.
Company Name | Market Share | Headquarters | Founding Year | Core Market Focus |
|---|---|---|---|---|
Flex Foods Limited | - | Noida, India | 1990 | Freeze-dried and air-dried mushrooms and food ingredients |
Saptarishi Agro Industries Limited | - | Chennai, India | 1992 | Cultivated and processed mushrooms |
Himalaya Food International Limited | - | New Delhi, India | 1992 | Mushroom cultivation and frozen food processing |
Agro Dutch Industries Limited | - | Chandigarh, India | 1992 | Preserved button mushrooms |
Weikfield Foods Private Limited | - | Pune, India | 1956 | Packaged and processed mushrooms |
Biobritte Agro Solutions Private Limited | - | Pune, India | - | Specialty mushroom cultivation and exports |
Nuvedo Labs Private Limited | - | Bengaluru, India | - | Functional mushroom products and cultivation supplies |
Eco Pesticides Private Limited | - | - | - | Mushroom cultivation and agricultural products |
Kirti Agrovet Limited | - | - | - | Mushroom growing and processing |
Mushroom World Group | - | - | - | Spawn, cultivation support and mushroom products |
Cross Comparison Parameters
The report provides detailed cross-comparison of key players across 10 performance parameters to identify competitive strengths and weaknesses.
Cultivation and Processing Capacity
Cold-Chain and Quality Control Capability
Mushroom-Specific Revenue Growth
Realized Revenue per Kilogram
Analysis Covered
Market Share Analysis:
Compares organized processors against fragmented regional and informal grower supply.
Cross Comparison Matrix:
Benchmarks capacity, quality systems, realization and revenue growth performance.
SWOT Analysis:
Evaluates sourcing strengths, processing gaps, opportunities and operating risks.
Pricing Strategy Analysis:
Compares farm-gate, wholesale, institutional and processed-product realization models.
Company Profiles:
Reviews market focus, operational footprint, products and strategic positioning.
CHAPTER 10 - REPORT TOC
Market Report Structure
Comprehensive coverage across three strategic phases, Market Assessment, Go-To-Market Strategy, and Survey, delivering end-to-end insights from market analysis and execution roadmap to customer demand validation.
Market Assessment Phase
Supply-side and competitive intelligence covering market sizing, segmentation, competitive dynamics, regulatory landscape, and future forecasts.
Go-To-Market Strategy Phase
15 chapters
Entry strategy evaluation, execution roadmap, partner recommendations, and profitability outlook.
Survey Phase
8 chapters
Demand-side primary research conducted through structured interviews and online surveys with end users across priority metros and Tier 2/3 cities to capture consumption behavior, unmet needs, and purchase drivers.
Complete Report Coverage
201+ detailed sections covering every aspect of the market
143
Assessment Sections
58
Strategy Sections
CHAPTER 11 - Our Approach
Research Methodology
Desk Research
- Reviewed national horticulture production estimates
- Mapped mushroom-specific company revenue disclosures
- Analyzed export volumes and destinations
- Benchmarked farm and wholesale prices
Primary Research
- Interviewed commercial mushroom farm owners
- Consulted spawn production technical managers
- Engaged foodservice procurement category heads
- Surveyed processors and cold-chain operators
Validation and Triangulation
- Validated findings across 272 respondents
- Reconciled production with realized consumption
- Cross-checked prices across sales channels
- Tested downside and upside scenarios
CHAPTER 12 - FAQ
FAQs
Still have questions?
Our research team is here to help you find the right solution
CHAPTER 13 - Related Research
Explore Related Reports
Expand your market intelligence with complementary research across regions and adjacent markets.
Regional/Country ReportsRelated market analysis across key regions
Related market analysis across key regions
No regional reports found.
Adjacent ReportsRelated markets and complementary research
Related markets and complementary research
No adjacent reports found.
500+
Market Research Reports
50+
Countries Covered
15+
Industry Verticals