


India Rare Earth Mines Market Outlook to 2030
Region:Asia
Author(s):Yogita Sahu
Product Code:KROD4384
October 2024
84
About the Report
India Rare Earth Mines Market Overview
- The India Rare Earth Mines Market is valued at USD 2900 metric tons, based on a five-year historical analysis. This market is driven by the increasing demand for rare earth elements (REEs) in a variety of sectors, including clean energy, electric vehicles (EVs), and high-tech electronics. The critical nature of REEs in defense and energy applications has led to a significant rise in exploration and extraction activities in India.
- India is home to reserves of rare earth minerals, with regions such as Odisha, Kerala, and Tamil Nadu leading the production due to their mineral-rich coastal zones. Moreover, the countrys strategic geographic position, combined with its rapidly growing demand for renewable energy technologies and defense applications, makes it a dominant player in the global rare earth supply chain.
- The Government of India, under Union Minister G. Kishan Reddy, has launched several initiatives to enhance mineral exploration. A notable measure includes a25% exploration incentivefor agencies focusing oncritical and strategic minerals, promoting self-reliance. Additionally, the National Mineral Exploration Trust (NMET) has funded393 projects, with122dedicated to critical minerals, reflecting a commitment to sustainable resource management and technological innovation in the mining sector.
India Rare Earth Mines Market Segmentation
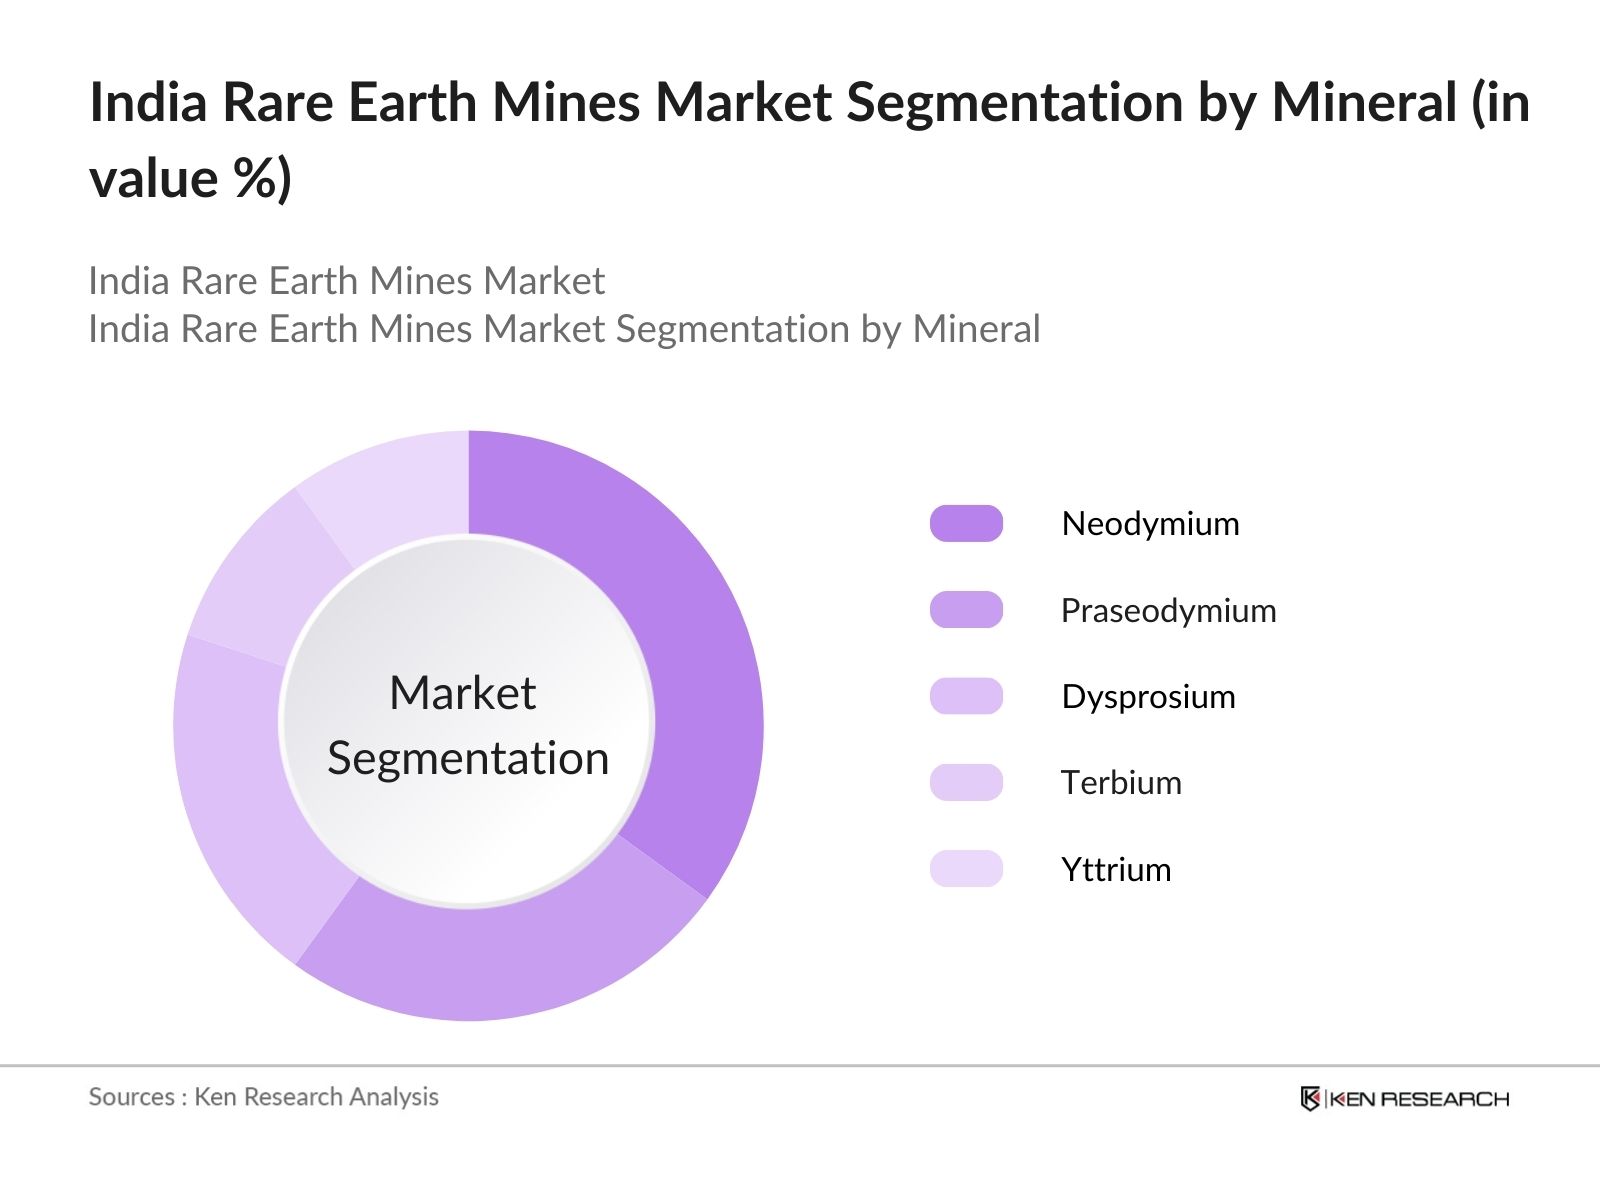
By Mineral Type: The market is segmented by mineral type into Neodymium, Praseodymium, Dysprosium, Terbium, and Yttrium. Neodymium has been dominating the market due to its critical role in producing permanent magnets used in electric vehicles and wind turbines. This mineral's strong demand in the automotive and renewable energy sectors, combined with its use in advanced technologies, has given it a dominant position.
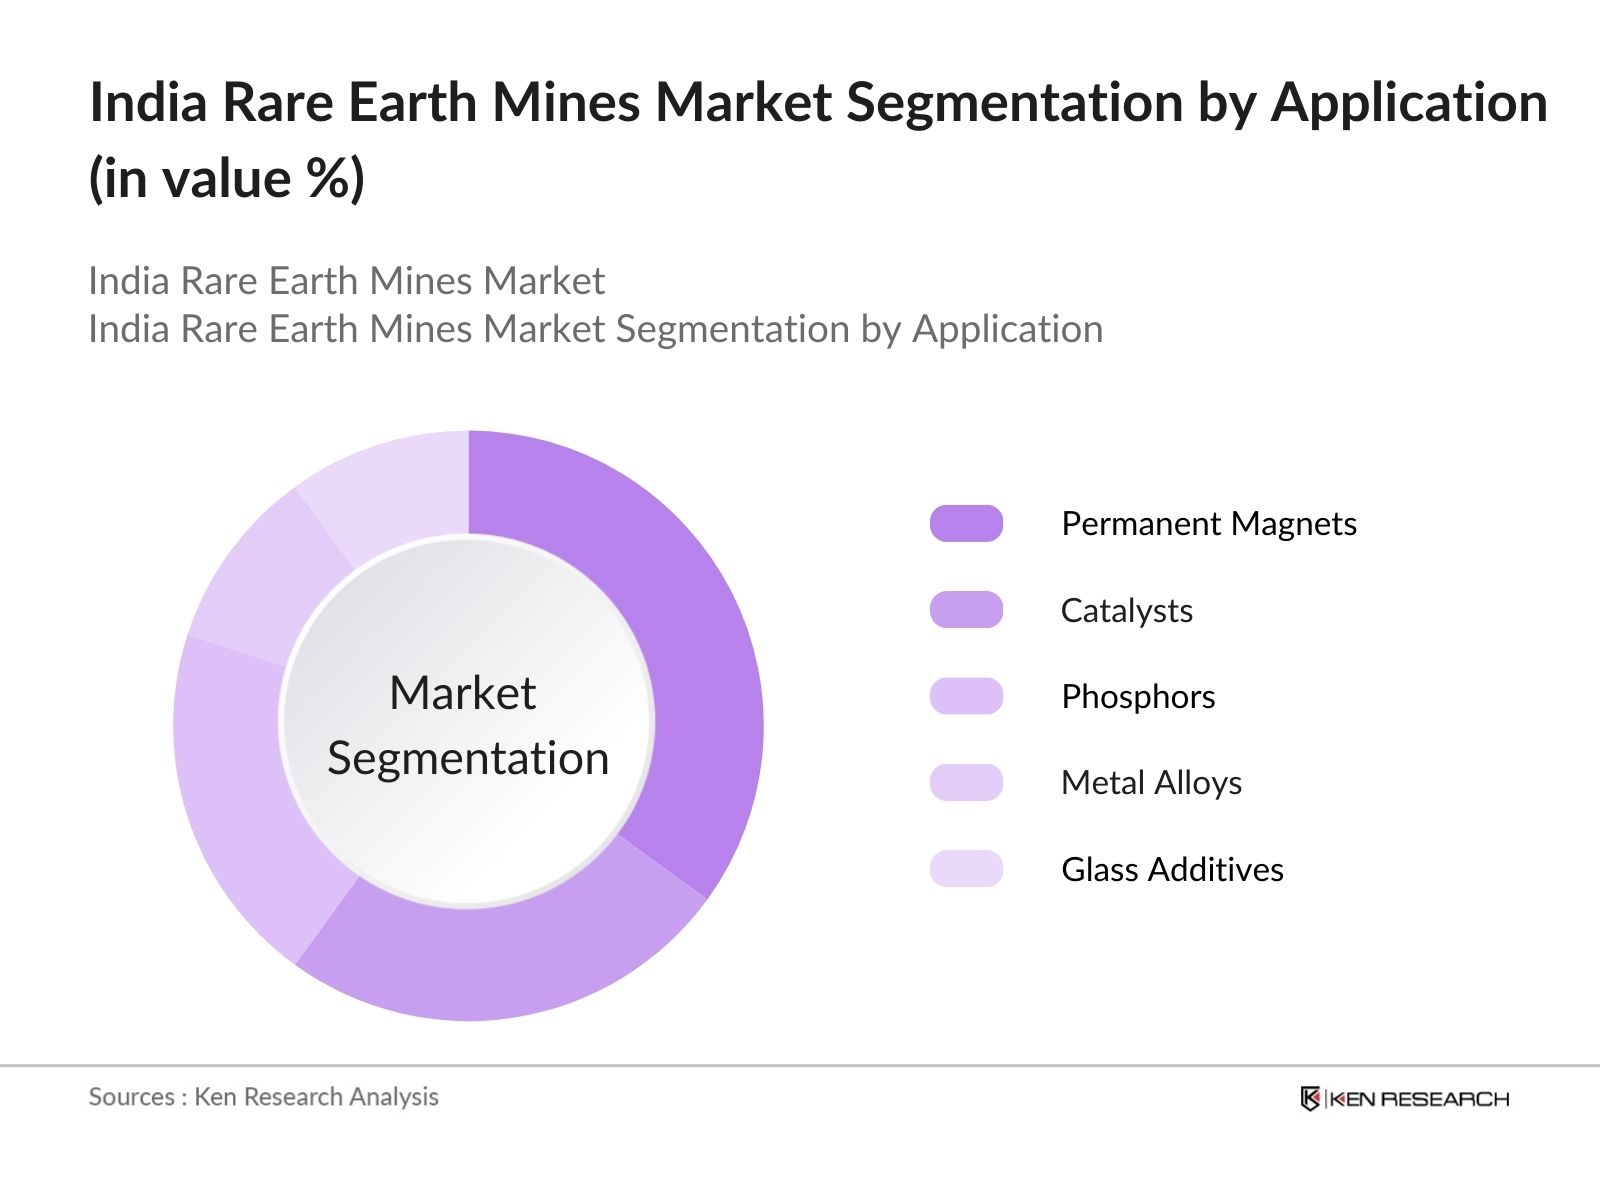
By Application: The market is further segmented by application into Permanent Magnets, Catalysts, Phosphors, Metal Alloys, and Glass Additives. Permanent Magnets hold a dominant market share in India due to their widespread use in electric motors, renewable energy systems, and electronics. The rapid adoption of electric vehicles in the country, coupled with the increasing need for wind energy solutions, is driving the demand for permanent magnets.
India Rare Earth Mines Market Competitive Landscape
The market is dominated by a mix of domestic and international players who hold influence over the market due to their strong resource base and advanced extraction technologies. The competitive landscape reflects the strategic importance of rare earth minerals, leading companies to forge alliances and secure long-term supply contracts.
|
Company Name |
Year of Establishment |
Headquarters |
Reserves (MT) |
Mining Capacity (MT/Year) |
Revenue (USD Bn) |
Employees |
Market Presence |
ESG Initiatives |
|
Indian Rare Earths Ltd. (IREL) |
1948 |
Mumbai, India |
||||||
|
Lynas Corporation Ltd. |
1983 |
Sydney, Australia |
||||||
|
MP Materials Corp. |
2017 |
Las Vegas, USA |
||||||
|
Arafura Resources Ltd. |
2006 |
Perth, Australia |
||||||
|
China Northern Rare Earth Group |
1997 |
Baotou, China |
India Rare Earth Mines Market Analysis
Market Growth Drivers
- Increased Demand for Electric Vehicles (EVs): The Indian government has been promoting electric mobility as a solution to pollution and energy security concerns. In 2024, India is expected to witness a rise in EV adoption, with over 4 million electric vehicles estimated to be on the roads, according to Indias Ministry of Heavy Industries. Rare earth elements like neodymium and dysprosium are essential in the production of electric motors, making their demand surge as EV manufacturing grows. This directly drives the expansion of Indias rare earth mining and refining industries to support the production of high-performance magnets for EVs.
- Rising Focus on Clean Energy Technologies: India is committed to scaling up its renewable energy capacity to 500 GW by 2030, with current installed capacity reaching over 170 GW in 2024. Rare earth elements like dysprosium and terbium are critical for wind turbines and solar panels. In response, India is expanding rare earth mining to supply the materials required for the production of renewable energy technologies. This push towards green energy solutions creates a demand for rare earth elements, solidifying their role in Indias sustainable development goals.
- Defense and Aerospace Sector Expansion: The Indian defense and aerospace sectors are increasingly adopting cutting-edge technologies that rely on rare earth elements for precision-guided weapons, radar systems, and aircraft engines. The governments focus on indigenization of defense production under the Make in India initiative saw investments of INR 900 billion into defense manufacturing in 2023. Rare earth elements such as yttrium and europium are essential in producing specialized components for defense applications, driving the domestic mining and processing sectors to meet the growing demand.
Market Challenges
- Environmental Concerns: Rare earth mining and refining processes are associated with environmental impacts, including soil degradation, water contamination, and radioactive waste. In 2023, India's Ministry of Environment, Forest, and Climate Change reported that nearly 45 mining operations were under scrutiny for violating environmental standards. These concerns have led to stricter regulatory requirements and higher costs for mining companies to comply with environmental protection laws, thereby challenging the rapid expansion of Indias rare earth sector.
- Lack of Advanced Refining Infrastructure: Indias rare earth processing capacity is limited due to outdated refining technologies and inadequate infrastructure. According to the Indian Bureau of Mines, only 25% of the mined rare earth elements were processed domestically in 2023, with the rest being sent overseas for refinement. This lack of advanced processing capabilities limits India's ability to capitalize fully on its rare earth reserves, and companies are now seeking technology transfers and collaborations to upgrade facilities.
India Rare Earth Mines Market Future Outlook
Over the next five years, the India Rare Earth Mines industry is expected to show growth, driven by continuous investments in mining infrastructure, advancements in separation technologies, and increasing demand from the defense and clean energy sectors. The Indian governments strong push toward reducing dependency on Chinese rare earth imports, coupled with strategic partnerships with global firms, will also contribute to the robust market growth.
Future Market Opportunities
- Collaborations with Global Tech Giants: India is expected to form strategic collaborations with global technology companies to boost its rare earth mining and processing capabilities. These collaborations will focus on advanced material science research and refining techniques, ensuring that India meets the increasing global demand for critical materials used in electronics, EVs, and defense technologies.
- Strategic Investments in Green Technologies: India will increase its investments in green technologies that rely on rare earth materials, such as wind turbines and electric vehicles. By 2028, the Ministry of New and Renewable Energy expects to install over 200 GW of renewable energy capacity, which will drive the demand for rare earth magnets used in wind turbines and solar inverters.
Scope of the Report
|
By Mineral Type |
Neodymium Praseodymium Dysprosium Terbium Yttrium |
|
By Application |
Permanent Magnets Catalysts Phosphors Metal Alloys Glass Additives |
|
By End-User Industry |
Automotive Electronics Energy & Renewable Energy Healthcare Aerospace & Defense |
|
By Region |
North East West South |
|
By Mining Method |
Open-Pit Mining Underground Mining In-Situ Leaching |
Products
Key Target Audience Organizations and Entities Who Can Benefit by Subscribing This Report:
Mining Companies
Rare Earth Element Producers
Government Agencies (Ministry of Mines, Geological Survey of India)
Automotive Manufacturers
Renewable Energy Companies
Electronics and Semiconductor Manufacturers
Defense and Aerospace Companies
Investment and Venture Capitalist Firms
Companies
Players Mentioned in the Report:
Indian Rare Earths Ltd. (IREL)
Lynas Corporation Ltd.
MP Materials Corp.
Arafura Resources Ltd.
China Northern Rare Earth Group
Iluka Resources Ltd.
Avalon Rare Metals Inc.
Greenland Minerals Ltd.
Texas Mineral Resources Corp.
Energy Fuels Inc.
Rare Element Resources Ltd.
Ucore Rare Metals Inc.
Canada Rare Earth Corporation
Rainbow Rare Earths Ltd.
Alkane Resources Ltd.
Table of Contents
1. India Rare Earth Mines Market Overview
1.1. Definition and Scope
1.2. Market Taxonomy
1.3. Market Growth Rate
1.4. Market Segmentation Overview
2. India Rare Earth Mines Market Size (In Metric Tons)
2.1. Historical Market Size
2.2. Year-On-Year Growth Analysis
2.3. Key Market Developments and Milestones
3. India Rare Earth Mines Market Analysis
3.1. Growth Drivers
3.1.1. Expanding Demand for Clean Energy (Wind Turbines, EV Batteries)
3.1.2. Strategic Importance for Defense & Aerospace
3.1.3. Government Policies Promoting Mining and Domestic Manufacturing
3.1.4. Increasing Global Supply Chain Diversification
3.2. Market Challenges
3.2.1. Environmental Regulations and Sustainability Concerns
3.2.2. High Capital Investment & Technological Barriers
3.2.3. Dependence on International Suppliers for Rare Earth Separation
3.3. Opportunities
3.3.1. Technological Advancements in Separation Technologies
3.3.2. Expanding Applications in Emerging Technologies (5G, AI)
3.3.3. Joint Ventures and Collaborations with Global Companies
3.4. Trends
3.4.1. Growing Demand for Neodymium and Dysprosium in EV Motors
3.4.2. Rare Earth Recycling Initiatives
3.4.3. Geopolitical Influences on Rare Earth Supply Chain
3.5. Government Regulation
3.5.1. India National Mineral Policy
3.5.2. Mining and Mineral Laws
3.5.3. Initiatives for Self-Reliance (Atmanirbhar Bharat)
3.5.4. Environmental Compliance and Impact Assessment Guidelines
3.6. SWOT Analysis
3.7. Stake Ecosystem (Mining Companies, Refiners, Exporters)
3.8. Porters Five Forces
3.9. Competition Ecosystem
4. India Rare Earth Mines Market Segmentation
4.1. By Mineral Type (In Value %)
4.1.1. Neodymium
4.1.2. Praseodymium
4.1.3. Dysprosium
4.1.4. Terbium
4.1.5. Yttrium
4.2. By Application (In Value %)
4.2.1. Permanent Magnets
4.2.2. Catalysts
4.2.3. Phosphors
4.2.4. Metal Alloys
4.2.5. Glass Additives
4.3. By End-User Industry (In Value %)
4.3.1. Automotive
4.3.2. Electronics
4.3.3. Energy & Renewable Energy
4.3.4. Healthcare
4.3.5. Aerospace & Defense
4.4. By Region (In Value %)
4.4.1. Northern India
4.4.2. Southern India
4.4.3. Eastern India
4.4.4. Western India
4.5. By Mining Method (In Value %)
4.5.1. Open-Pit Mining
4.5.2. Underground Mining
4.5.3. In-Situ Leaching
5. India Rare Earth Mines Market Competitive Analysis
5.1. Detailed Profiles of Major Companies
5.1.1. Indian Rare Earths Ltd. (IREL)
5.1.2. Lynas Corporation Ltd.
5.1.3. MP Materials Corp.
5.1.4. Arafura Resources Ltd.
5.1.5. China Northern Rare Earth Group
5.1.6. Iluka Resources Ltd.
5.1.7. Alkane Resources Ltd.
5.1.8. Avalon Rare Metals Inc.
5.1.9. Greenland Minerals Ltd.
5.1.10. Texas Mineral Resources Corp.
5.1.11. Energy Fuels Inc.
5.1.12. Rare Element Resources Ltd.
5.1.13. Ucore Rare Metals Inc.
5.1.14. Canada Rare Earth Corporation
5.1.15. Rainbow Rare Earths Ltd.
5.2. Cross Comparison Parameters (Annual Revenue, Mining Capacity, Reserves, Production Costs, Global Footprint, Vertical Integration, Technology Adoption, ESG Initiatives)
5.3. Market Share Analysis
5.4. Strategic Initiatives
5.5. Mergers And Acquisitions
5.6. Investment Analysis
5.7. Government Grants
5.8. Joint Ventures and Collaborations
6. India Rare Earth Mines Market Regulatory Framework
6.1. National Mineral Exploration Policy
6.2. Environmental Licensing and Compliance
6.3. Rare Earth Export Regulations
6.4. Global Trade Relations and Impact on Exports
7. India Rare Earth Mines Future Market Size (In Metric Tons)
7.1. Future Market Size Projections
7.2. Key Factors Driving Future Market Growth
8. India Rare Earth Mines Future Market Segmentation
8.1. By Mineral Type (In Value %)
8.2. By Application (In Value %)
8.3. By End-User Industry (In Value %)
8.4. By Geography (In Value %)
8.5. By Mining Method (In Value %)
9. India Rare Earth Mines Market Analysts Recommendations
9.1. TAM/SAM/SOM Analysis
9.2. Customer Cohort Analysis
9.3. Marketing Initiatives
9.4. White Space Opportunity Analysis
Research Methodology
Step 1: Identification of Key Variables
The first step involved constructing an ecosystem map of the India Rare Earth Mines Market by identifying key stakeholders, including mining companies, refiners, and government agencies. This was done through desk research and analysis of proprietary databases to map out the critical factors influencing market dynamics.
Step 2: Market Analysis and Construction
Historical data related to rare earth production, demand from key sectors, and geographical mining activities were gathered. Revenue generation and market penetration were assessed through detailed analysis of industry statistics to estimate market size and future trends.
Step 3: Hypothesis Validation and Expert Consultation
Industry experts and company executives were consulted to validate the market hypotheses through in-depth interviews, ensuring a precise understanding of operational aspects and strategic growth areas for rare earth elements in India.
Step 4: Research Synthesis and Final Output
Data gathered was synthesized into actionable insights for market stakeholders, ensuring the reliability and comprehensiveness of the final output, which provides a robust understanding of Indias rare earth market dynamics.
Frequently Asked Questions
01 How big is the India Rare Earth Mines Market?
The India Rare Earth Mines Market is valued at USD 2900 metric tons, driven by the rising demand for clean energy technologies, electric vehicles, and high-tech electronics.
02 What are the challenges in the India Rare Earth Mines Market?
Challenges in the India Rare Earth Mines Market include environmental concerns related to mining, high capital investment in extraction technologies, and reliance on foreign suppliers for rare earth separation technologies.
03 Who are the major players in the India Rare Earth Mines Market?
Major players in the India Rare Earth Mines Market include Indian Rare Earths Ltd., Lynas Corporation Ltd., MP Materials Corp., and China Northern Rare Earth Group, dominating due to their advanced extraction capacities and strategic reserves.
04 What are the growth drivers of the India Rare Earth Mines Market?
Key growth drivers in the India Rare Earth Mines Market include the increasing demand for electric vehicles, government initiatives to boost domestic production, and the strategic importance of rare earths in defense and clean energy sectors.
05 What are the opportunities in the India Rare Earth Mines Market?
Opportunities in the India Rare Earth Mines Market include technological advancements in rare earth recycling, expanding applications in emerging technologies like 5G and AI, and strategic partnerships with global companies.
Why Buy From Us?
 Framework")
What makes us stand out is that our consultants follows Robust, Refine and Result (RRR) methodology. i.e. Robust for clear definitions, approaches and sanity checking, Refine for differentiating respondents facts and opinions and Result for presenting data with story

We have set a benchmark in the industry by offering our clients with syndicated and customized market research reports featuring coverage of entire market as well as meticulous research and analyst insights.

While we don't replace traditional research, we flip the method upside down. Our dual approach of Top Bottom & Bottom Top ensures quality deliverable by not just verifying company fundamentals but also looking at the sector and macroeconomic factors.

With one step in the future, our research team constantly tries to show you the bigger picture. We help with some of the tough questions you may encounter along the way: How is the industry positioned? Best marketing channel? KPI's of competitors? By aligning every element, we help maximize success.

Our report gives you instant access to the answers and sources that other companies might choose to hide. We elaborate each steps of research methodology we have used and showcase you the sample size to earn your trust.

If you need any support, we are here! We pride ourselves on universe strength, data quality, and quick, friendly, and professional service.